-
-

Only Png, Demo in the Github Links!
Inspiration
Modern molecular biology and genetics research heavily relies on large-scale datasets. Proper preprocessing and visualization of such data are crucial for accelerating biomedical discoveries. The inspiration behind this project was to create a tool that makes gene expression data more accessible, interpretable, and visually insightful.
What I Learned
Through this project, I learned to:
Apply preprocessing techniques on high-dimensional genomic datasets,
Use Principal Component Analysis (PCA) for dimensionality reduction,
Implement 3D visualization methods,
Leverage Python’s data science ecosystem (Pandas, NumPy, Scikit-learn),
Build interactive bioinformatics applications using Streamlit.
How I Built It
The project was developed in the following steps:
Data Preprocessing: Cleaning missing values and transforming the raw dataset into an analysis-ready format.
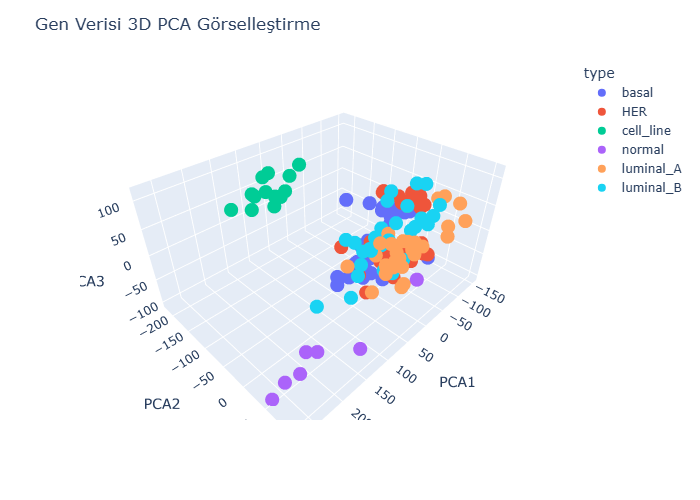
Dimensionality Reduction: Reducing the gene expression dataset (with over 54,000 features) into 3 dimensions using PCA.
𝑍=𝑋𝑊,𝑊∈𝑅𝑛×3Z=XW,W∈Rn×3
Visualization: Generating 3D PCA scatter plots using Plotly.
Interactive Interface: Deploying a user-friendly application with Streamlit.
Challenges
The dataset was extremely high-dimensional (50,000+ features), which posed challenges for memory management and computation time.
Optimizing PCA required the use of chunking strategies (processing the dataset in smaller parts).
Designing a 3D visualization that was both academically rigorous and user-friendly required iterative refinement.
Conclusion
This project demonstrates an effective pipeline for preprocessing, analyzing, and visualizing high-dimensional gene expression data. The methodology can be easily extended to other types of biological datasets and disease-focused research, offering a foundation for future bioinformatics applications.
Built With
- kaleido
- numpy
- pandas
- plotly
- python
- scikit-learn
- streamlit

Log in or sign up for Devpost to join the conversation.