Inspiration
Logistics and transport planning problems are often solved with powerful optimization models, yet their results are difficult to interpret, trust, and communicate—especially to decision-makers who are not optimization experts.
From working with real-world logistics data in the Mekong Delta, including multi-modal road–waterway networks, logistics hubs, ports, and commodity flows, we observed a recurring gap:
- Optimization models compute good solutions
- Stakeholders struggle to understand why those solutions are chosen
- It is unclear how much money is actually saved
- Robustness under changing conditions is rarely explained
This project was inspired by the idea that large language models should not replace optimization, but instead act as a decision intelligence layer on top of real, graph-based transport models.
What it does
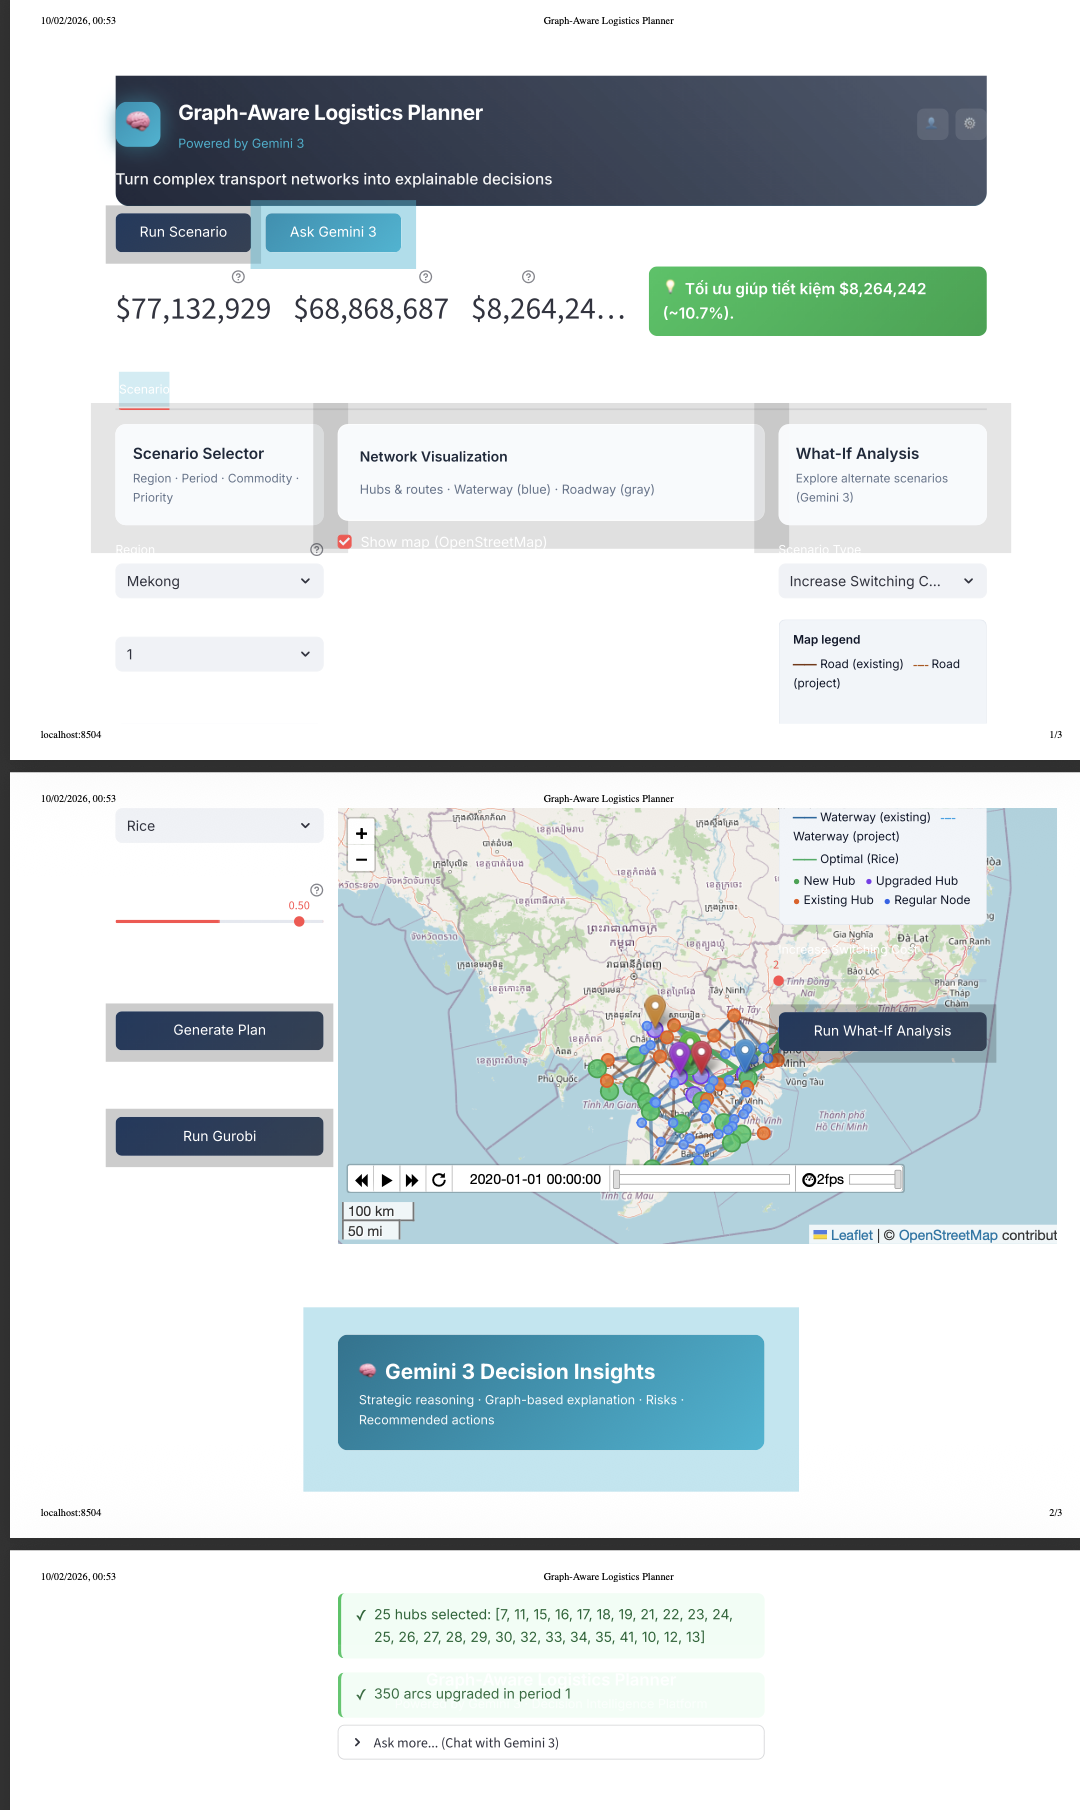
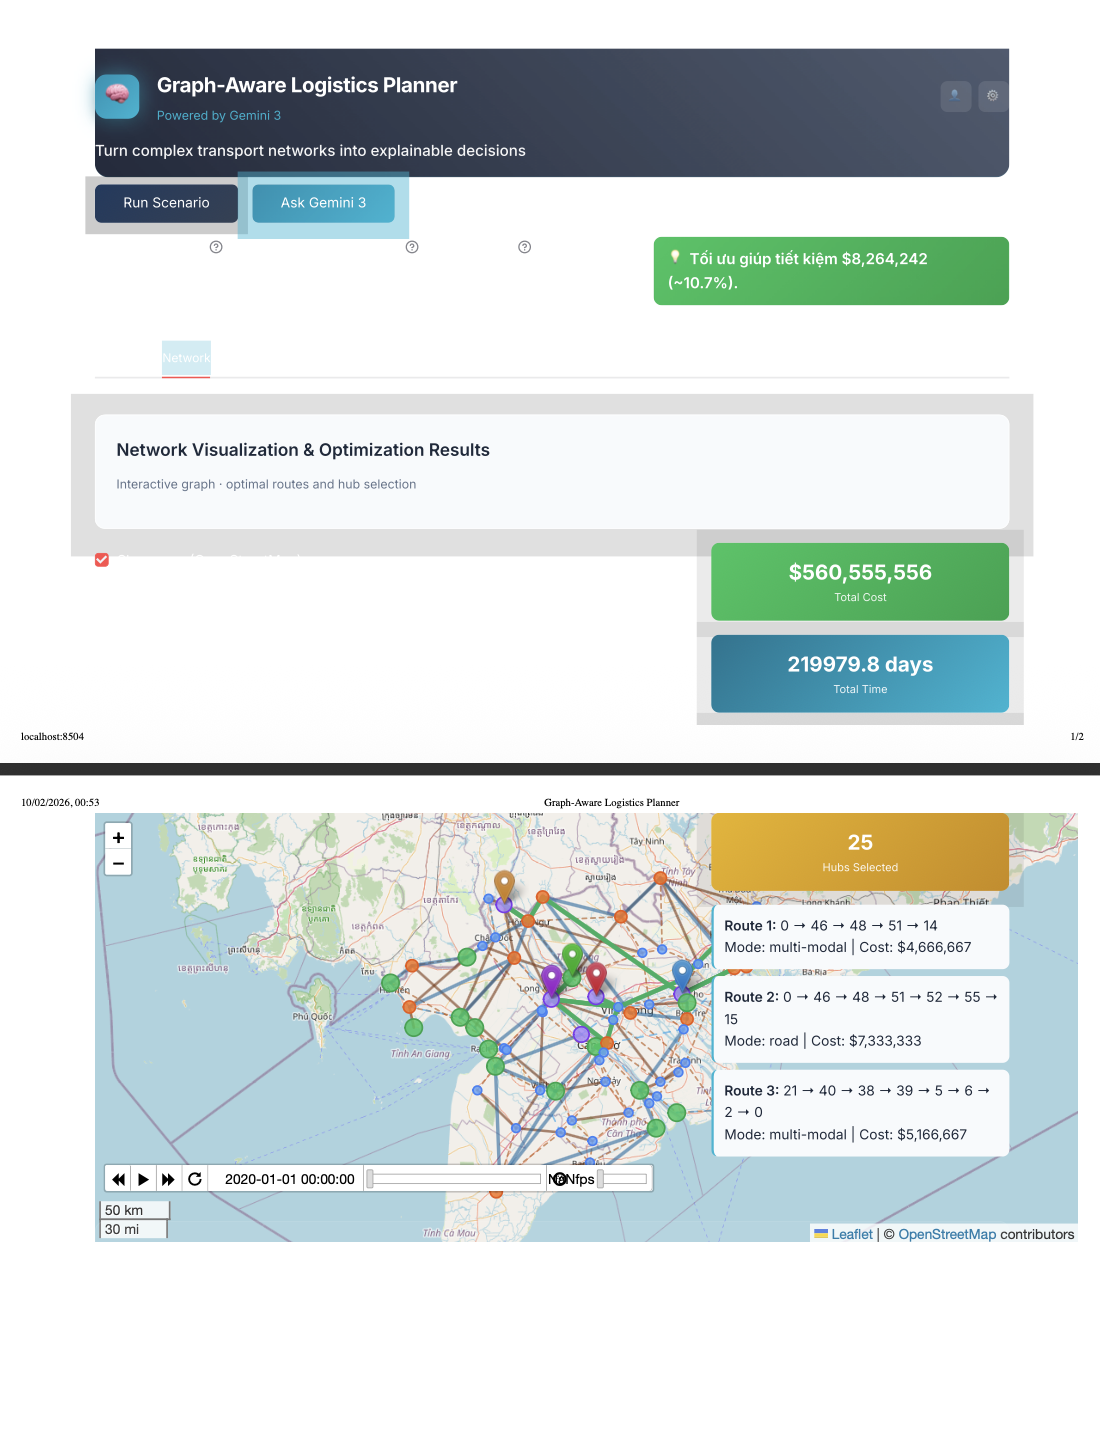
Gemini3-multimodal is a graph-aware logistics planner that turns real-world transport optimization results into explainable, cost-aware decisions.
The application:
- Runs on real logistics datasets from the Mekong Delta
- Supports additional regional datasets via a standardized graph schema
- Compares baseline vs optimized logistics strategies
- Quantifies logistics cost savings
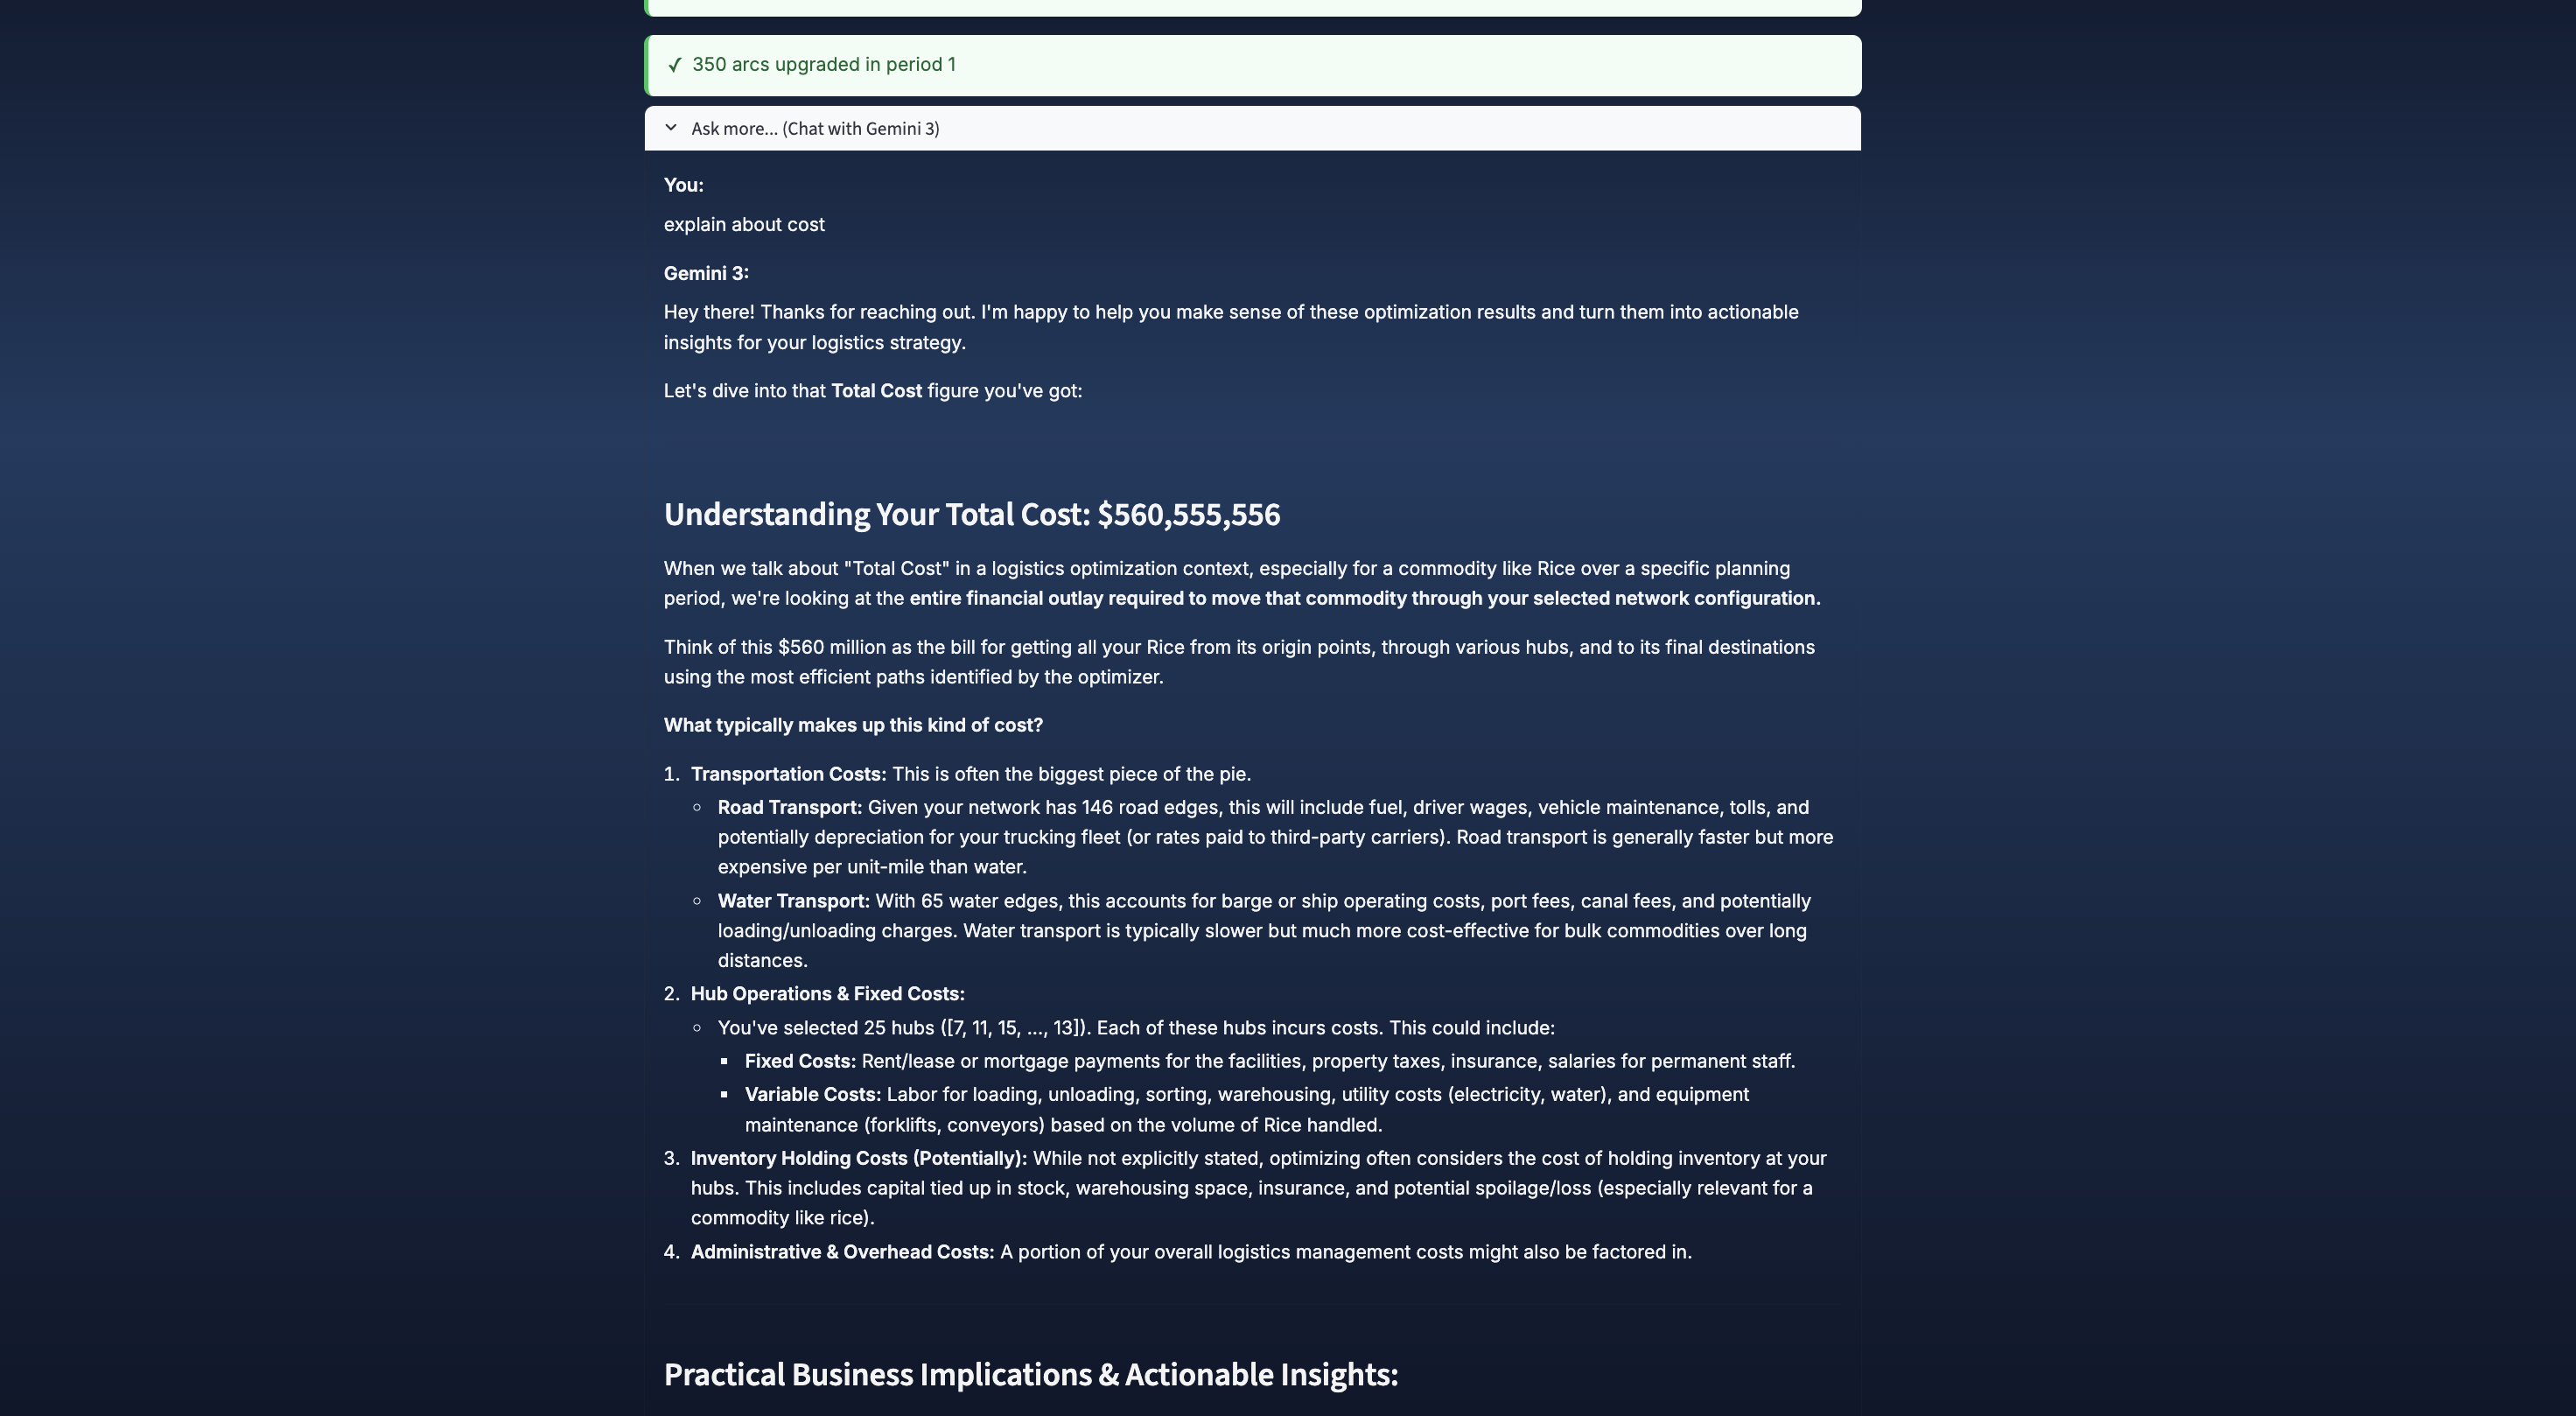
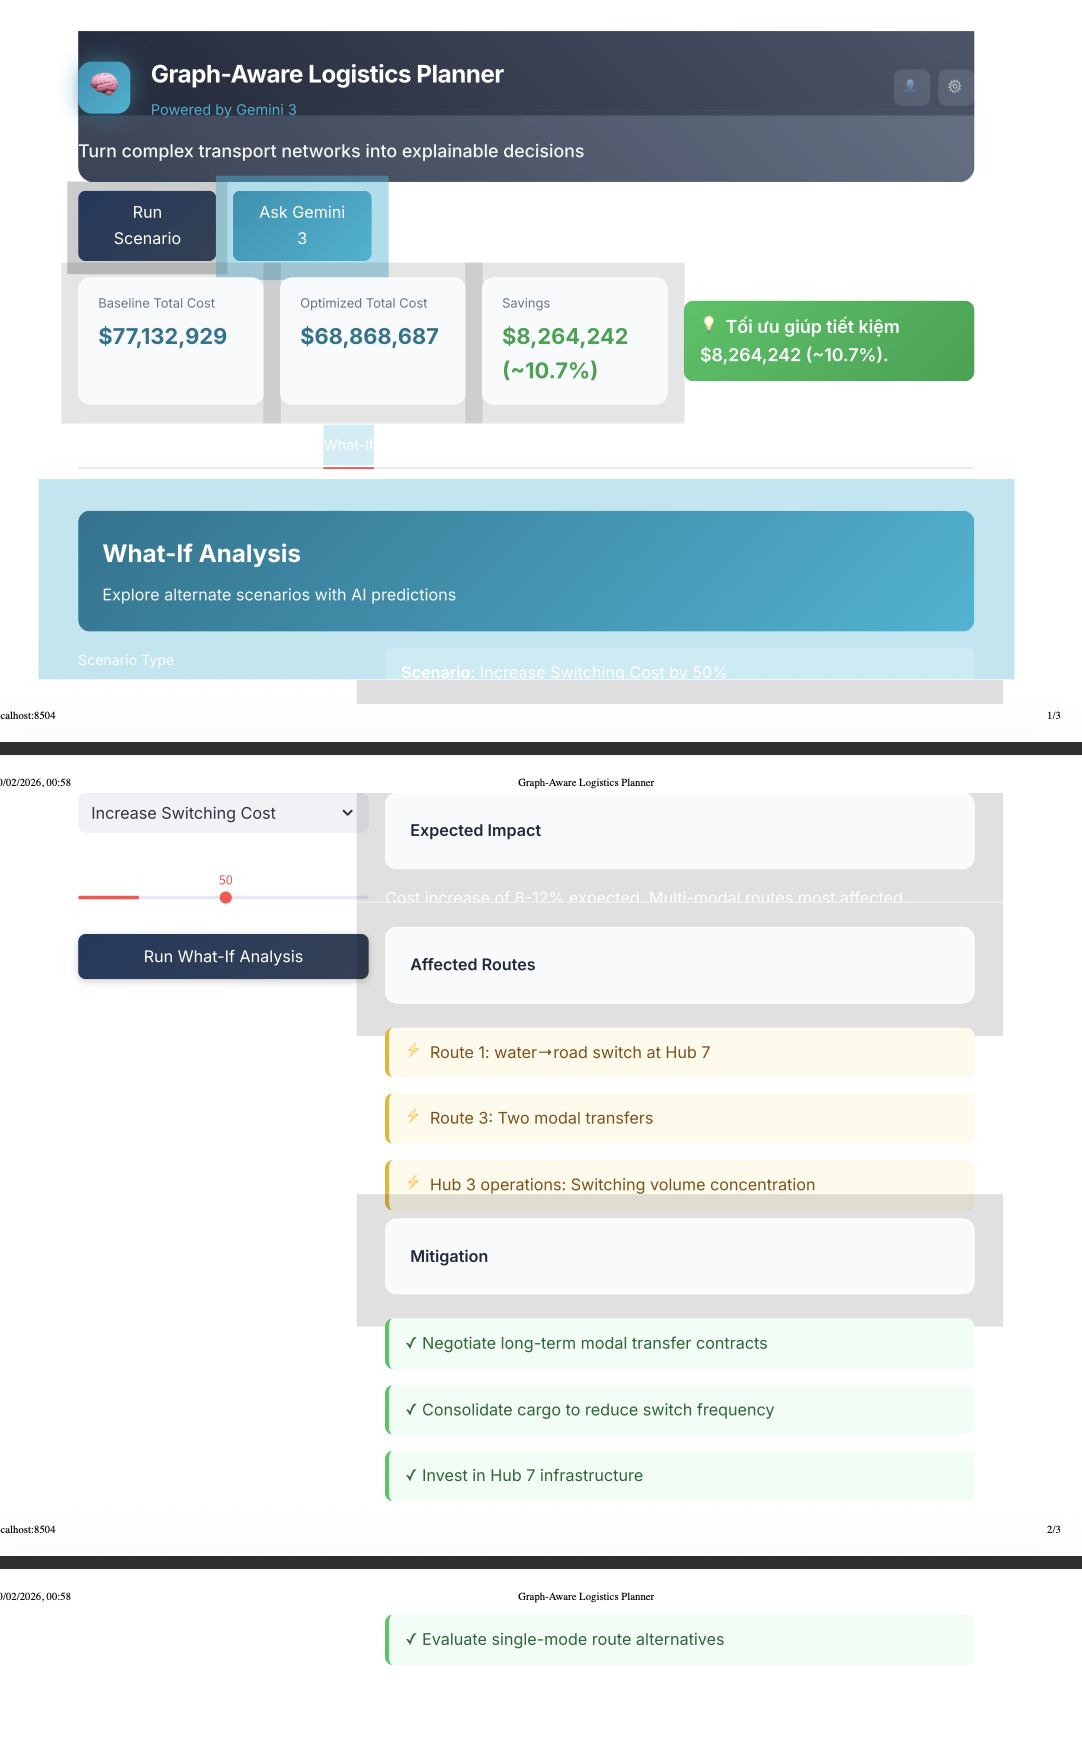
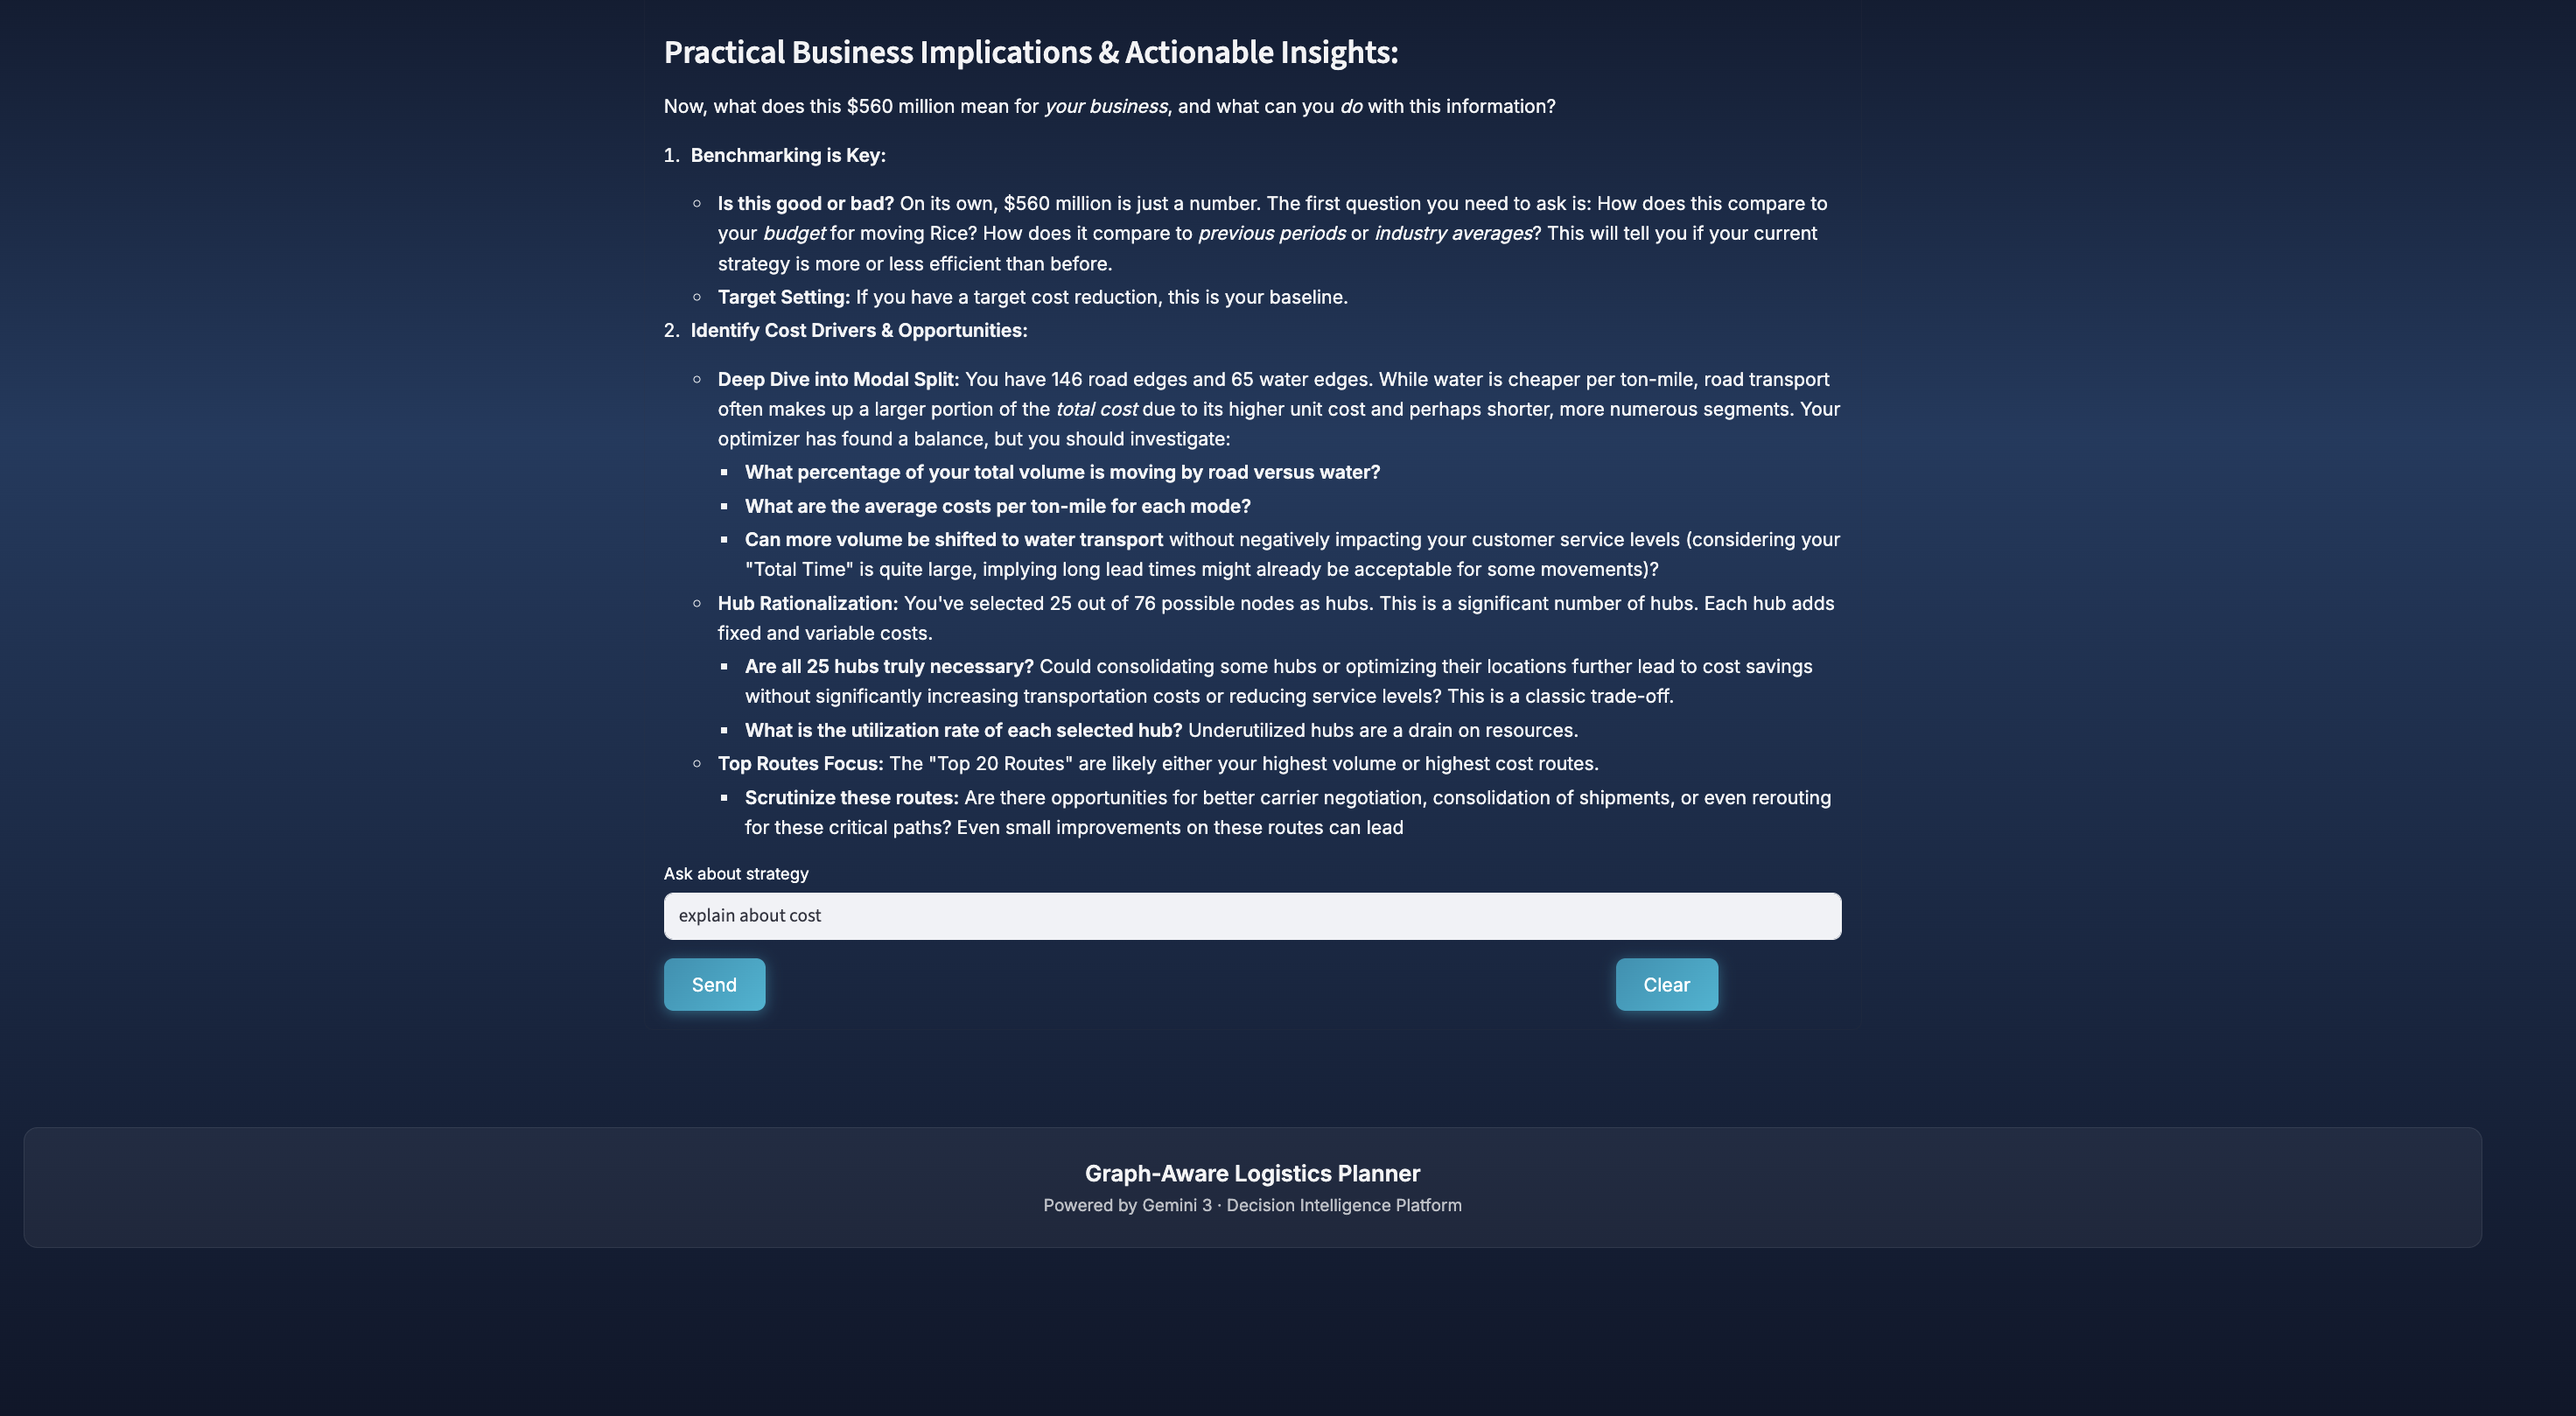
- Uses Gemini 3 to explain decisions and reason about what-if scenarios
How we built it
The system is a single-page web application with a strict separation between numeric computation and AI reasoning.
Optimization backbone
- Real-world transport and logistics data (Mekong Delta)
- Precomputed baseline and optimized solutions
- Deterministic cost calculation by mode, commodity, and switching penalties
Decision intelligence layer (Gemini 3)
Gemini 3 is used for:
- Semantic normalization of heterogeneous logistics datasets
- Graph-aware explanation of optimization results
- Interpretation of cost savings
- Counterfactual what-if reasoning (without re-running solvers)
Web application
- Python + Streamlit
- NetworkX + Matplotlib for graph visualization
- Three main tabs: Network, Explain, What-if
Cost savings formulation
Logistics cost savings are computed deterministically:
$$ Savings = C_{\text{baseline}} - C_{\text{optimized}} $$
$$ Savings\ Ratio = \frac{C_{\text{baseline}} - C_{\text{optimized}}}{C_{\text{baseline}}} $$
Inline interpretation example: The optimized strategy reduces cost when \( C_{\text{optimized}} < C_{\text{baseline}} \).
Gemini 3 does not compute these values. It only explains why the difference occurs.
Challenges we ran into
- Real-world data complexity Mekong Delta logistics data is heterogeneous and incomplete, requiring careful normalization.
- Avoiding AI hallucination Numeric computation and AI reasoning are strictly separated so Gemini 3 never fabricates costs.
- Usability vs realism Presenting complex transport graphs in an intuitive interface was non-trivial.
Accomplishments that we're proud of
- Running the system on real Mekong Delta logistics data
- Designing a reusable, multi-region architecture
- Using Gemini 3 as a strategic reasoning engine, not a solver
- Explicitly quantifying and explaining real logistics cost savings
- Creating a clear workflow: observe networks → explain decisions → anticipate change
What we learned
- Real-world logistics optimization is limited more by interpretability than algorithms
- LLMs are most effective when reasoning over structured graph outputs
- Combining optimization with AI reasoning leads to more trustworthy decisions
What's next for Gemini3-multimodal
- Expand to additional real-world regions
- Support more transport modes (rail, coastal shipping)
- Integrate uncertainty and climate-impact scenarios
- Generate stakeholder-specific explanations using Gemini 3

Log in or sign up for Devpost to join the conversation.