-
-
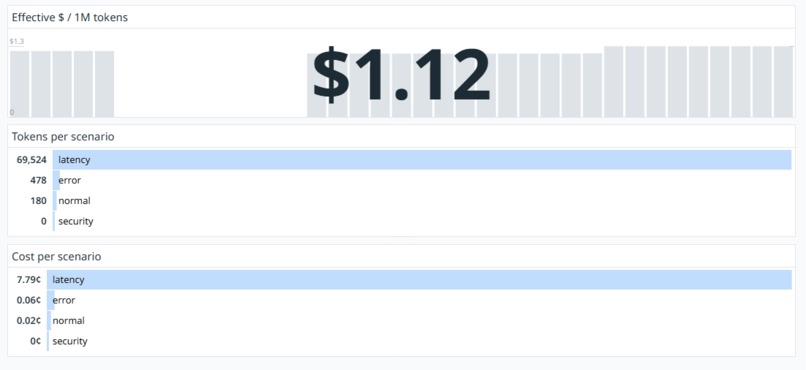
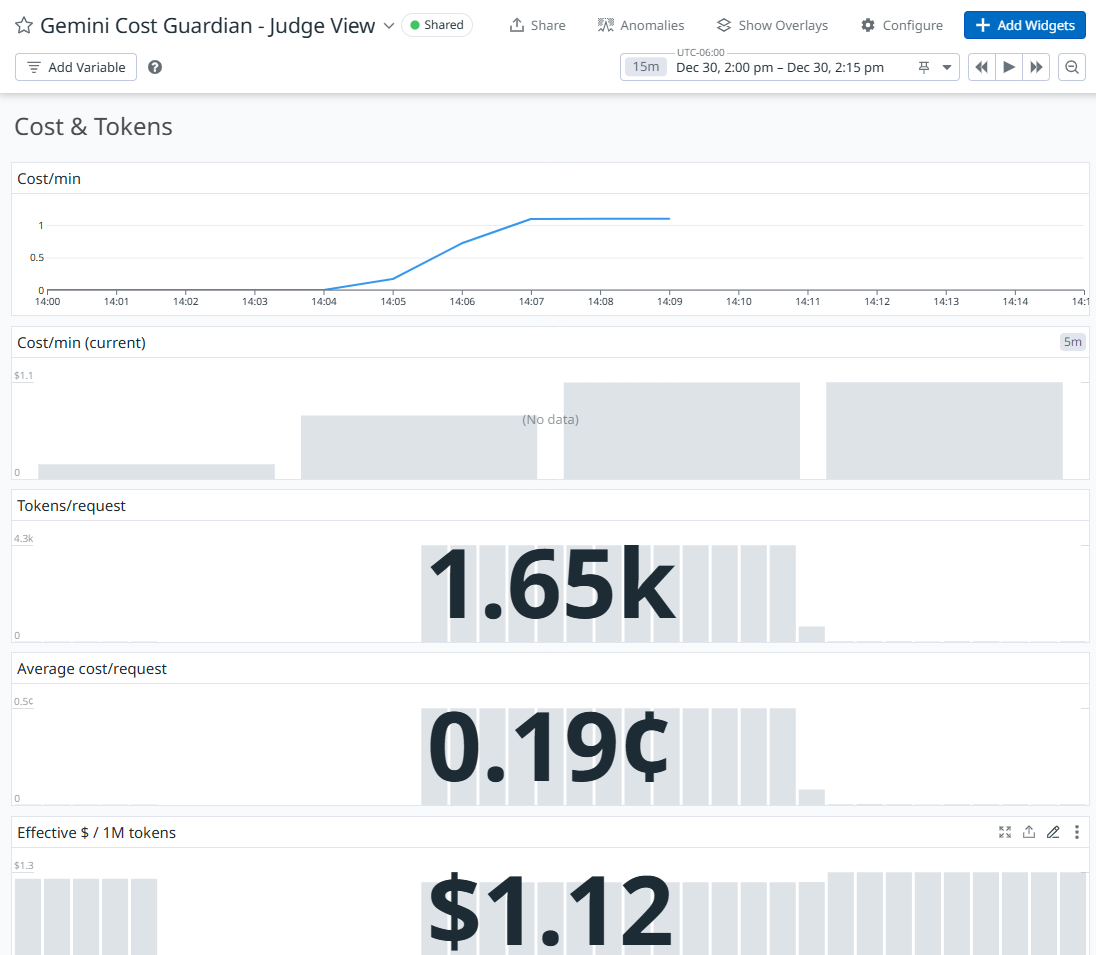
Cost & Tokens cont...
-
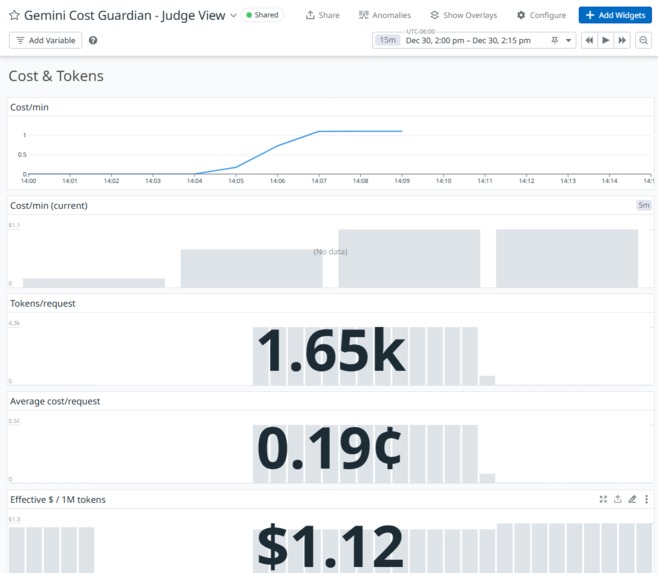
Cost & Tokens
-
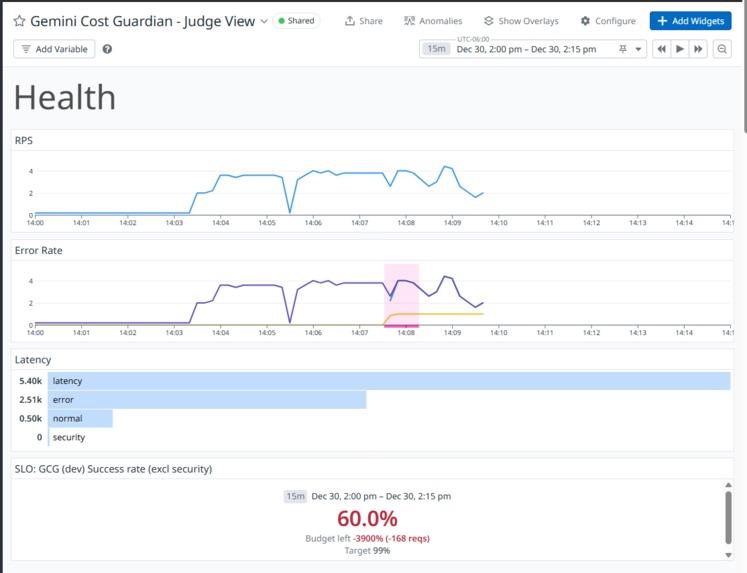
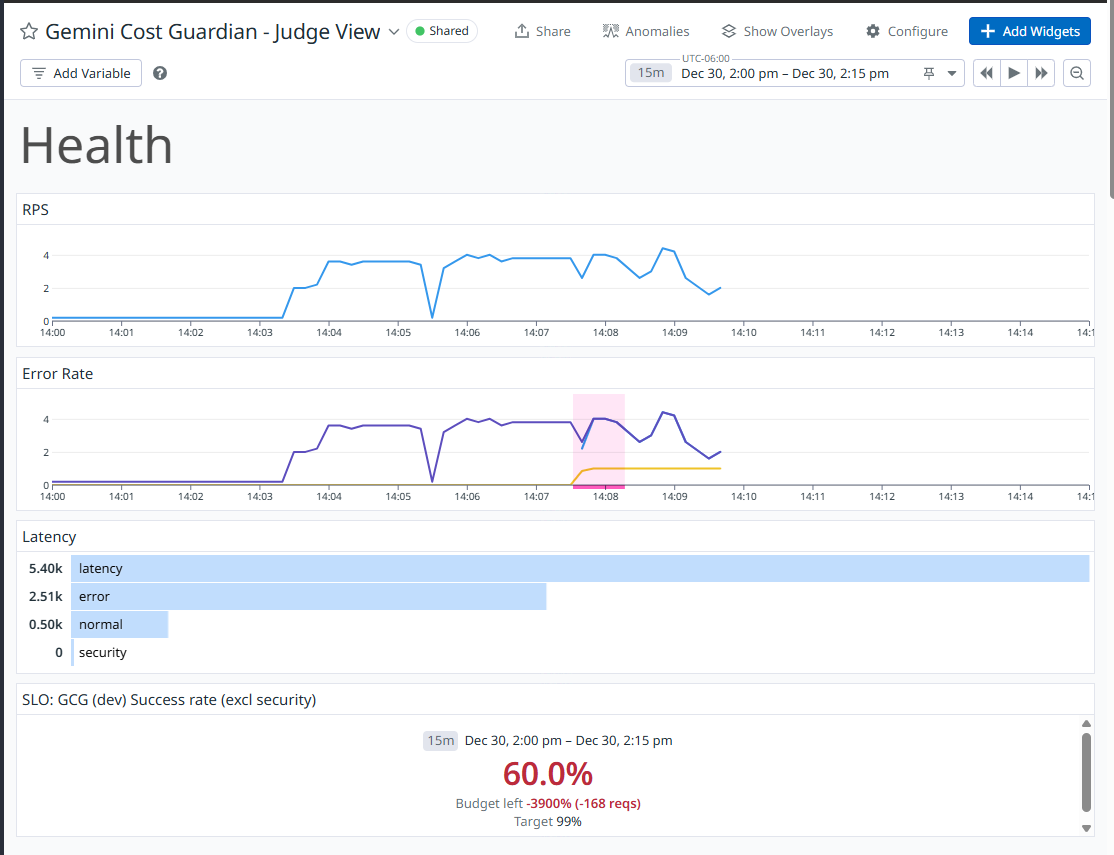
Health section
-
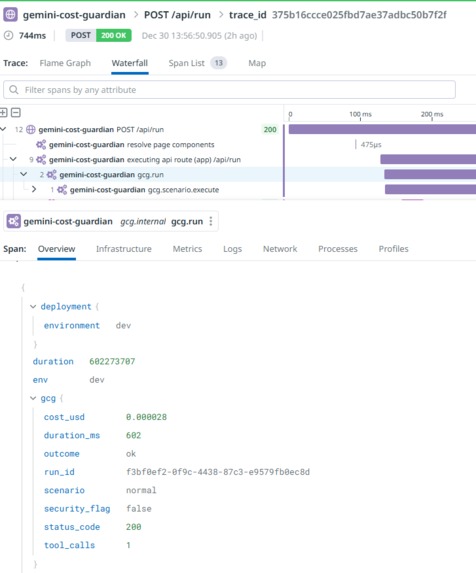
APM -> Traces
-

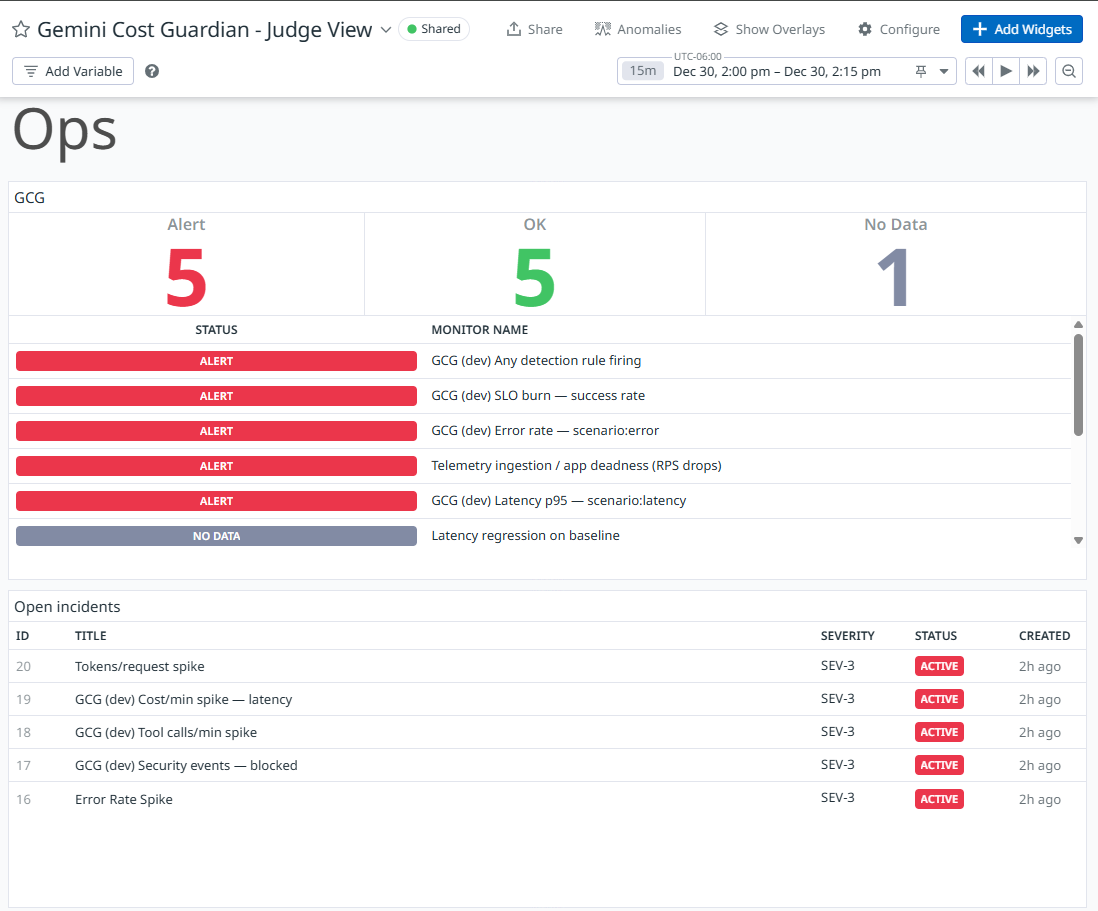
Detection/Actionables
-
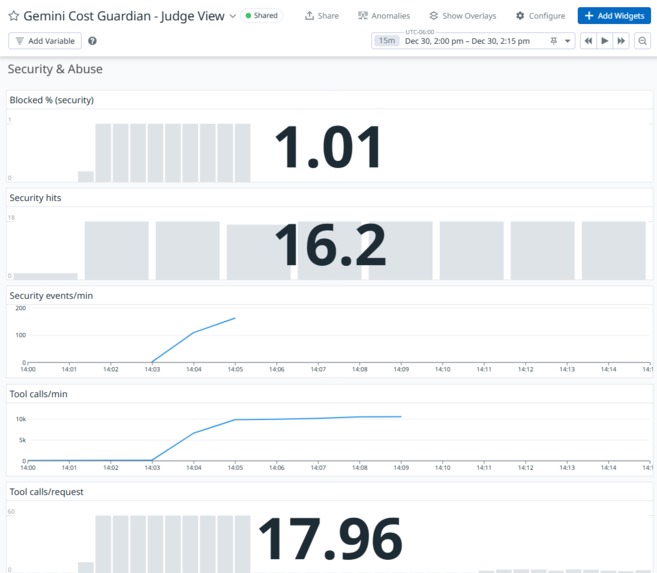
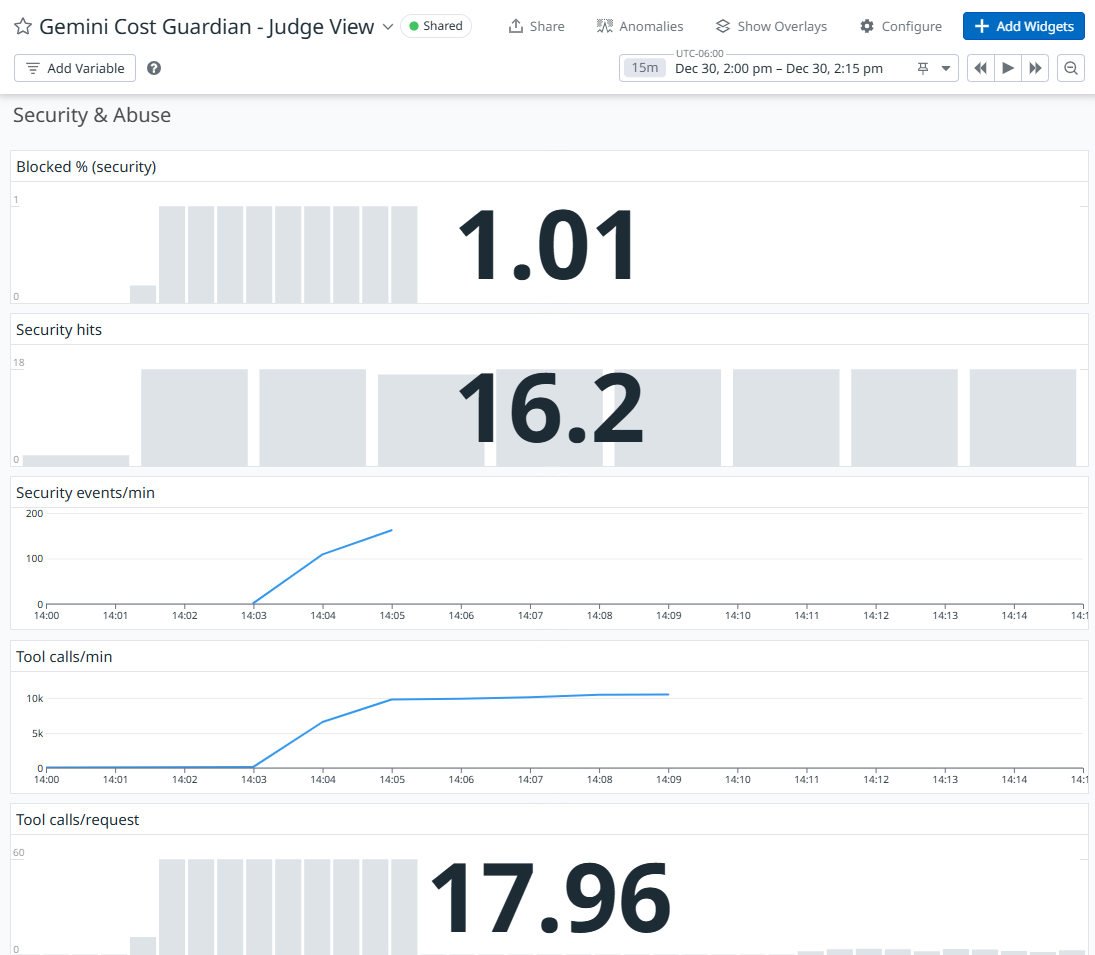
Security & Abuse
-
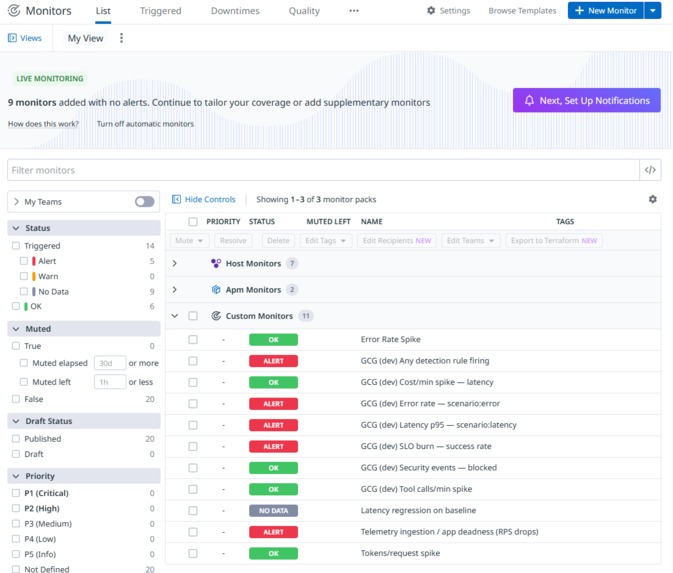
Monitor List
-
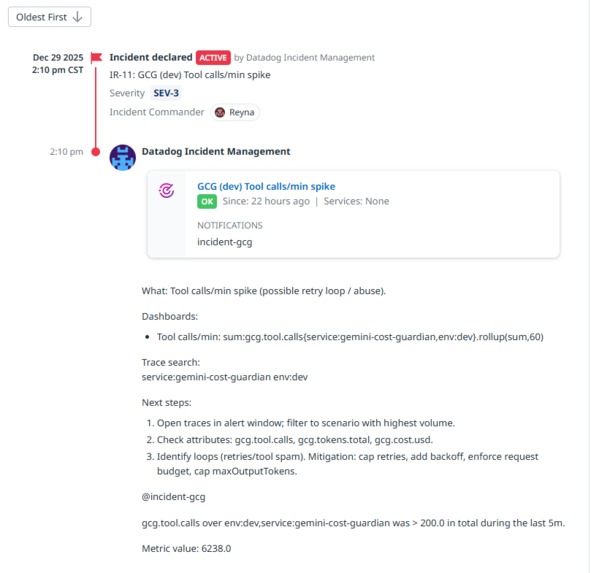
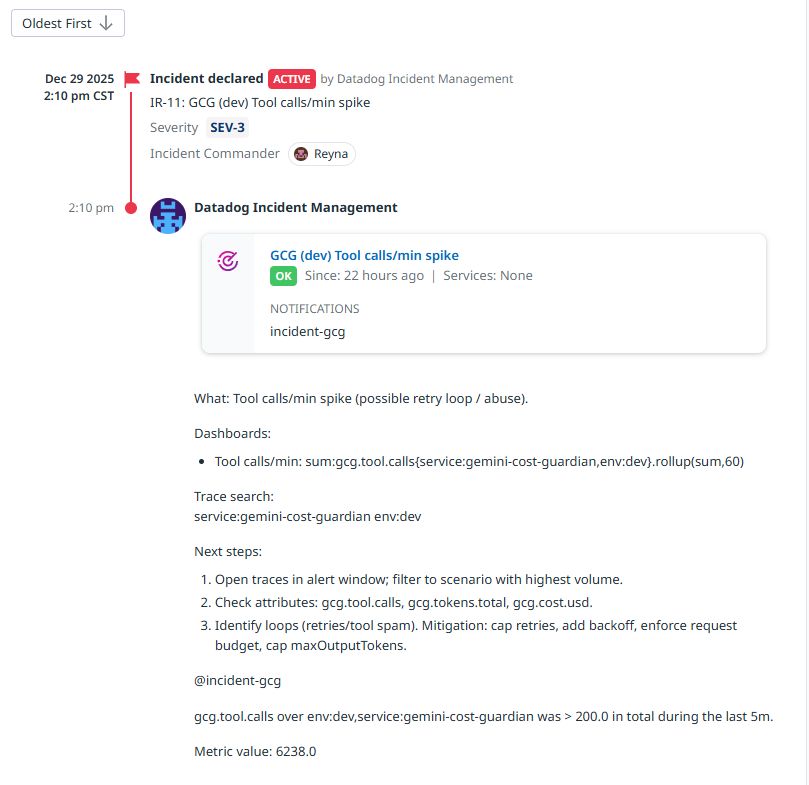
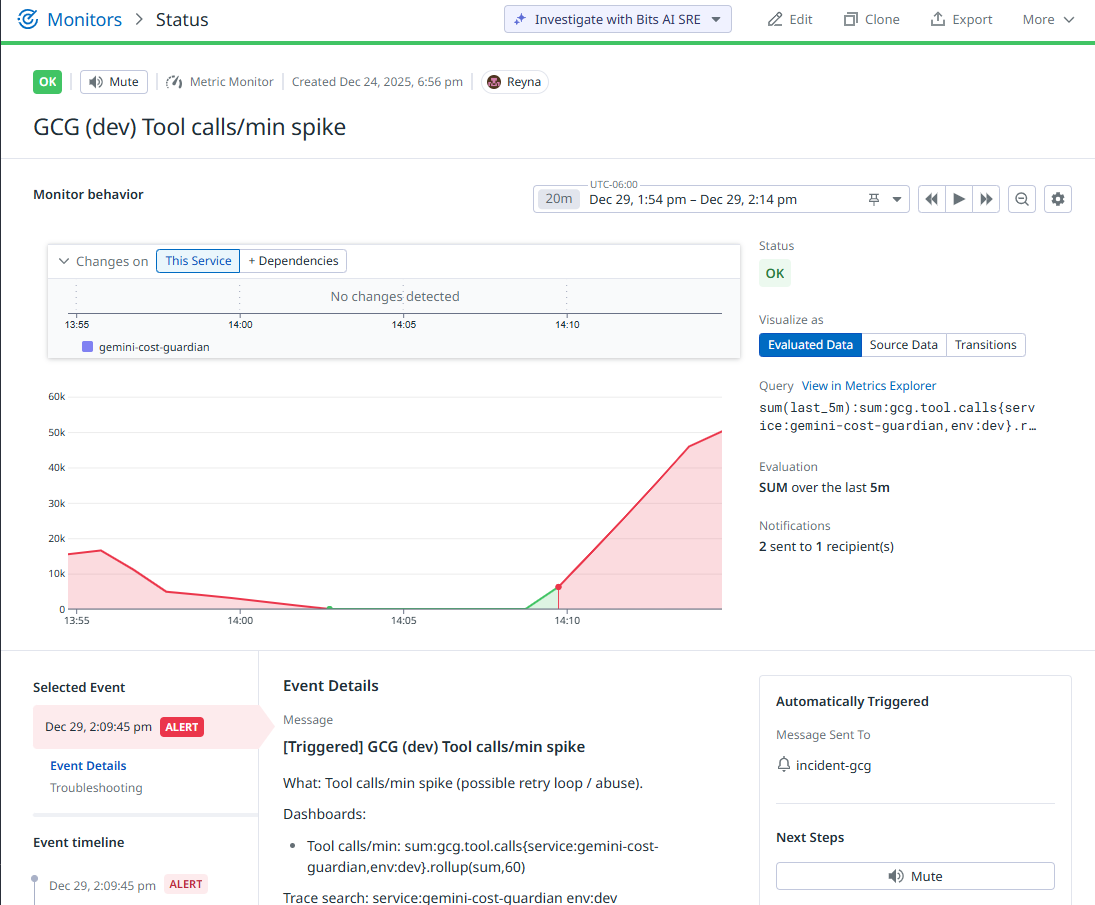
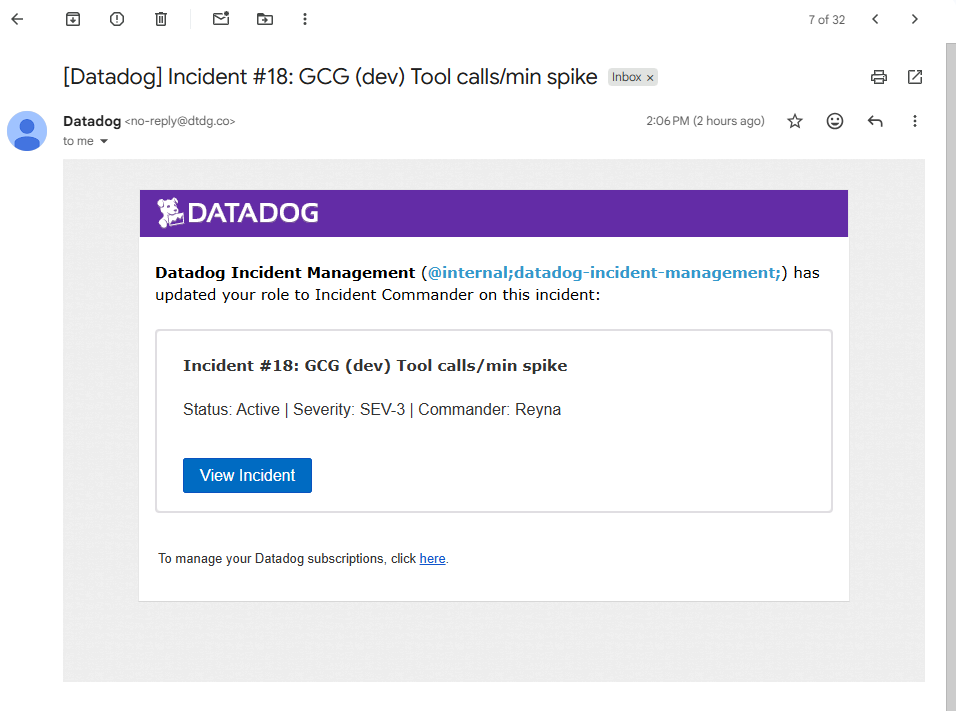
Tool calls/min spike Incident: Query, Threshold, Evaluation Window, Tags/Scope (service/env/scenario), Notif message-runbook + trace search
-
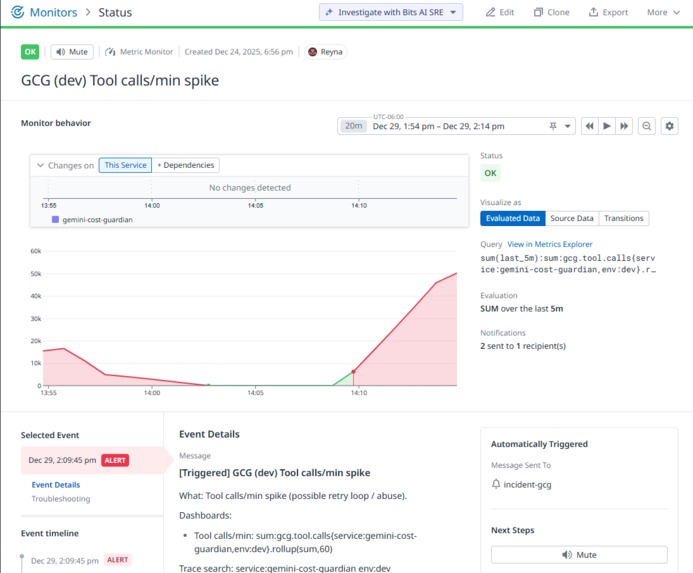
Monitor in alert
-
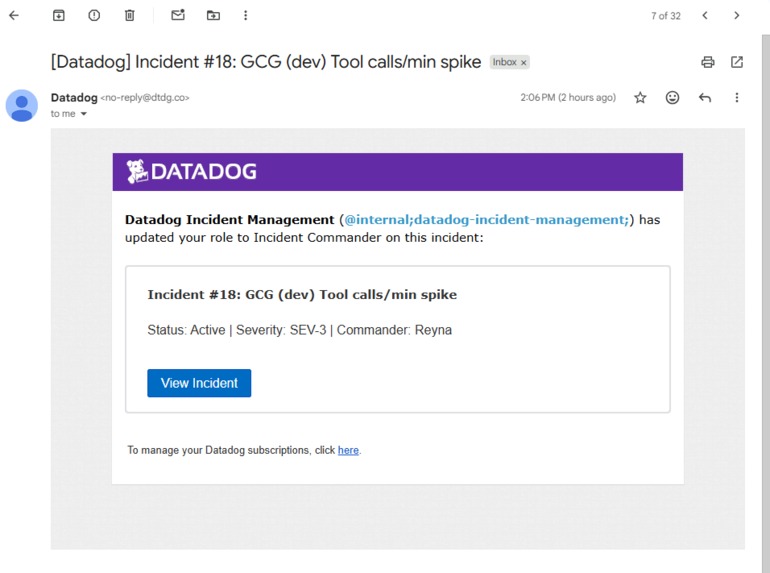
Datadog Incident Email
-
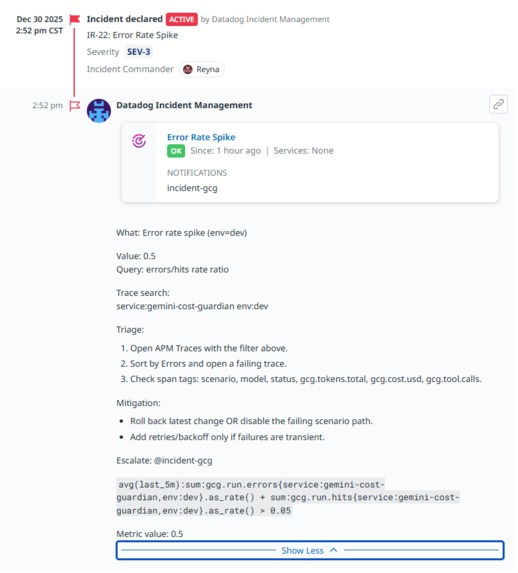
Error rate spike cont...
-
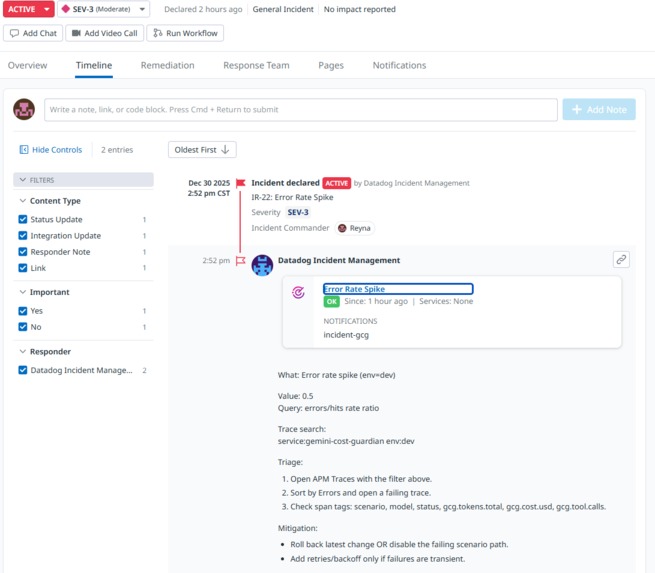
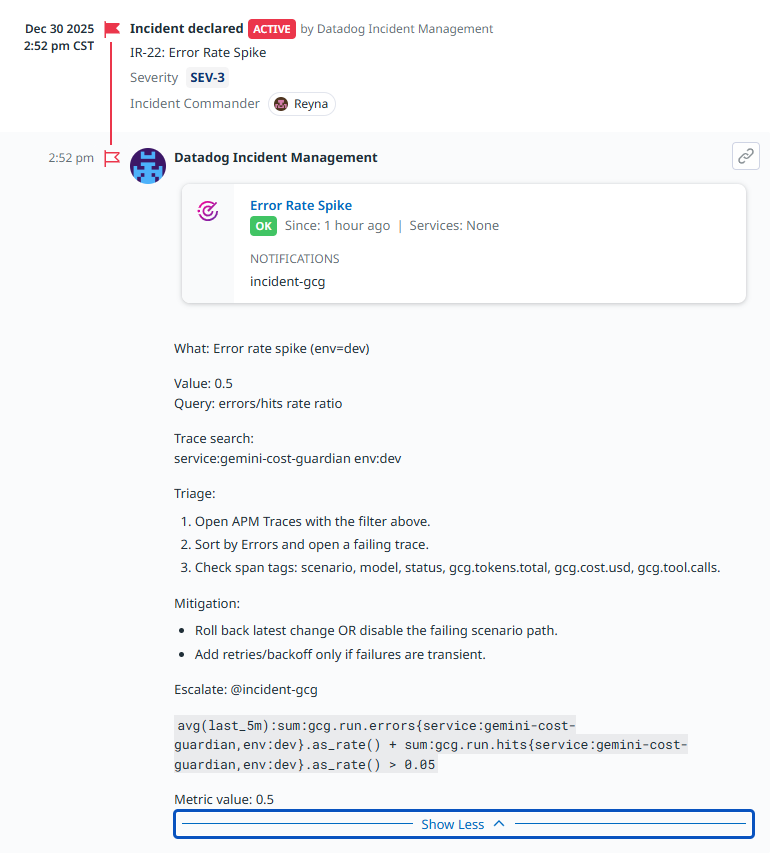
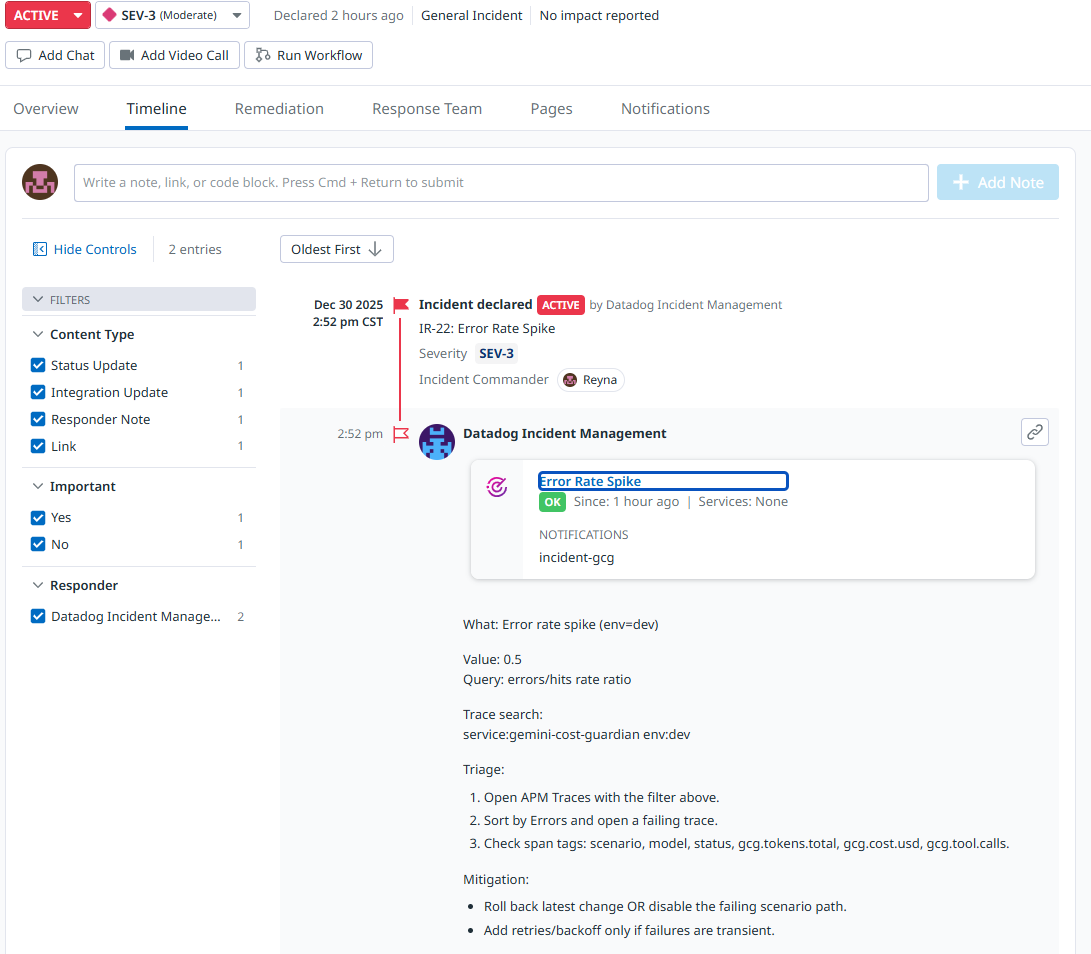
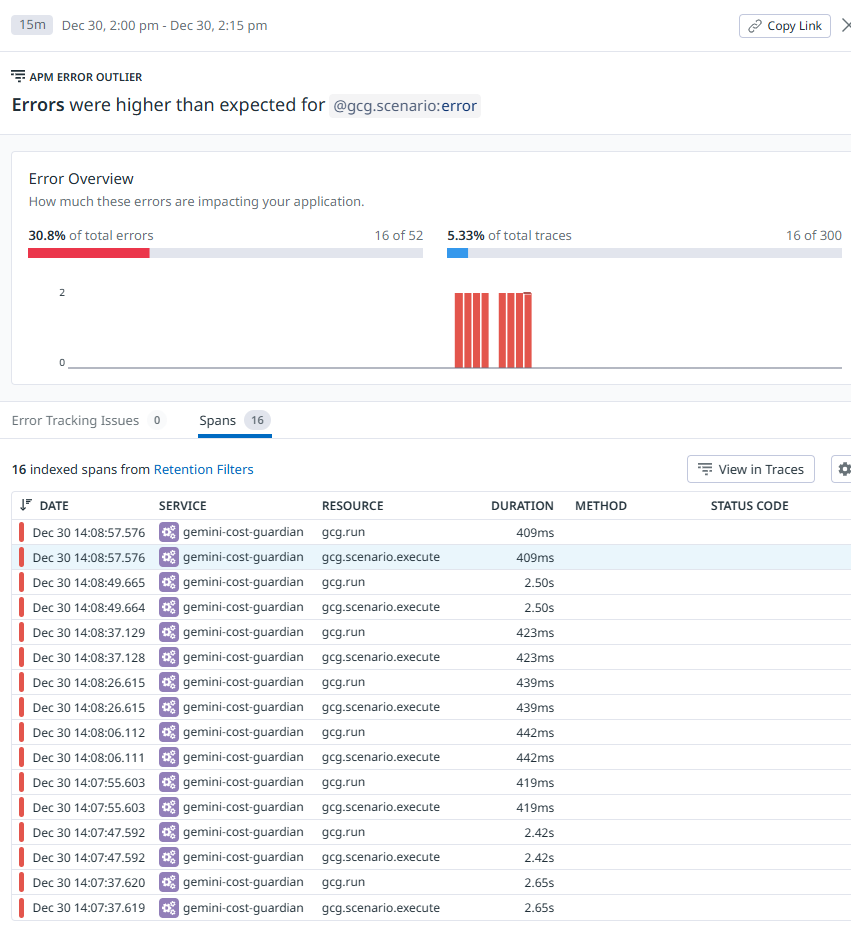
Error rate spike
-
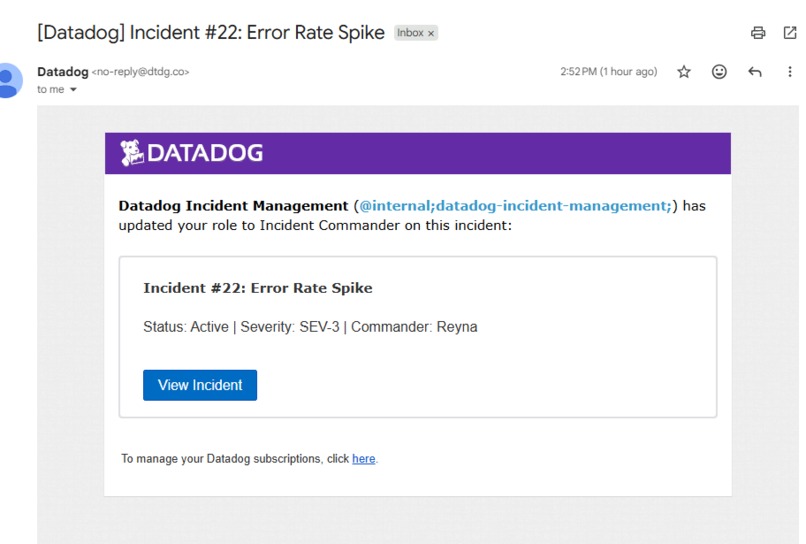
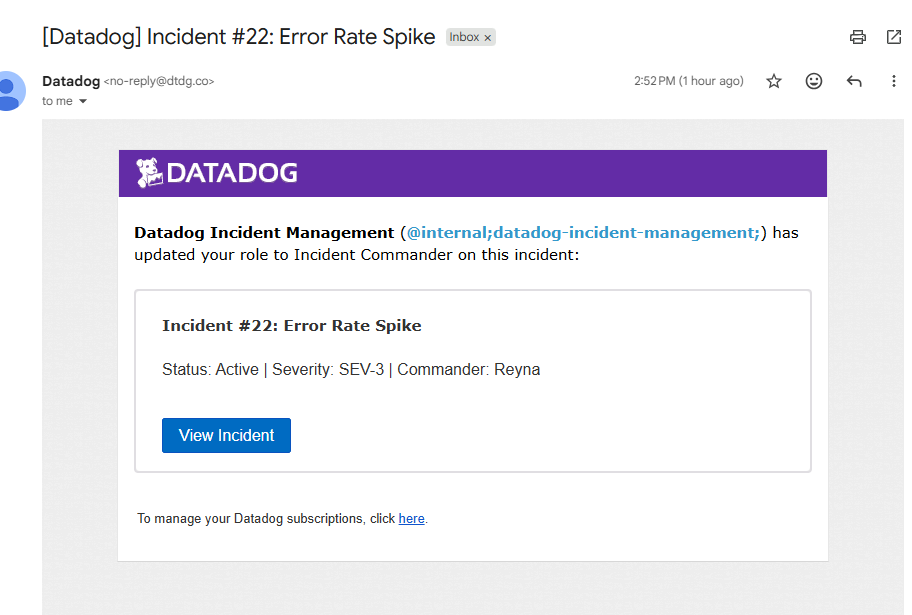
Error rate spike Datadog Incident Email
-
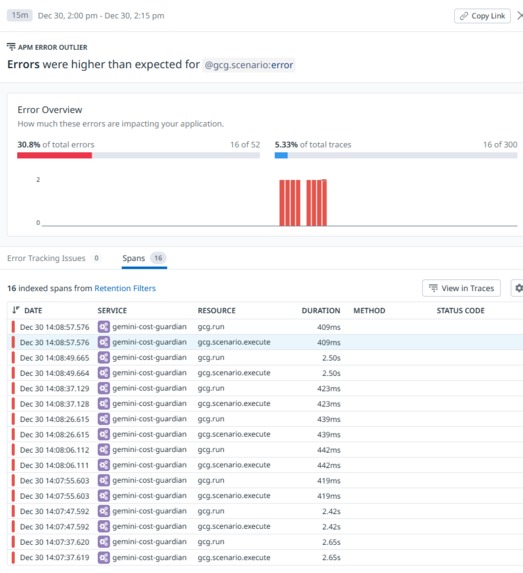
APM -> Traces for Error rate spike
-

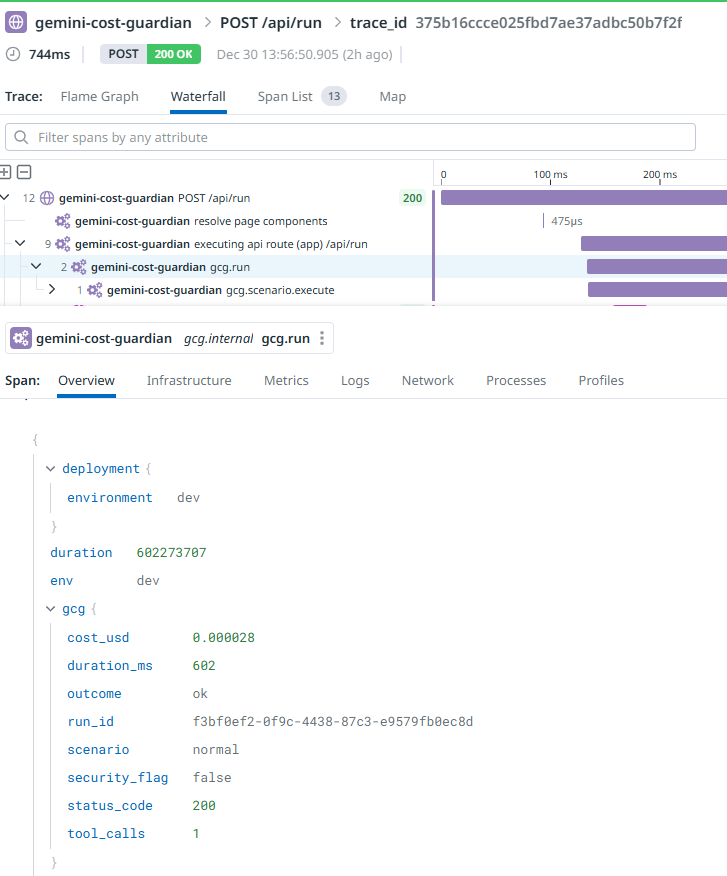
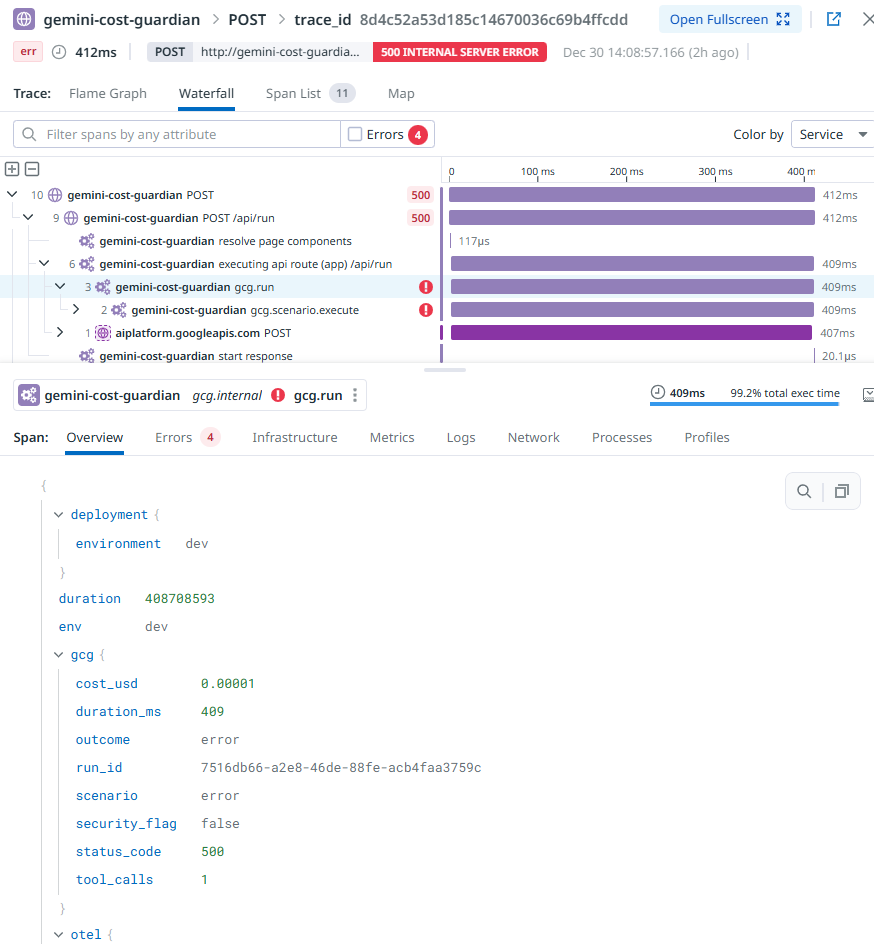
Error rate spike drilldown (gcg.run)
-

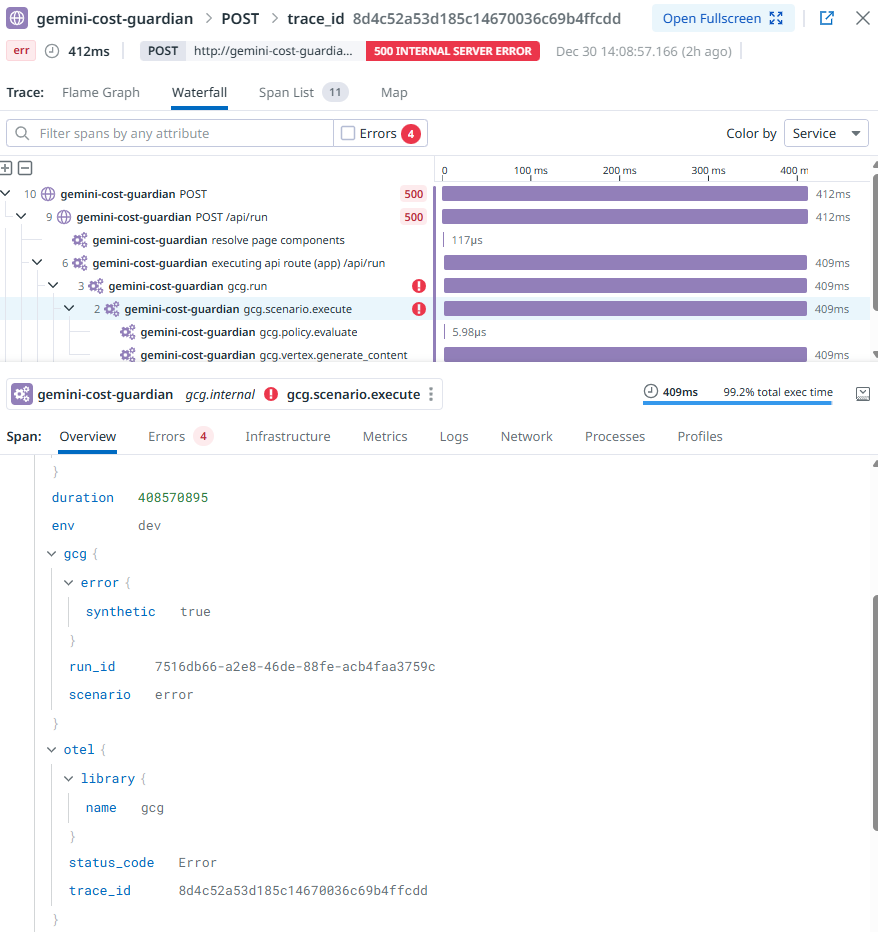
Error rate spike drilldown (gcg.scenario.execute)


Inspiration
LLM incidents don't look like normal outages. On Vertex AI/Gemini, the biggest real-world failure modes are token bloat, retry storms, tool-call fanout, and prompt-injection/abuse attempts that silently burn money while latency degrades. I built Gemini Cost Guardian to make those LLM-native failure modes observable and actionable in Datadog - not just "CPU is fine" charts.
What it does
Gemini Cost Guardian is an end-to-end observability and response layer for a Vertex AI/Gemini app:
- Streams OpenTelemetry traces + custom metrics into Datadog via an OTel Collector sidecar on Cloud Run
- Shows a "Judge View" dashboard for health + LLM behavior: latency, errors, tokens, cost, tool calls, security events, and an SLO
- Defines detection rules (monitors) for reliability, latency regression, spend/usage spikes, and abuse patterns
- Auto-creates Incidents when rules trigger, including signal context + trace search + runbook steps
- Includes a traffic generator that deterministically triggers each failure mode so the full loop is demoable on demand
How we built it
Architecture
- Next.js app on Cloud Run calling Vertex AI/Gemini
- OpenTelemetry instrumentation emits OTLP traces + metrics to a local OTel Collector sidecar
- Collector exports telemetry to Datadog
Tracing
- Every request creates spans including gcg.run (root) and gcg.scenario.execute
- Root span attributes carry the triage context: scenario, outcome, status, duration, cost, tool calls, security flag
Metrics
- Health: gcg.run.hits, gcg.run.errors, gcg.run.duration_ms
- LLM economics: gcg.tokens.prompt, gcg.tokens.output, gcg.tokens.total, gcg.cost.usd
- Security/abuse: gcg.security.events, gcg.tool.calls
Datadog configuration
- Dashboard sections: Health, Cost & Tokens, Security & Abuse, SLO, and monitor status
- Monitors trigger incidents and include trace search + runbook text
- JSON exports captured for dashboards/monitors/SLOs
Traffic generator A TypeScript script runs phased traffic (warmup -> abuse -> latency -> error), sustains long enough for monitor windows, and prints trace IDs to make drill-down immediate.
Detection-rule rationale
Error rate spike (reliability)
- Signal: error rate/5xx outcomes on /api/run
- Why it matters: LLM failures often trigger retries; you can accumulate token/cost burn even while failing. This rule catches reliability regressions early and surfaces incidents where failures are expensive.
P95 latency regression on baseline/normal (performance)
- Signal: p95 latency on baseline traffic (not the forced latency demo scenario)
- Why it matters: User experience degrades before "hard" errors. Latency can grow from larger prompts, model slowdowns, or downstream tool bottlenecks.
Cost/min or tokens/request spike (spend control)
- Signal: USD cost per minute or tokens per request
- Why it matters: Spend is a first-class production risk for LLM apps. Cost can spike with prompt bloat, repeated retries, or tool fanout even when success rate stays high.
(Optional) Tool calls/min spike + Security blocked (abuse)
- Signal: tool-call rate and blocked/security events
- Why it matters: Prompt injection and abuse often shows up as tool spam or blocked policy decisions. This rule catches misuse patterns quickly and creates an incident with trace drilldown.
Challenges we ran into
- SLOs vs chaos testing: Injected failures make long-window SLOs look "broken." For a demo, the SLO is shown for the current dashboard window during warmup (baseline reliability), while monitors/incidents validate the injected failure modes.
- Getting deterministic detection: Monitors only fire if signals exceed thresholds for the evaluation window, so the traffic generator had to sustain phases long enough and the scenarios had to be reproducible.
- Dashboards that tell the story fast: The dashboard had to answer "is it healthy?", "is it expensive?", and "is it being abused?" in seconds - without requiring deep clicking.
Accomplishments that we're proud of
- End-to-end telemetry from a real Vertex AI/Gemini workload into Datadog (traces + LLM-native metrics)
- A dashboard that unifies reliability and LLM economics (tokens/cost/tool/security) in one view
- Detection rules that reliably trigger from deterministic scenarios
- Auto-created incidents that include actionable context: what fired, trace search, triage steps, and mitigations
- A traffic generator that makes the system demoable and repeatable for judges
What we learned
- LLM observability requires first-class signals beyond standard APM: tokens, cost, tool fanout, and security indicators.
- The best incident workflow is monitor -> incident -> trace search -> root span attributes (scenario/outcome/cost/tool/security).
- Repeatability is a feature: deterministic traffic is the difference between "it worked once" and a reliable demo and regression test.
What's next for Gemini Cost Guardian
- Add stronger per-request guardrails (tokens/request and tool-calls/request monitors as primary cost controls)
- Improve trace drilldown filters by tagging spans with traffic session/phase for instant "show me the abuse run" views
- Expand security detection beyond "blocked" to include anomaly-based tool fanout and suspicious prompt signatures
Built With
- datadog
- docker
- gcloud
- gemini
- google-cloud-run
- google-cloud-vertex-ai
- next.js
- node.js
- opentelemetry
- opentelemetry-collector
- otlp
- typescript


Log in or sign up for Devpost to join the conversation.