
Inspiration
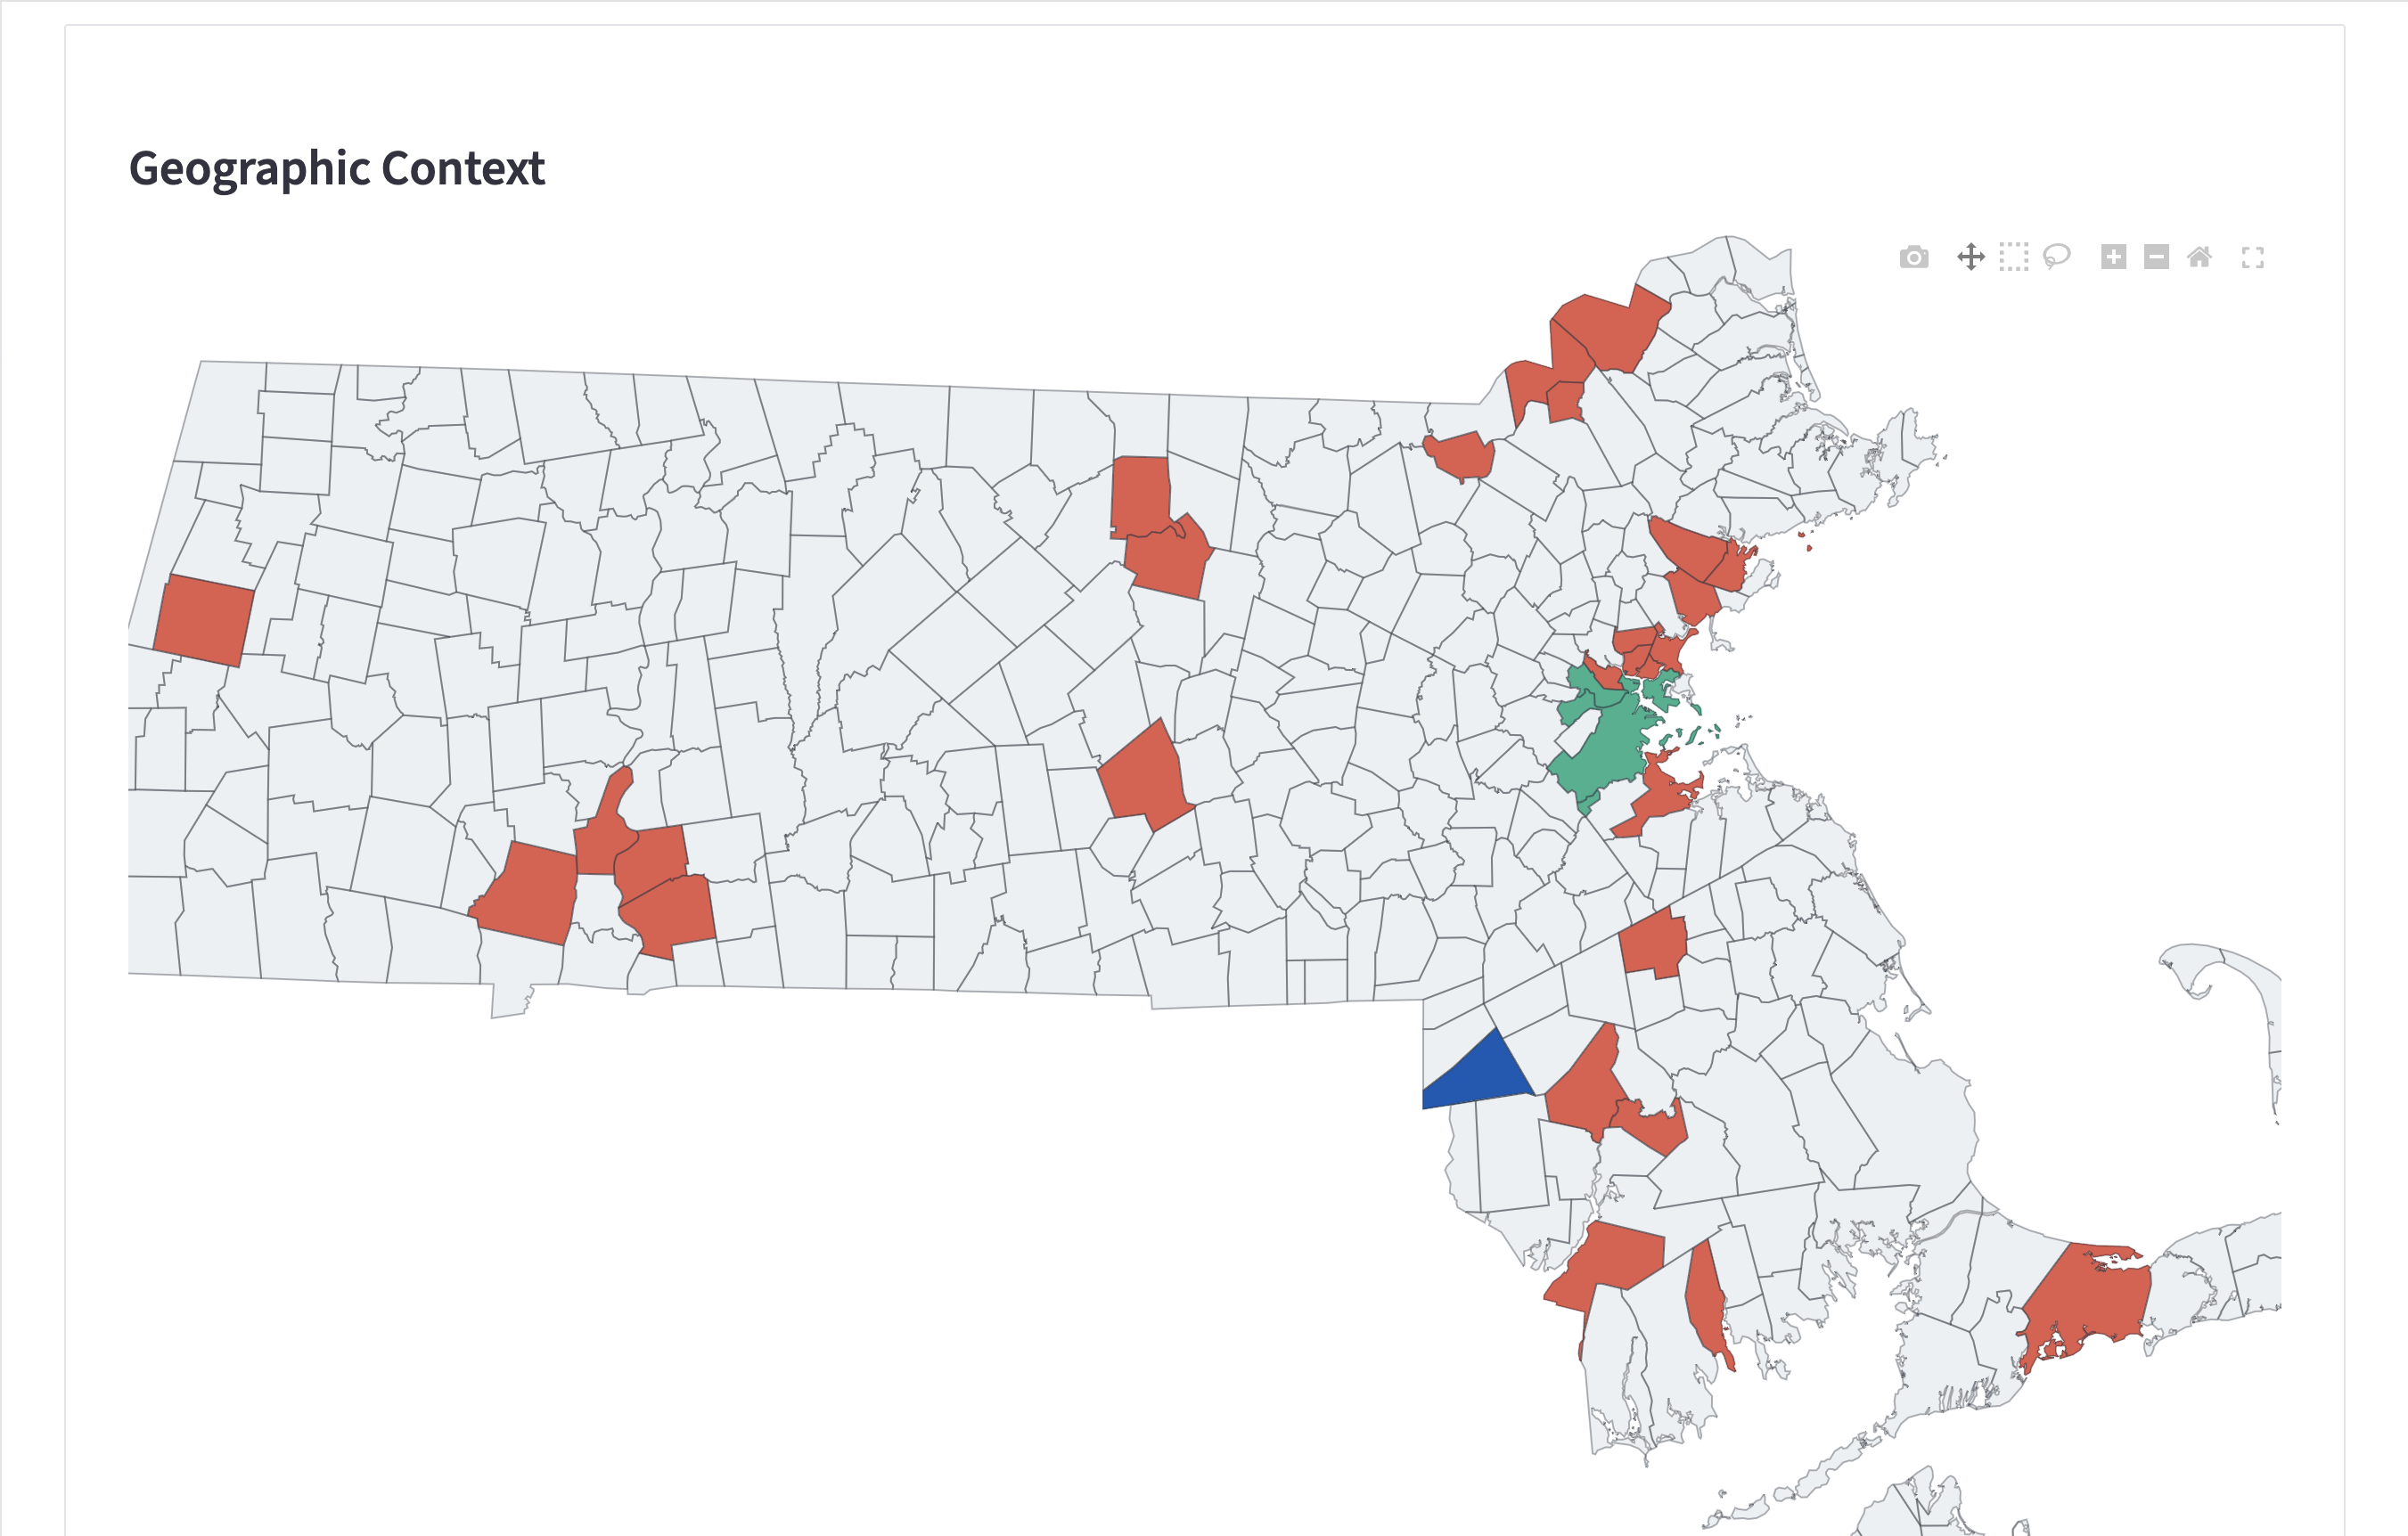
We aspire to leverage our expertise in data to help tell stories that shed light on underrepresented communities and influence public dialogue for the better, which is why we decided to work with GBH to improve journalism on Massachusett's 26 Gateway Cities-- 26 mid-size cities that are below the median in income and educational attainment.
What it does
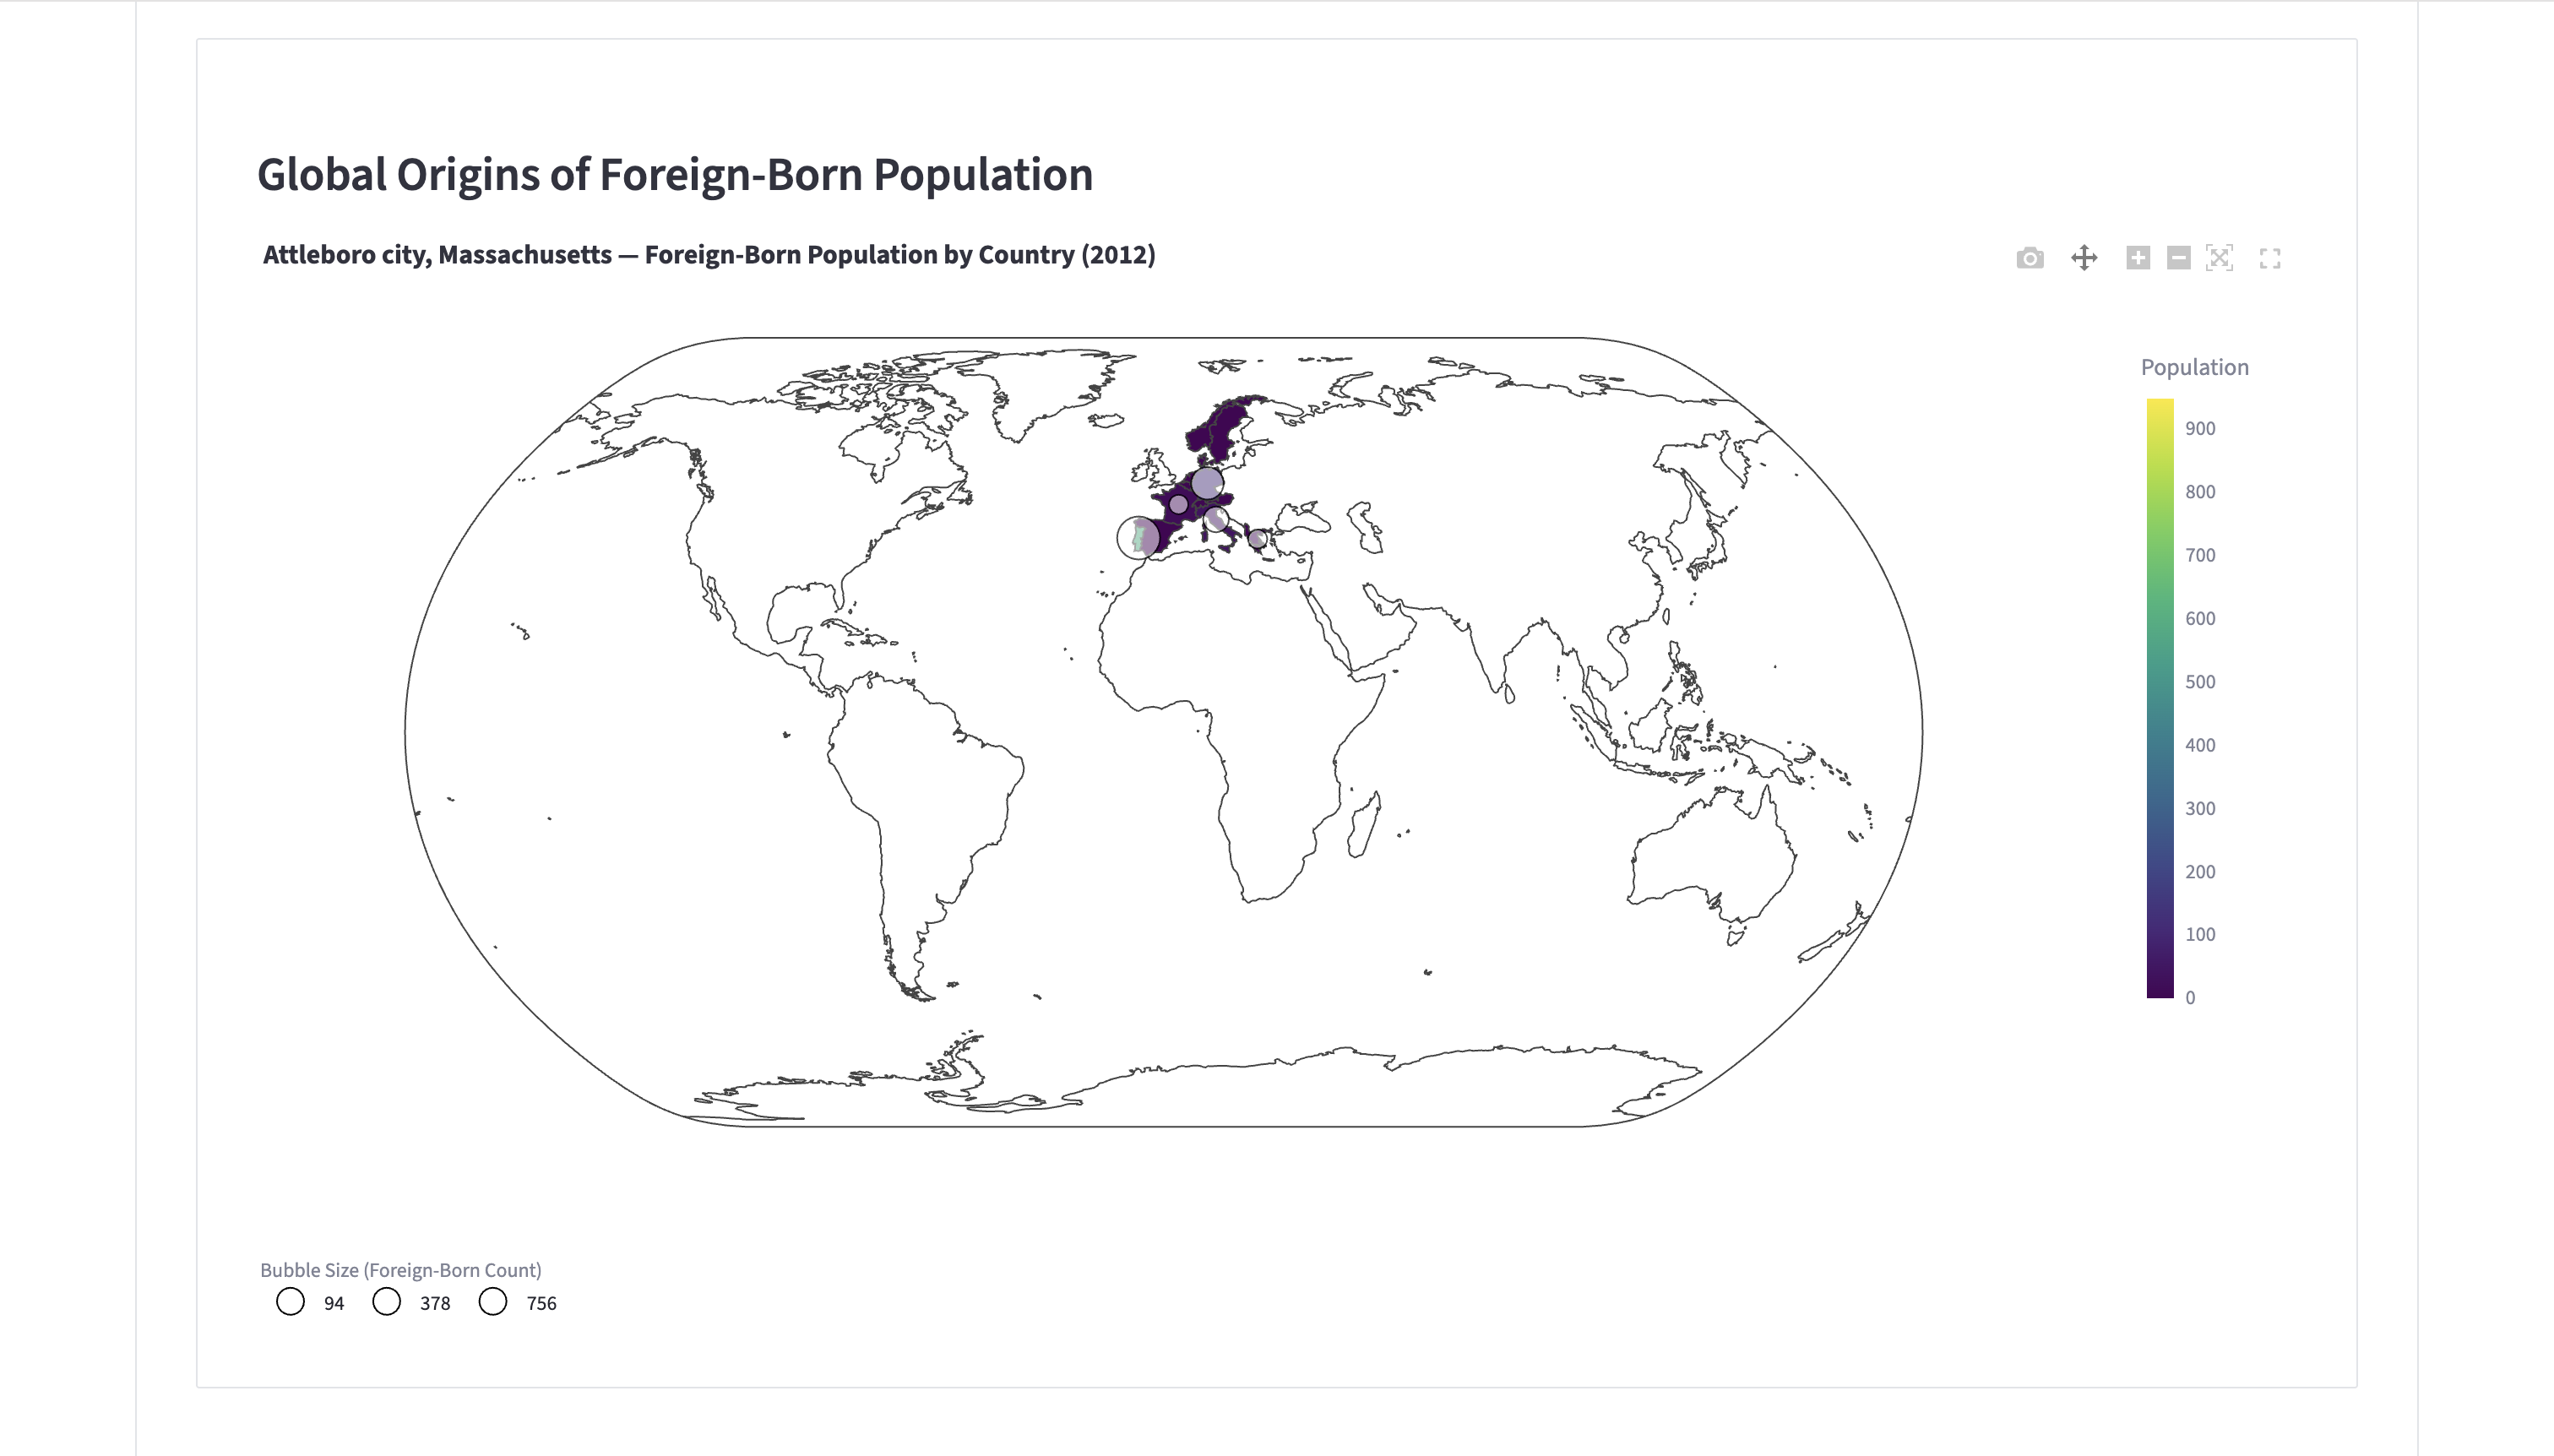
Our website breaks down immigration trends across 26 Gateway Cities in Massachusetts and compares them to Boston and Cambridge as a baseline.
How we built it
We used a Python backend, Streamlit frontend, and Supabase database.
Challenges we ran into
We ran into issues with data processing and data cleaning. Ensuring that all data was in the same format in our database with the same level of granularity across years was difficult. Our team needed to make decisions around how we would approach missing data while ensuring maximum accuracy for journalists.
Deciding on the correct visualizations was also a challenge.
Accomplishments that we're proud of
We are proud of delivering a working MVP website, our globe data visualization, and general deployment.
What we learned
For many of us, this was our first time using tools like Streamlit and Supabase.
What's next for GBH_Crew
We would look to integrate LLMs to include summaries, additional research questions, and generate more insights.
Going forward, we would also want to integrate the Census API for future-proofing and allow acceptances of live changes.


Log in or sign up for Devpost to join the conversation.