-
-
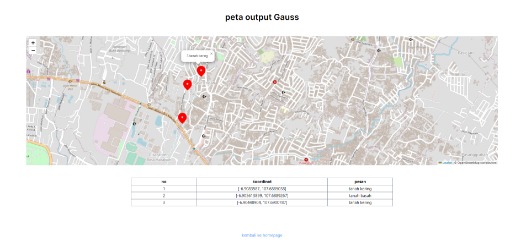
GAUSS interface
-
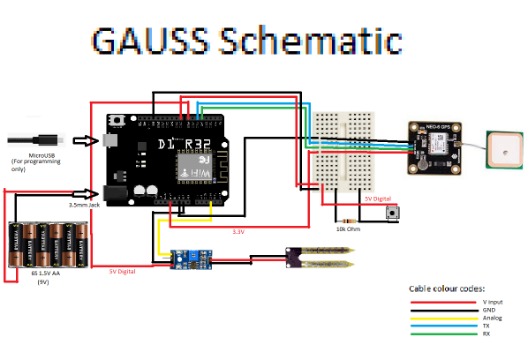
GAUSS schematic


Scroll to the bottom and click on "GUS-xxxx" to access the webapp!
Abstract
Drought is a problem that is often found in several regions in Indonesia. Especially in areas with minimal soil absorption. With climate change and global warming being one of the factors of drought, many sectors are adversely affected. Qualitative methods will be used to compare the changes due to drought in each region. This paper will discuss one of the solutions to drought by implementing a device to detect water content in the soil. With this research, it is hoped that public awareness of drought can increase and pay more attention to the condition of the surrounding environment.
Keywords: drought, climate change, global warming, early prevention.
Introduction
Drought is a condition in which the frequency of rainfall decreases drastically over a long period of time. The frequency of rainfall greatly affects the survival of many organisms in an ecosystem.
Drought can be influenced by several factors such as the dry season, low rainfall and human activities.
Changes in sea surface temperature, as well as changes in atmospheric pressure are also factors that cause drought in some areas. As in the case of the "El Niño Southern Oscillation (ENSO)", rising atmospheric pressure in the Indian Ocean with decreasing atmospheric pressure in the Pacific Ocean.
It can be summarized that drought is the condition of an area being dry, or lacking moisture for a long time and can have adverse effects on humans, animals, or plants.
This drought event can be triggered by several things:
- Sustained dry season
- Low rainfall due to climate change
- Human activities such as deforestation, erosion, overgrazing of agricultural land
Global climate change is expected to continue to worsen as air temperature and CO2 content rise, which also results in distorted rainfall patterns and distribution. (Seleiman et al., 2021)
Literature Review
Drought
There is no definitive definition of what a drought is, but there are several opinions that state their own definitions of drought.
- According to the IPCC Sixth Assessment Report, drought is a condition where the soil is drier than normal, which means less soil moisture than normal.
- According to the National Integrated Drought Information System (NIDIS), drought is the absence of precipitation (rain) over an extended period of time (usually one or more seasons).
- The National Oceanic and Atmospheric Administration (NOAA) defines drought as a condition where a lack of moisture adversely affects people, animals or plants over a large enough area.
If we look at some of the opinions above, we can conclude that drought is a condition of dry land in an area caused by a lack of rainfall, a long drought, or less moist soil in an area that can have a negative impact on humans, animals, plants, and the environment in the area.
By nature, drought can be divided into three types, namely:
- Meteorological Drought
This type of drought occurs when drought lasts for a long time and rainfall is less than average.
- Hydrological Drought
Hydrological drought can occur when water reserves in water sources such as lakes or reservoirs are significantly reduced.
- Agricultural Drought or Ecological Drought
These droughts arise when changes in irrigation rainfall levels and erosion triggered by unplanned agricultural endeavors result in a lack of moisture in the soil for crops.
Drought has far-reaching impacts on several sectors including agriculture, fisheries, energy, transportation, health and the economy. It can cause damage to crops, reduce yields, disrupt food production, increase the risk of water crisis and sanitation shortages. Drought impacts can also lead to decreased energy production from hydropower plants, reduce water availability for transportation systems and lead to worsening economic conditions.
Problem Statement: Is it true that the soil is dry or not?
Hypothesis 1: this soil is not dry because it has normal or more moisture content.
Hypothesis 2: this soil is dry because it has a moisture content below the standard.
Climate Change
Climate change is the pattern of change and intensity of climate elements over a long period of time. The main driver of climate change is global warming. Climate change can also occur due to external factors such as solar radiation or factors from within the Earth itself in the form of increasing carbon dioxide levels in the atmosphere.
Soil moisture
Soil moisture is the water content of the soil in an area (e.g. Hillel, 1998). The moisture content of the soil can be expressed in terms of weight or volume.
Soil moisture also has its own index called the Soil Moisture Index (SMI). SMI is between 0 and 1. If the SMI value is close to 0, the less water content in the soil and the drier the soil condition. Vice versa, if the SMI value is close to 1, then the water content in the soil is more and the condition is more humid.
Links between Drought, Soil Moisture and Climate Change
Climate change is triggered by global warming. Global warming can occur because greenhouse gases such as carbon dioxide, methane, chlorofluorocarbons, and others continue to increase in the air. Deforestation also contributes to global warming because trees absorb less carbon. When global warming occurs, temperatures rise. Soil moisture also decreases as the water content in the soil decreases and drought occurs.
Research Methods
In writing this paper, we used a qualitative research approach. We use qualitative methods because this method raises facts, circumstances, variables, and phenomena that occur when research takes place and presents them as they are. In accordance with the opinion of Lexy J. Moleong (2005: 6), a qualitative approach is research that intends to understand phenomena about what is experienced by research subjects, for example behavior, perceptions, motivations, actions, etc. holistically and by means of descriptions in the form of words and language in a special natural context and by utilizing various scientific methods.
Discussion Results
Climate change can affect soil moisture. To measure soil moisture, we can use the Soil Moisture Index (SMI) as a guide. The value of SMI ranges from 0 to 1, indicating 0 as the driest condition and 1 for the wettest (moist) condition.
The following table shows observations of droughts on a global scale since 1950:
Description:
Unlikely: Few - some evidence available, few people agreeing.
Moderate possibility: Some strong evidence is available, some people agree.
Most likely: Some strong evidence available, many people agree.
| Regional | Changes in the region | Predicted changes at the end of the 21st century |
|---|---|---|
| Asia | Slight-moderate likelihood depending on the region. Minor is likely for most regions due to varying trends. Some regions experience a consistent increase but others show a decrease in drought as indicated by different measures (soil moisture anomalies, Palmer Drought Severity Index, consecutive dry days). In East Asia, there is a moderate likelihood on the overall trend for an increase in drought. | This is likely due to inconsistent changes in consecutive dry days and soil moisture anomalies between models in most domains. |
Australia & New Zealand |
It is likely that for some areas with reduced drought, others with increased drought. | Small-medium probability depending on the region. Models agree on increasing consecutive dry days in South Australia, but signal is inconsistent across most of South Australia in soil moisture anomalies. Inconsistent signal in consecutive dry days and soil moisture anomalies in Northern Australia. Strongest consecutive increase in dry days in western Australia. Inconsistent changes in drought extent depending on the index used. |
| Africa | An overall increase in drought is likely, based on soil moisture anomalies and the Palmer Drought Severity Index. For the Sahel, recent years are characterized by greater interannual variability than the previous 40 years. | Small-medium probability, depending on the region. Low confidence in most areas, medium confidence in increased drought (consecutive dry days and soil moisture anomalies) in southern Africa except eastern parts. |
| Europe | There is a possibility of increased drought based on some indices in the southern part of the continent, but large inconsistencies between indices in this region, and inconsistent or statistically insignificant trends in the rest of the continent. | Moderate is likely: European regions are affected by stronger droughts (reduced soil moisture anomalies and consecutive dry days) with the largest and most consistent changes in Mediterranean Europe. |
| North America | It is likely that overall there is a slight trend towards less drought, although analysis for some sub-regions also shows a trend towards increased drought. Recent regional trends towards more severe drought conditions were identified in southern and western Canada, Alaska and Mexico, with subregional exceptions. | Small-medium probability depending on the region. Medium confidence regarding increasing consecutive dry days and soil moisture anomalies in Texas and New Mexico; low confidence in other areas due to inconsistent changes. |
| South America | It is unlikely due to spatially varying trends and inconsistencies between studies. For the Amazon, recurrent severe droughts have occurred in recent decades but no specific trends have been reported. | Small-moderate probability, depending on the region: signals are inconsistent except for increased dryness (consecutive dry days and soil moisture anomalies) in northeastern Brazil. |
Table 1: Regional drought observations. (Stanke et al., 2013)
Demonstration

Figure 1: GAUSS experiment results
| no | coordinates | Order |
|---|---|---|
| 1 | [-6.9083587, 107.6885038] | dry soil |
| 2 | [-6.905613899, 107.6889267] | wet soil |
| 3 | [-6.90448904, 107.6900787] | dry soil |
Table 2: GAUSS Experiment Results Table
It can be seen that the Geodata Acquisition and Uti;izing Semi-System (GAUSS) can work well. It is characterized by the coordinate data and water content data that enter the website,
Solution Implementation
- General Solution
To prevent drought, there are several things we can do:
- Reforestation
By reforesting, we can preserve the environment by planting trees. Oxygen also increases due to the photosynthesis process that comes from the trees we plant. The environment planted with trees is also more humid.
- Restrictions on water use.
If we limit our daily water use, then we can use water effectively. That way, when we are faced with a dry season, we can still use water.
- Make land conservation
Soil conservation can help control erosion and returning organic matter to the soil can improve the soil's ability to absorb water and prevent soil drying.
- GAUSS mechanism
To implement and achieve one of the above solutions, we created a tool called Geodata Acquisition and Utilizing Semi-System (GAUSS). This tool serves to detect the moisture content of the soil at a point. This tool works by generating two values, namely, location value and soil dryness level. The location value contains a coordinate where the tool is plugged in. When this tool is plugged in, it will conduct an electric current to the ground and the value of the soil dryness level is obtained based on the amount of current that returns to this tool.
After obtaining the data, the data is sent to a website that contains a map and the map will show the data that has been sent earlier in the form of areas that have known soil drought levels.

Figure 2: GAUSS Schematic
- Tools and Materials
The tools and materials used for the manufacture of the Geodata Acquisition and Utilizing Semi-System (GAUSS) are as follows:
| No. | Tools and Materials | Description |
|---|---|---|
| 1. | Solder | For soldering tin/zinc |
| 2. | Cardboard | For the electronic framework |
| 3. | Plastic Container | Protector/Casing |
| 4. | Adhesive | Adhesive electronic components with cardboard |
| 5. | Scissors | For cutting |
| 6. | Lead wire | As a connector of electronic components |
| 7. | Wemos D1 R32 | To process data |
| 8. | Sensor | To detect soil moisture content |
| 9. | GPS Module | To determine the position |
| 10. | Jumper Cable | To connect electricity with electronics |
| 11. | Battery | For power source |
- How to make
First, we make a sketch drawing for electronics. After that, make a sketch for the website display. If so, the electronic components are assembled and arranged according to the sketch and programmed. Once you have programmed the electronics, the next thing to do is to program and connect the website and electronics. Don't forget to fix bugs and test.
Conclusion
What we get from this is that by using GAUSS, we can avoid things we want such as the death of plants due to dry soil, and so on. With GAUSS, we can provide sufficient water content to the soil according to the data obtained by GAUSS.
Future Plans
For the future, we will improve both software and hardware. We will also implement AI in the way it works. In addition, we will try to develop this tool not only to detect drought at a point, but in an area so that it can be more useful in everyday life. We are also working on GAUSS in the future to not only detect things like water content, but other important things like pH can also be detected.
Bibliography
Douville, H., K. Raghavan, J. Renwick, R.P. Allan, P.A. Arias, M. Barlow, R. Cerezo-Mota, A. Cherchi, T.Y. Gan, J. Gergis, D. Jiang, A. Khan, W. Pokam Mba, D. Rosenfeld, J. Tierney, and O. Zolina, 2021: Water Cycle Changes Archived, accessed April 10, 2023, at the Wayback Machine.
Jia, G.; Shevliakova, E.; Artaxo, P. E.; De Noblet-Ducoudré, N.; et al. (2019). "Chapter 2: Land-Climate Interactions" (PDF). IPCC SRCCL 2019. pp. 133
Lexy, J.M., 2002. Qualitative research methodology. Bandung: Teenage Workshop.
National Drought Mitigation Center. "Types of Drought". Accessed from drought.unl.edu. Accessed on April 10, 2023
NOAA | National Centers for Environmental Information (NCEI). "Definition of Drought".Accessed from www.ncei.noaa.gov. Accessed April 13, 2023.
NOAA National Integrated Drought Information System. "Drought Basics". Accessed from Drought.gov. Accessed on April 13, 2023
Stanke, C., Kerac, M., Prudhomme, C., Medlock, J., & Murray, V. (2013). Health effects of drought: a systematic review of the evidence. PLoS currents, 5, ecurrents.dis.7a2cee9e980f91ad7697b570bcc4b004. https://doi.org/10.1371/currents.dis.7a2cee9e980f91ad7697b570bcc4b004
Surtani, S. (2015). Greenhouse Effect in Global Perspective (Global Warming Due to Greenhouse Effect). Journal of Geography, 4(1), 49-55.

Log in or sign up for Devpost to join the conversation.