-
-

Z-score Normalization Formula
-

Energy sector and number of stocks for each category
-

Pearson correlation energy sector stocks’ values vs gas emissions
-

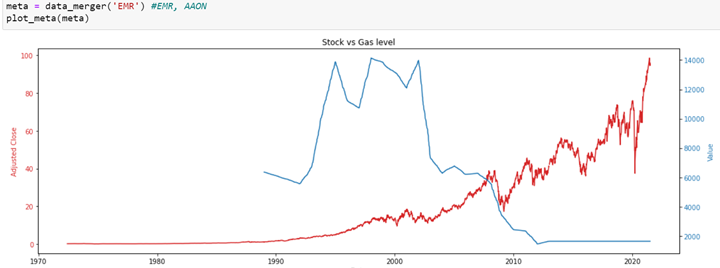
Stock vs Gas level (EMR - HCFC)
-

N2O, CO2, and CH4 levels from 2001 - 2021 in the United States
-

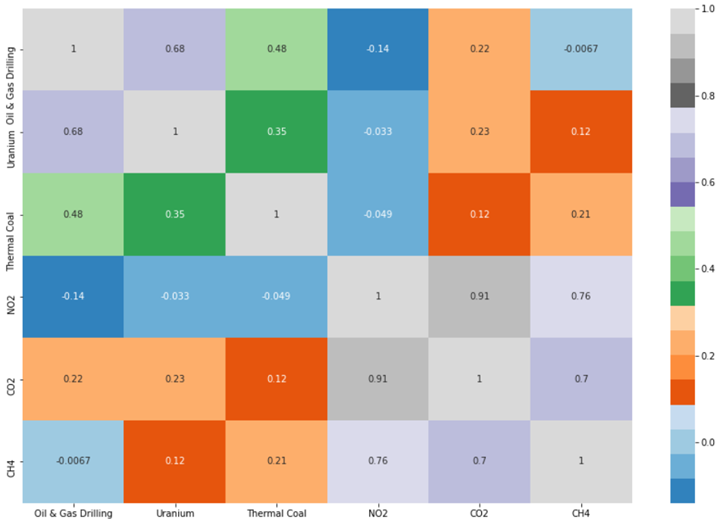
Correlation matrix of energy sector stocks’ values vs gas emissions
-

Uranium normalized stock value with 30 rolling averages
-

URANIUM Stock Prediction for Energy Sector
-

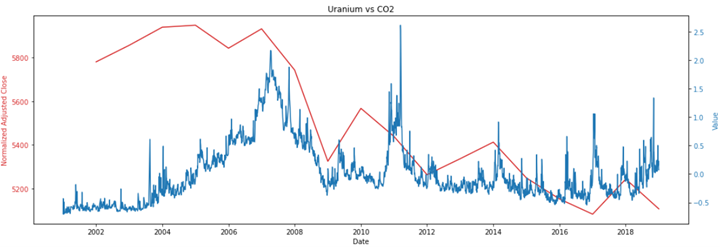
Uranium vs CO2
-

Thermal Coal normalized stock value with 30 rolling averages
-

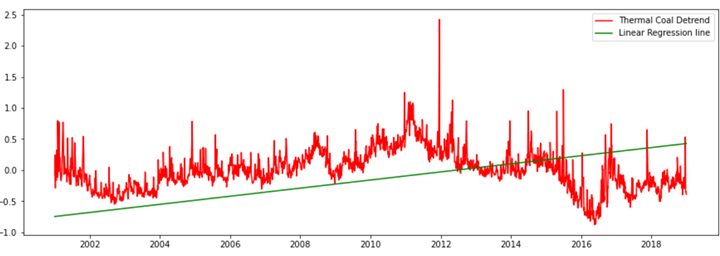
Detrend example of Thermal Coal
-

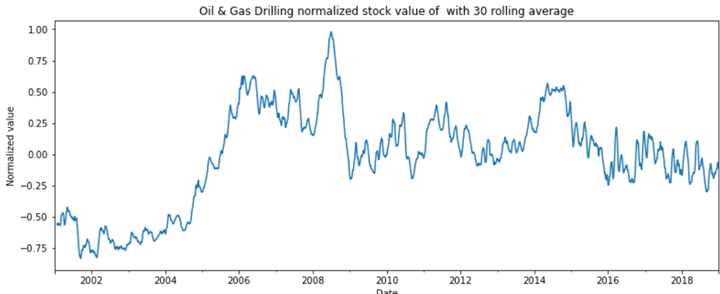
Oil and Gas Drilling normalized stock value with 30 rolling averages
-

Normalization levels of the three stocks
-

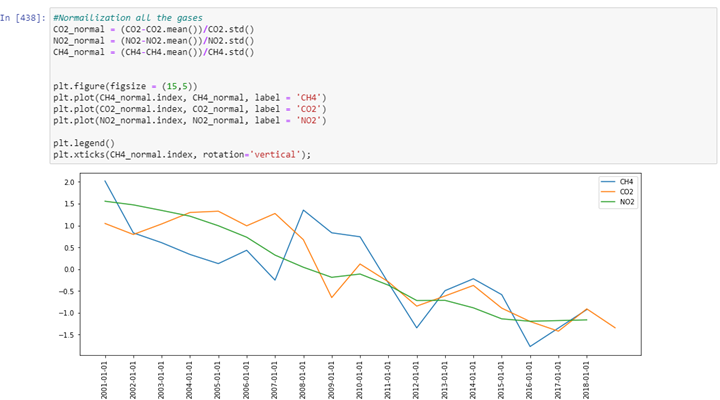
Normalization levels of all the gases


Inspiration
We want to see if there's any connection between the environmental effect
How we built it
In this challenge, we are provided with 2 data sources: Knoema’s Data Atlas and Zepl’s US Stock Market for Data Science. Our mission is to find the connection between these two data sources, seeing if there’s a visible impact among environmental factors and stock prices. The challenge required us to work with Snowflake database to derive meaningful insights. We used Python connector library at first to connect our IDE with the database. After that, we downloaded all the necessary files and started analyzing to find the pattern.
Background
We first explored the data with basic and find the unique attributes of the columns from all the datasets. We found out that there’s no linking attribute between stock and environmental factors. Therefore, we decided to check the correlation between gas emissions (primarily N2O, CH4 and CO2) and stocks in the US. To do that, we normalized environmental data and stock data with “Z-score normalization” technique, based on mean and standard deviation values of the data.
After that, we created a function to merge environmental and stock datasets together and plot them in a graph to check their correlation. We formed our hypothesis for the datasets: “There’s a correlation between Energy sector and the gas emissions level in the United States.”
To prove our hypothesis, we explored some factors:
Energy sector and number of stocks for each category
N2O, CO2, and CH4 level from 2001 - 2021 in the United States
Stocks by industry in energy sector Some interesting facts: Uranium Bubble in 2007 Peak in Methane consumption 2009 Global coal benchmarks fall below 2009 crisis levels
Correlation between energy sector stocks’ values vs gas emissions Since there are missing data in the Date and Year attribute from gas emission values, we interpolate the data and used linear regression to detrend and Pearson’s correlation table to get the final score. Finally, we created a matrix to fully recognize the correlation between values.
Visualize to find the industry and gas emission that has the highest correlation
Built machine learning model to forecast the stock market for Uranium
Challenges we ran into
The data resolution for gas emission is yearly while stock is daily. Therefore, many interpolation and data cleaning were implemented
It is hard to choose the right group of stock to study from since stock market is influenced by many factors rather by solely environmental impact.
Grouping stocks within industry require normalization and a lot of trial and errors on data aggregation.
Accomplishments that we're proud of
- We were able to download the data from SnowFlakes and figured the focus group to study.
- We figured out the correlation and also had time to implement a machine learning model.
- We are also find enjoyment in collaboration with teammates
What we learned
The gas emission level has changed dramatically throughout the past decades due to government regulation and social awareness.
There is a slight correlation between CO2 stock and Uranium.
What's next for Gas Emission Level and Stock Market in Energy Sector
- We plan to find more data and better hypothesis to study the correlation.


Log in or sign up for Devpost to join the conversation.