Inspiration
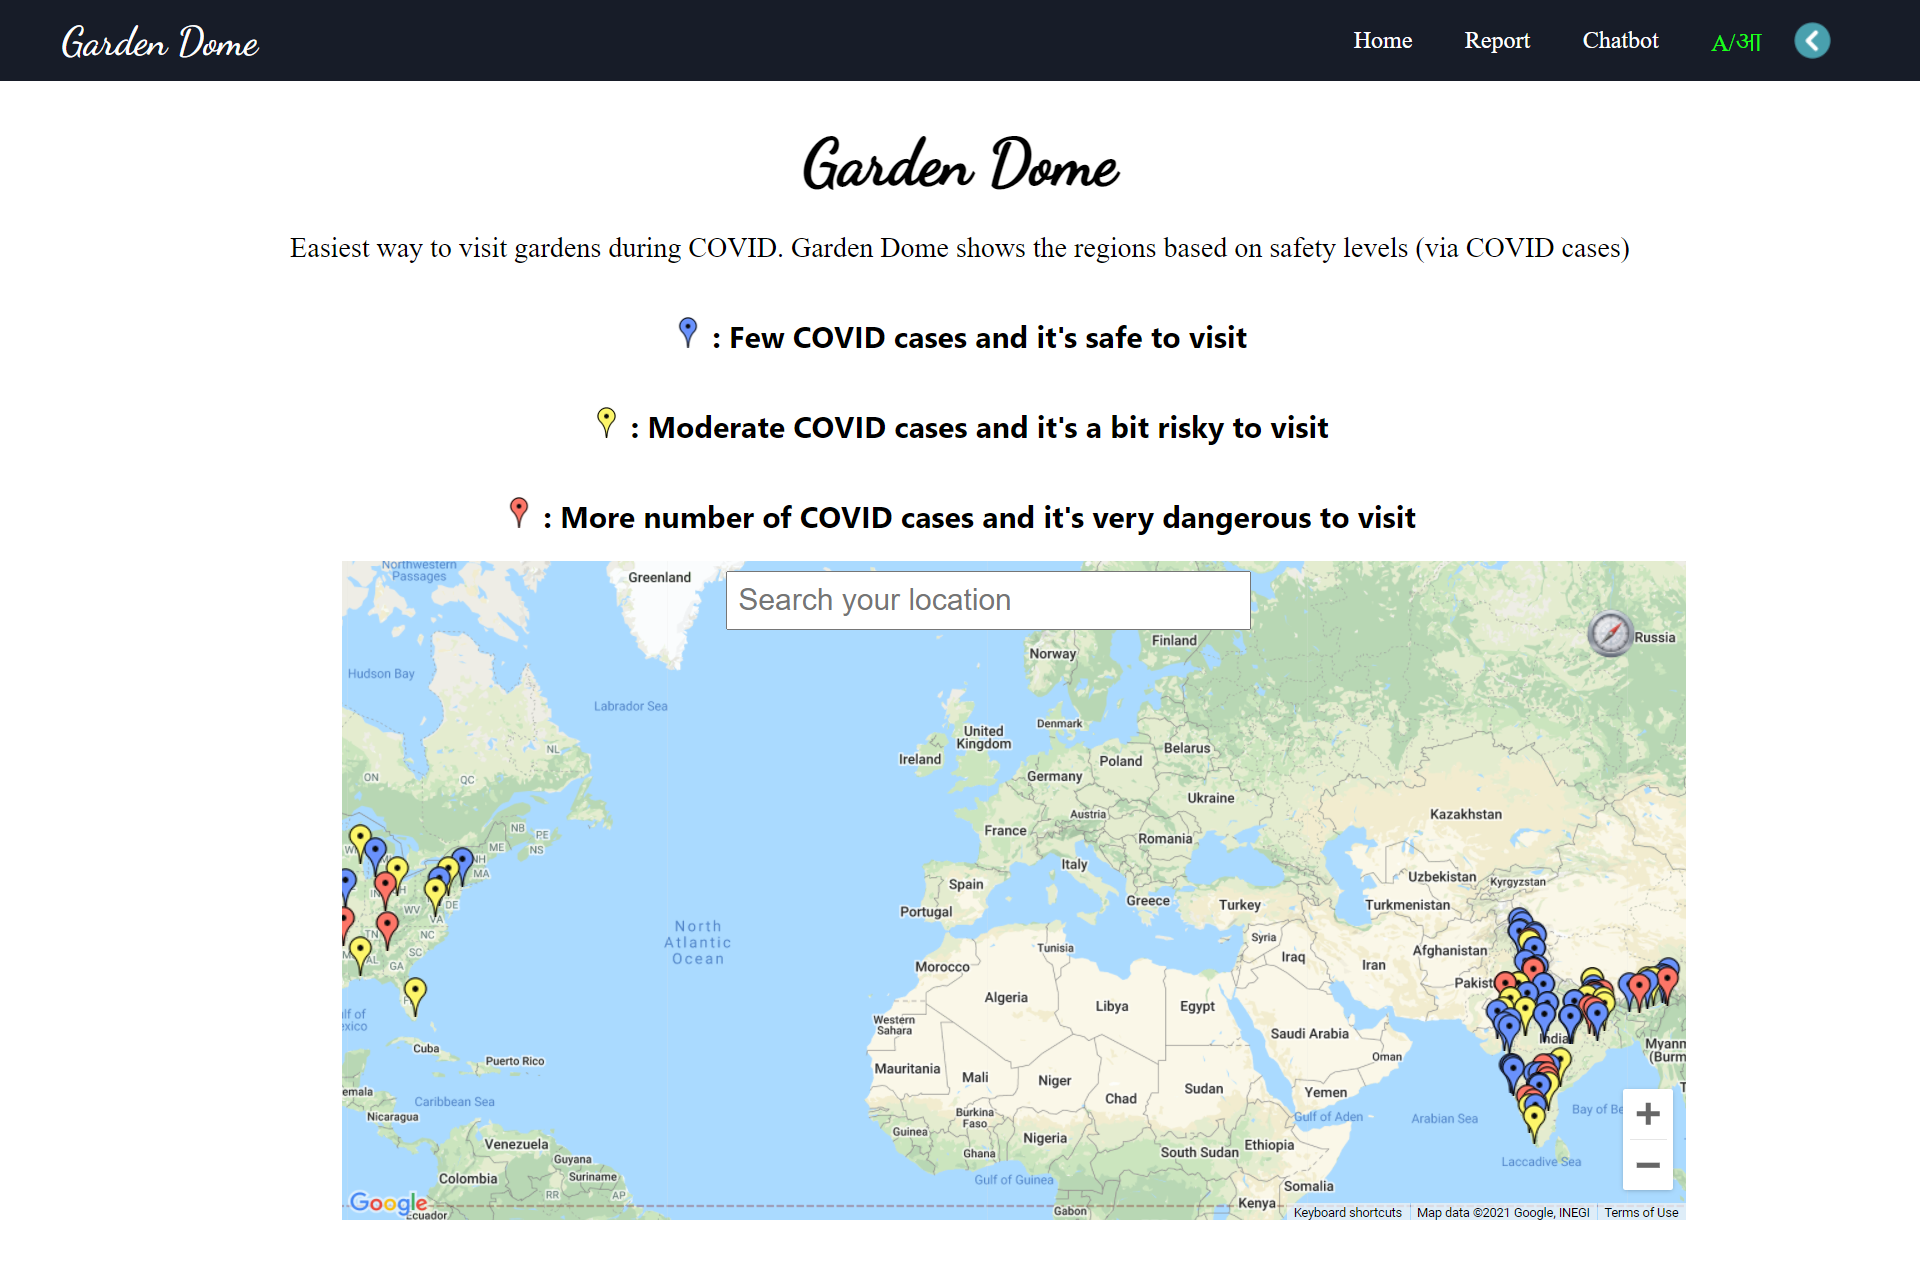
We all love to go to garden, but due to COVID, it's risky to step out without precautions. Therefor representing Garden Dome Easiest way to visit gardens during COVID. Garden Dome shows the regions based on safety levels (via COVID cases)
What it does
Garden Dome shows the regions based on safety levels (via COVID cases). The different Markers represents:
- Blue: Represents the number of fewer cases and its safe to visit
- Yellow: This represents the number of moderate cases and it's a bit risky to visit
- Red: Represents the number of many cases and it's very dangerous to visit
How we built it
- Google Map API
- Google Cloud
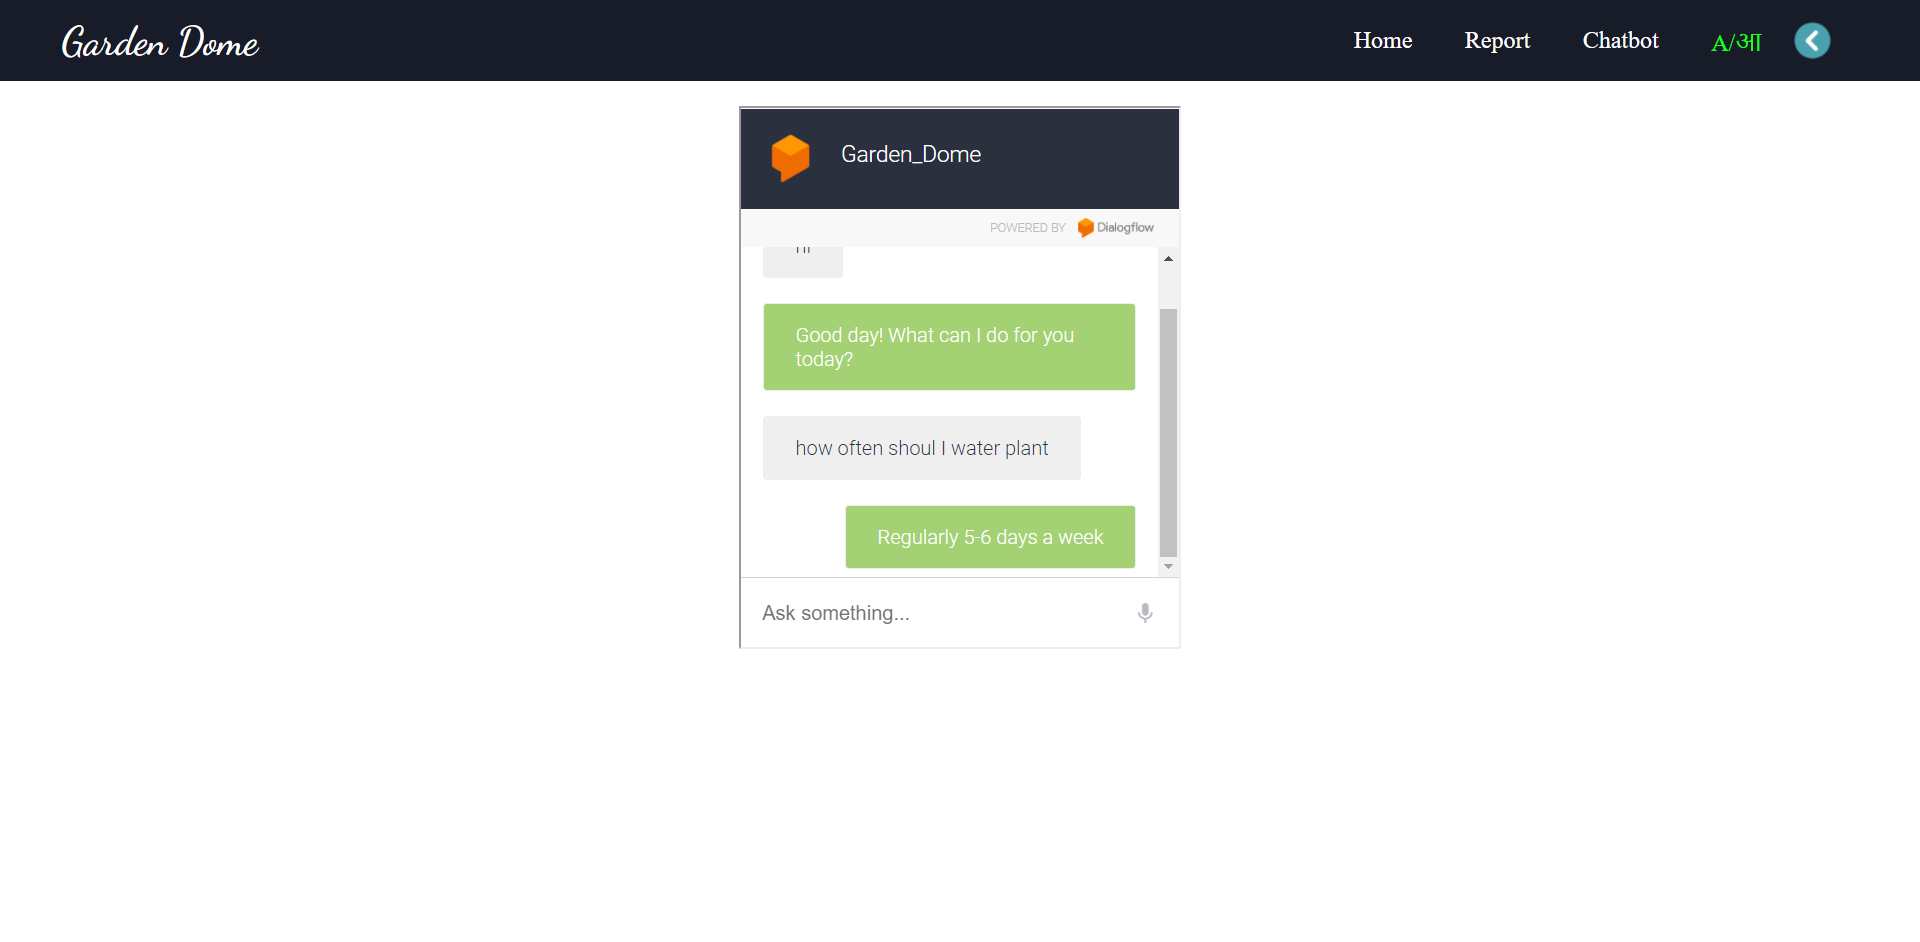
- Dialogflow
- React Js
- Redux
Challenges we ran into
As no API was available for getting the data for number of COVID cases in particular region of garden, we have to search and enter the input manually.
Accomplishments that we're proud of
Completing the project.
What we learned
Learning google cloud, autocomplete places, google map and integration with the application, and completing the project in the given time frame.
What's next for Garden Dome
Web deployment
Built With
- dialogflow
- google-cloud
- google-maps
- react
- redux


Log in or sign up for Devpost to join the conversation.