-
-
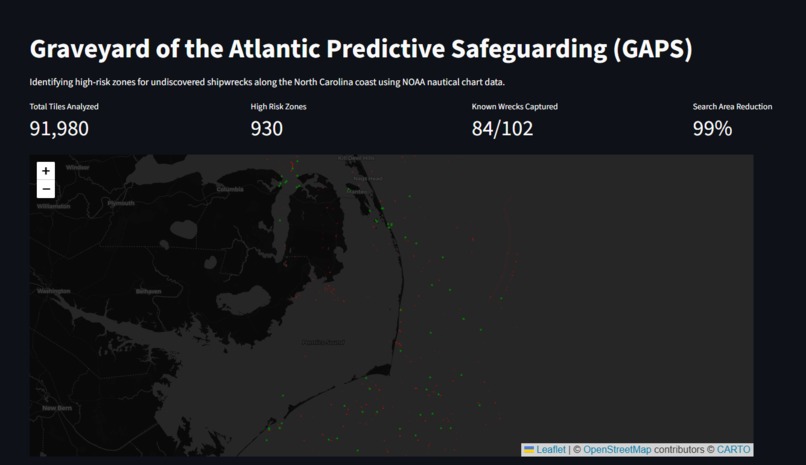
Home Page
-
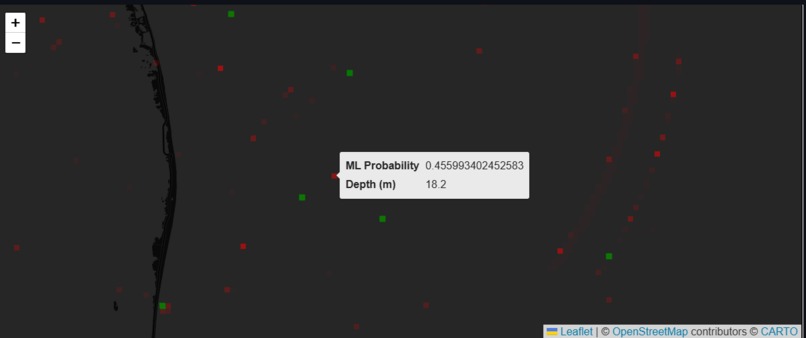
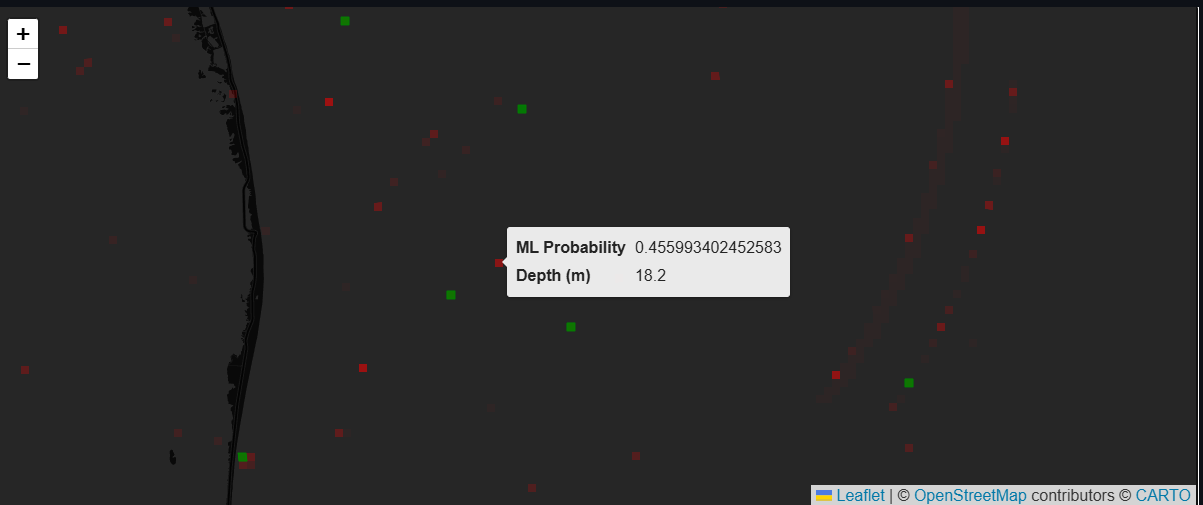
Wreck Sites Close-up
-
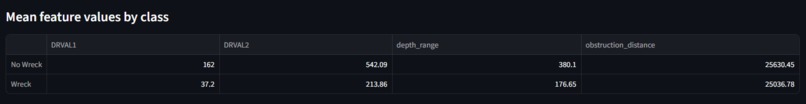
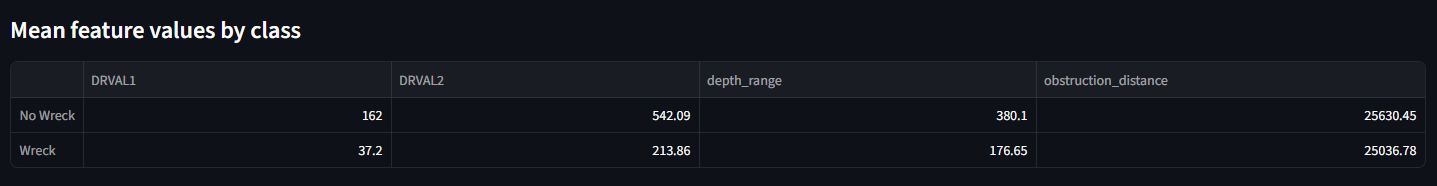
Feature Values Table
-
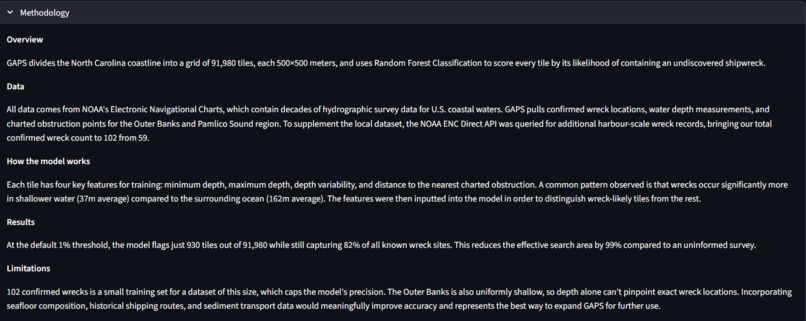
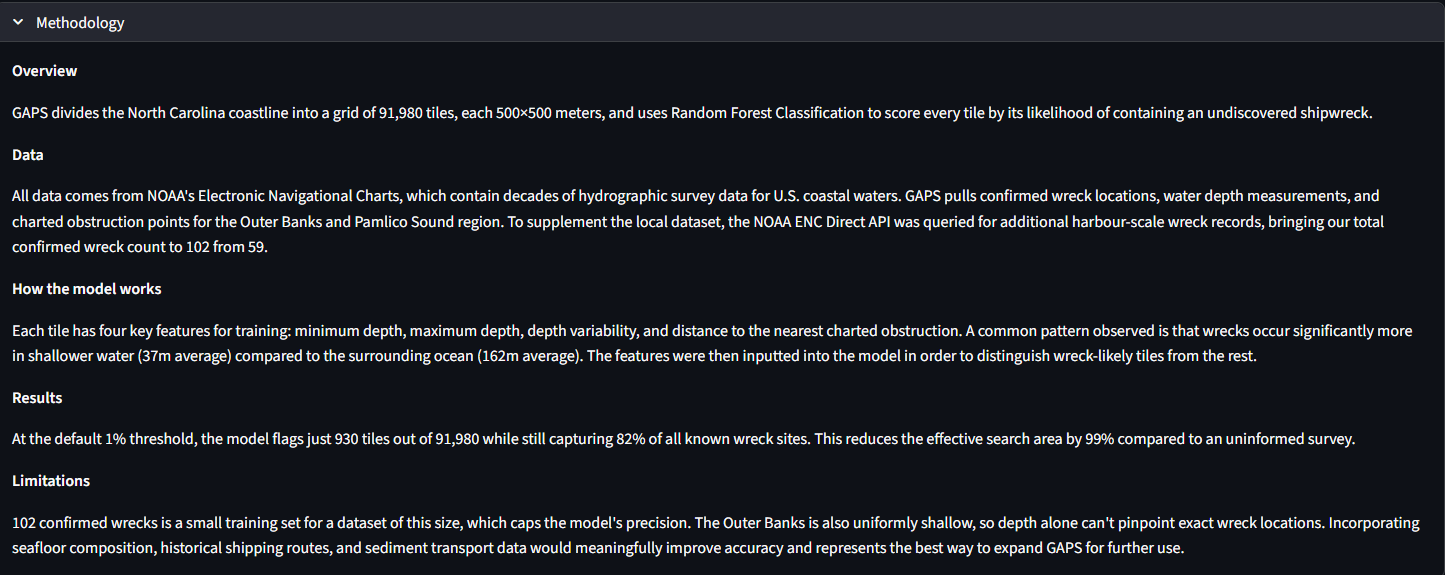
Methodology
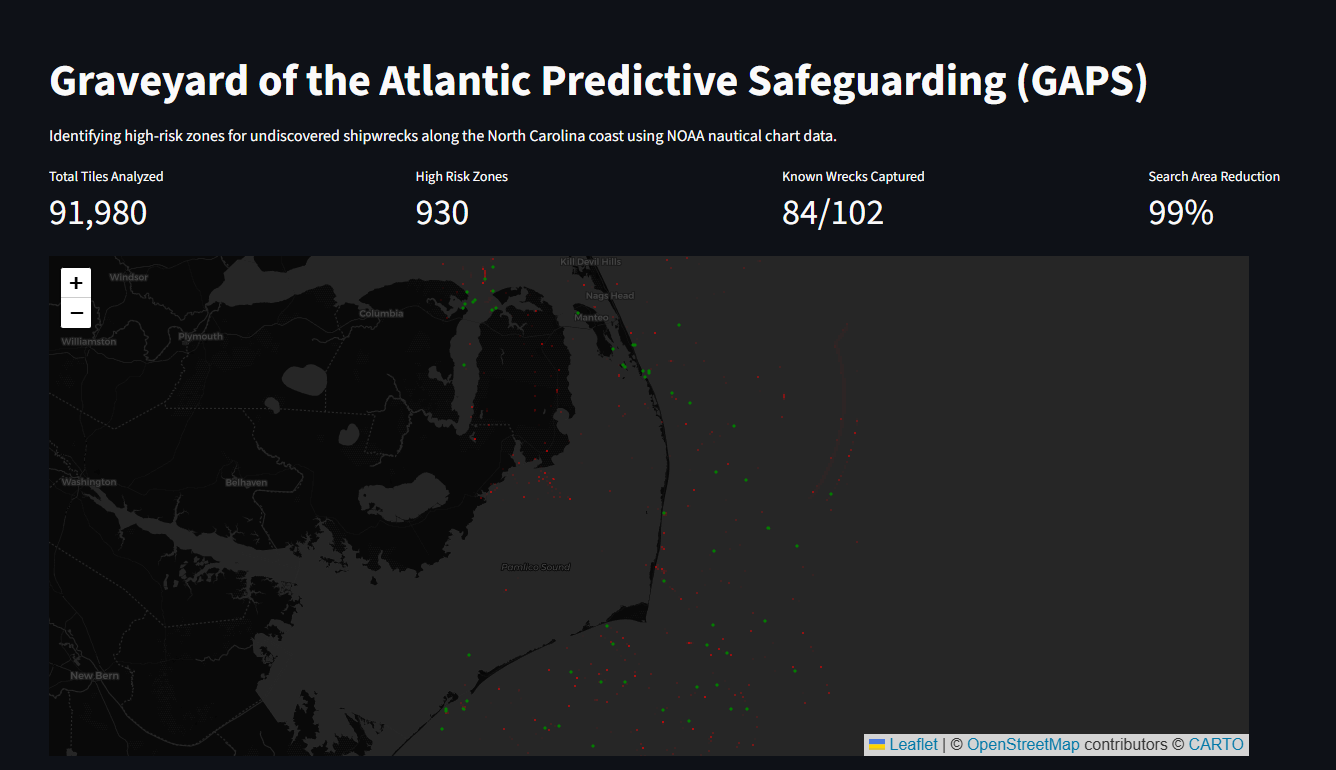
Graveyard of the Atlantic Predictive Safeguarding (GAPS)
Inspiration
The Outer Banks of North Carolina are famously known as the "Graveyard of the Atlantic." While thousands of ships have been lost to these shoals over the centuries, only a fraction are officially charted. Simultaneously, offshore sand dredging for beach nourishment is a massive, ongoing industry. Dredgers often operate blind in historically rich waters, especially in a region with frequent shifting sands like the Outer Banks. Given the environmental signatures of known shipwrecks, GAPS aims to predict where unmapped "Ghost Ships" are hiding before they are destroyed.
What It Does
GAPS is an AI-driven conflict detection tool. It divides the North Carolina coastal zone into exactly 91,980 individual 500×500 meter tiles. Using a Random Forest classifier, it evaluates the physical environment of each tile and outputs a probability score for the presence of an undiscovered shipwreck.
Instead of searching the entire ocean, GAPS allows marine archaeologists and dredging companies to pinpoint high-risk zones. At its strictest threshold (the top 1%), the model successfully captures 82% of known wrecks while reducing the required search area by 99%. Users can explore these predictions dynamically through an interactive Streamlit web dashboard.
How It Was Built
The project was built in four distinct phases:
1. Geospatial Data Engineering Using Python, GeoPandas, and Shapely, generated a precise spatial grid. Pulled raw data from NOAA Electronic Navigational Charts (GDB) and dynamically supplemented it with the NOAA ENC Direct API to increase the data pool.
2. Feature Extraction Spatial math was handled in meters instead of degrees via Coordinate Reference System (CRS) transformations (switching between EPSG:4326 and EPSG:32618). Engineered features for each tile including Minimum Depth (DRVAL1), Maximum Depth (DRVAL2), Depth Range, and Distance to Nearest Charted Obstruction.
3. Machine Learning
Trained a RandomForestClassifier from scikit-learn using 300 estimators and balanced class weights.
4. Frontend / UI Wrapped the entire pipeline's output into a Streamlit application, using Folium to render GeoDataFrames interactively on a map. Used a three-tier color system distinguishing confirmed wrecks, high-risk zones, and high-risk zones overlapping active dredging areas.
Challenges
- Extreme Class Imbalance: Only 102 confirmed wreck tiles out of 91,980 total — a ~1:900 ratio. SMOTE (Synthetic Minority Oversampling Technique) failed due to overly sparse clusters, requiring a switch to specialized metrics (ROC-AUC) and class weighting.
- Coordinate Math Issues: Distance calculations failed in standard longitude/latitude, requiring projection into planar UTM coordinate systems and conversion back for rendering.
- Data Scarcity & Join Complexities: Spatial joins (
sjoin) caused overlapping polygons to duplicate grid rows, resolved through strictgroupbyaggregation.
Accomplishments
- Built a complete pipeline from raw, unformatted NOAA geodatabases to a clean Pandas dataframe.
- Achieved a highly actionable model — filtering out 99% of the ocean while maintaining an 82% capture rate for historical sites.
- Deployed a complete interactive frontend accessible to non-technical users.
What I Learned
- Working with geospatial formats: GeoDataFrames, GeoPackages, and ESRI geodatabases (
.gdb) - Querying live geospatial REST APIs (NOAA ENC Direct ArcGIS MapServer) and parsing GeoJSON responses
- Building and evaluating a Random Forest classifier with scikit-learn (ROC-AUC, classification reports, class weighting)
- Building an interactive geospatial dashboard with Streamlit and Folium
What's Next
- Resolving data-join issues with the
Coastal_Seabed_Arealayer to incorporate substrate type (rock vs. mud vs. sand), which directly affects wreck preservation - Incorporating sediment transport zones where wrecks are periodically exposed and reburied by ocean currents
- Adding more positive shipwreck data from additional sources to improve reliability
- Integrating historical maritime shipping lane data to correlate vessel traffic density with wreck probability
Built With
- folium
- geopandas
- numpy
- pandas
- python
- random-forest
- scikit-learn
- streamlit


Log in or sign up for Devpost to join the conversation.