-
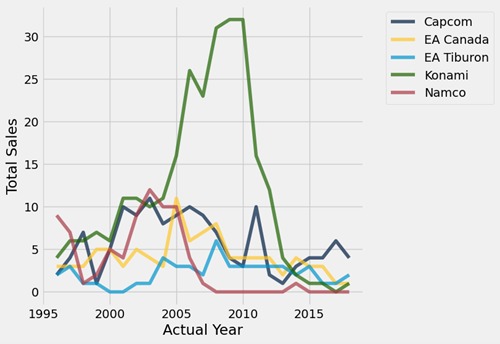
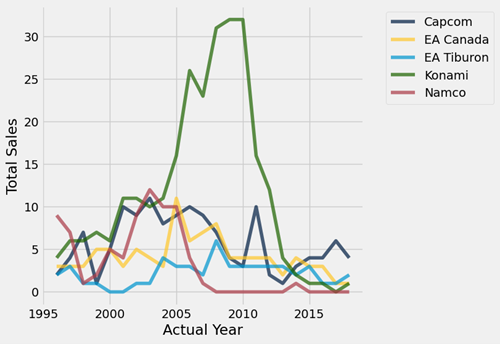
Shows historical game sales in the millions.
-
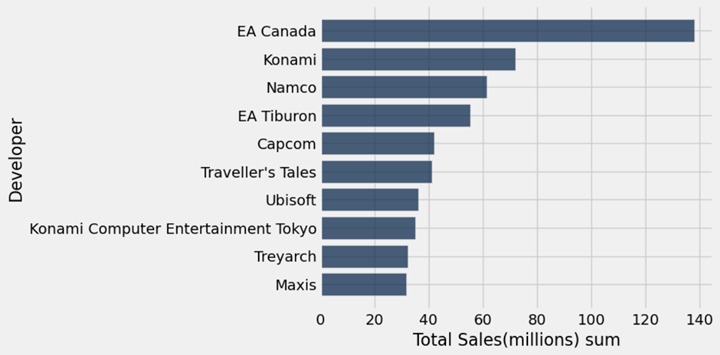
Top 10 Developers with the most sales in the millions.

Inspiration
Video game sales over time.
What it does
Using the provided Business_Dataset.xlsx file we used Jupyter Lab to analyze the data and create conclusions to help find the best developers to invest in.
How we built it
Built using Jupyter Lab(NumPy) for the graphs and charts, Microsoft Excel to edit the dataset, Microsoft Word to share information, Google Slides to create the presentation, and Slidesgo for the Google Slides template.
Challenges we ran into
We were unsure of how to create a line graph with multiple lines showing historical sales. Initially had difficulty wrangling the data and removing duplicates.
Accomplishments that we're proud of
Being able to produce graphs with meaningful data. Creating a clean data file that could easily be used for creating charts.
What we learned
How to better implement Jupyter Lab with real-world datasets in Excel. How to create clean data from large datasets that can easily be used for analysis.
What's next for Game Sales for Publishers
Presenting the data to a panel of judges. Coming back next year and creating a new presentation.

Log in or sign up for Devpost to join the conversation.