-
-
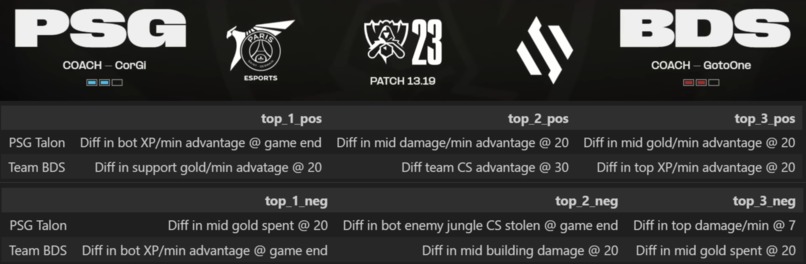
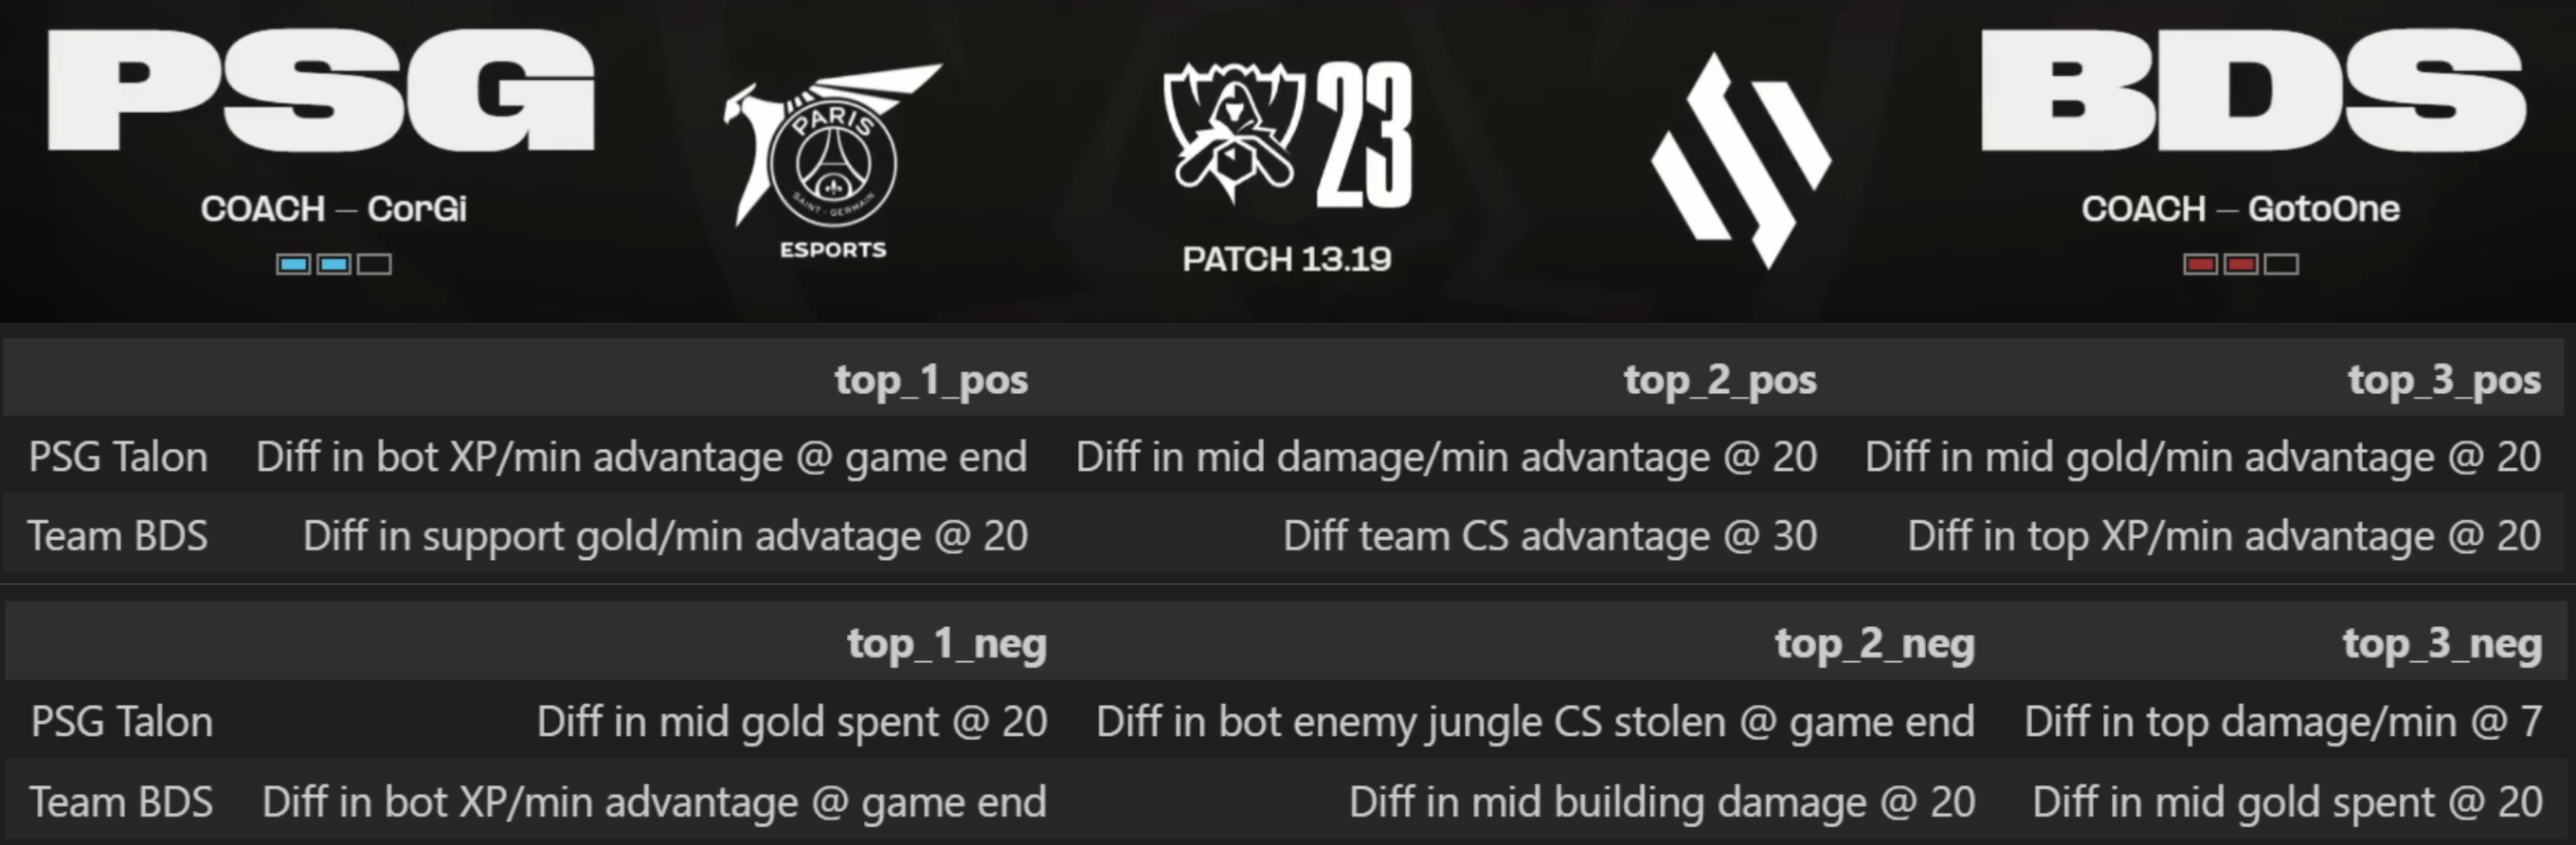
Demo of the team strength/weakness breakdown we obtain from applying Shapley Values on our CatBoost model
-

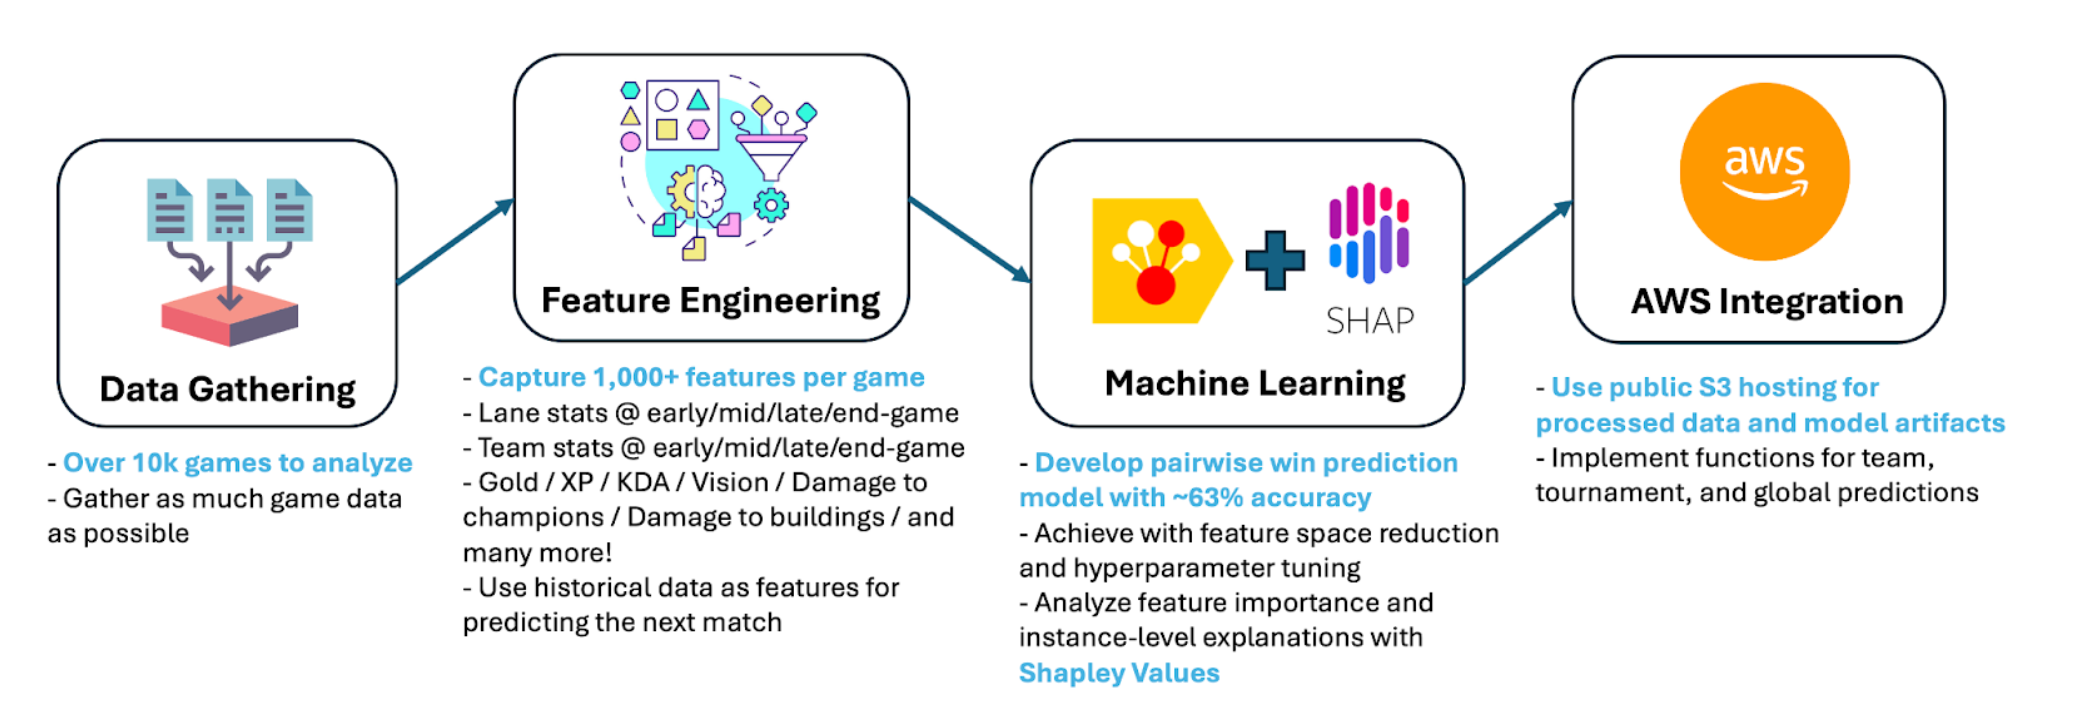
Development process
-

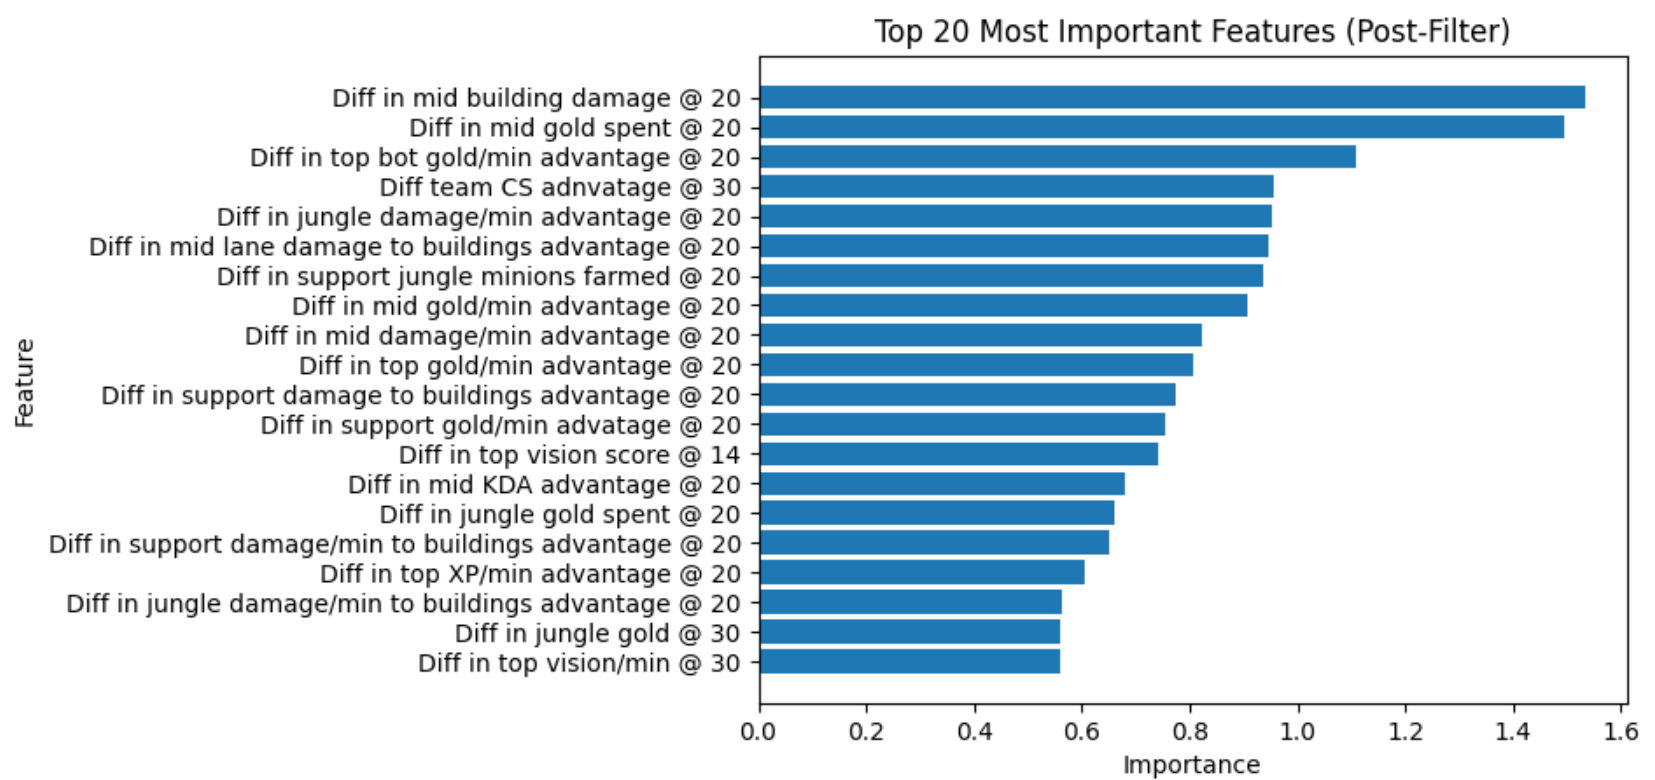
Global feature importance values from our model after filtering out general win history and win margin statistics
Inspiration
We often talk about teams in terms of their characteristics and styles, by where they funnel resources, where they dig up early advantages, and how certain laners stand out in their leagues. But beyond the astute observers and analysts that identify these patterns, what can the data tell us about each team's unique playstyles and which aspects can be considered strengths versus weaknesses? This project aims to utilize data and machine learning to systematically identify these underlying patterns and styles. We analyze over 10k games and over 1k features per game for predictive modeling and interpretation of key strategies that pave the path to victory.
What it does
We build a model that uses each team's historical characteristics (e.g., historical lane advantages, objective advantage) to predict the outcomes of games between two teams. These pairwise predictions are then used to construct a team ranking when given a set of teams. Then, we are additionally able to explain the model by analyzing which features lead to the predictions in a positive/negative manner. This provides us with an understanding of lane styles and unique team characteristics.
How we built it
This model was built by analyzing over 10k games and over 1k features per game to construct a model using the CatBoost algorithm, which was chosen for its strong performance on tabular data. Then, to explain the model, we use Shapley Values, which is a well-known method in machine learning interpretability. Lastly, for inference, we host the prepared model and data artifacts on a public S3 bucket to minimize load times and ensure general accessibility.
Challenges we ran into
The primary challenge in the main project was properly understanding which features to use for modeling. League of Legends match outcomes are highly noisy, especially when considering the fact that the predictions we use do not use any in-game information, such as graphs and current game state. Hence, there were bottlenecks in improving model performance beyond ~65%. For similar reasons, when explaining which features drive win probability, it was difficult to disentangle statistics that represented the consequences of victory (e.g. gold share at game end) versus statistics that represented causes of victory (e.g., mid push advantage @ 20).
Accomplishments that we're proud of
The key accomplishment is a systematic manner for understanding which granular features impact an upcoming match at the team-specific level. Additionally, by studying the joint set of strengths and weaknesses in team matchups, we can obtain a sense of how different playstyles interact.


Log in or sign up for Devpost to join the conversation.