


Inspiration
UC Davis is acknowledged for the third year in a row as the No. 1 “most sustainable” university in the United States and No. 3 globally. With being at the top comes the responsibility to stay there and lead the community in sustainability and environmental consciousness. To tackle sustainability challenges we need to approach issues from both sides: top-down and bottom-up. From the management side, we can produce rules and policies to save energy. A bottom-up approach is just as important. Students and faculty should be aware of the environmental responsibility that we have should act upon it. As computer scientists, we aspire to use a data based approach to help UC Davis be more sustainable.
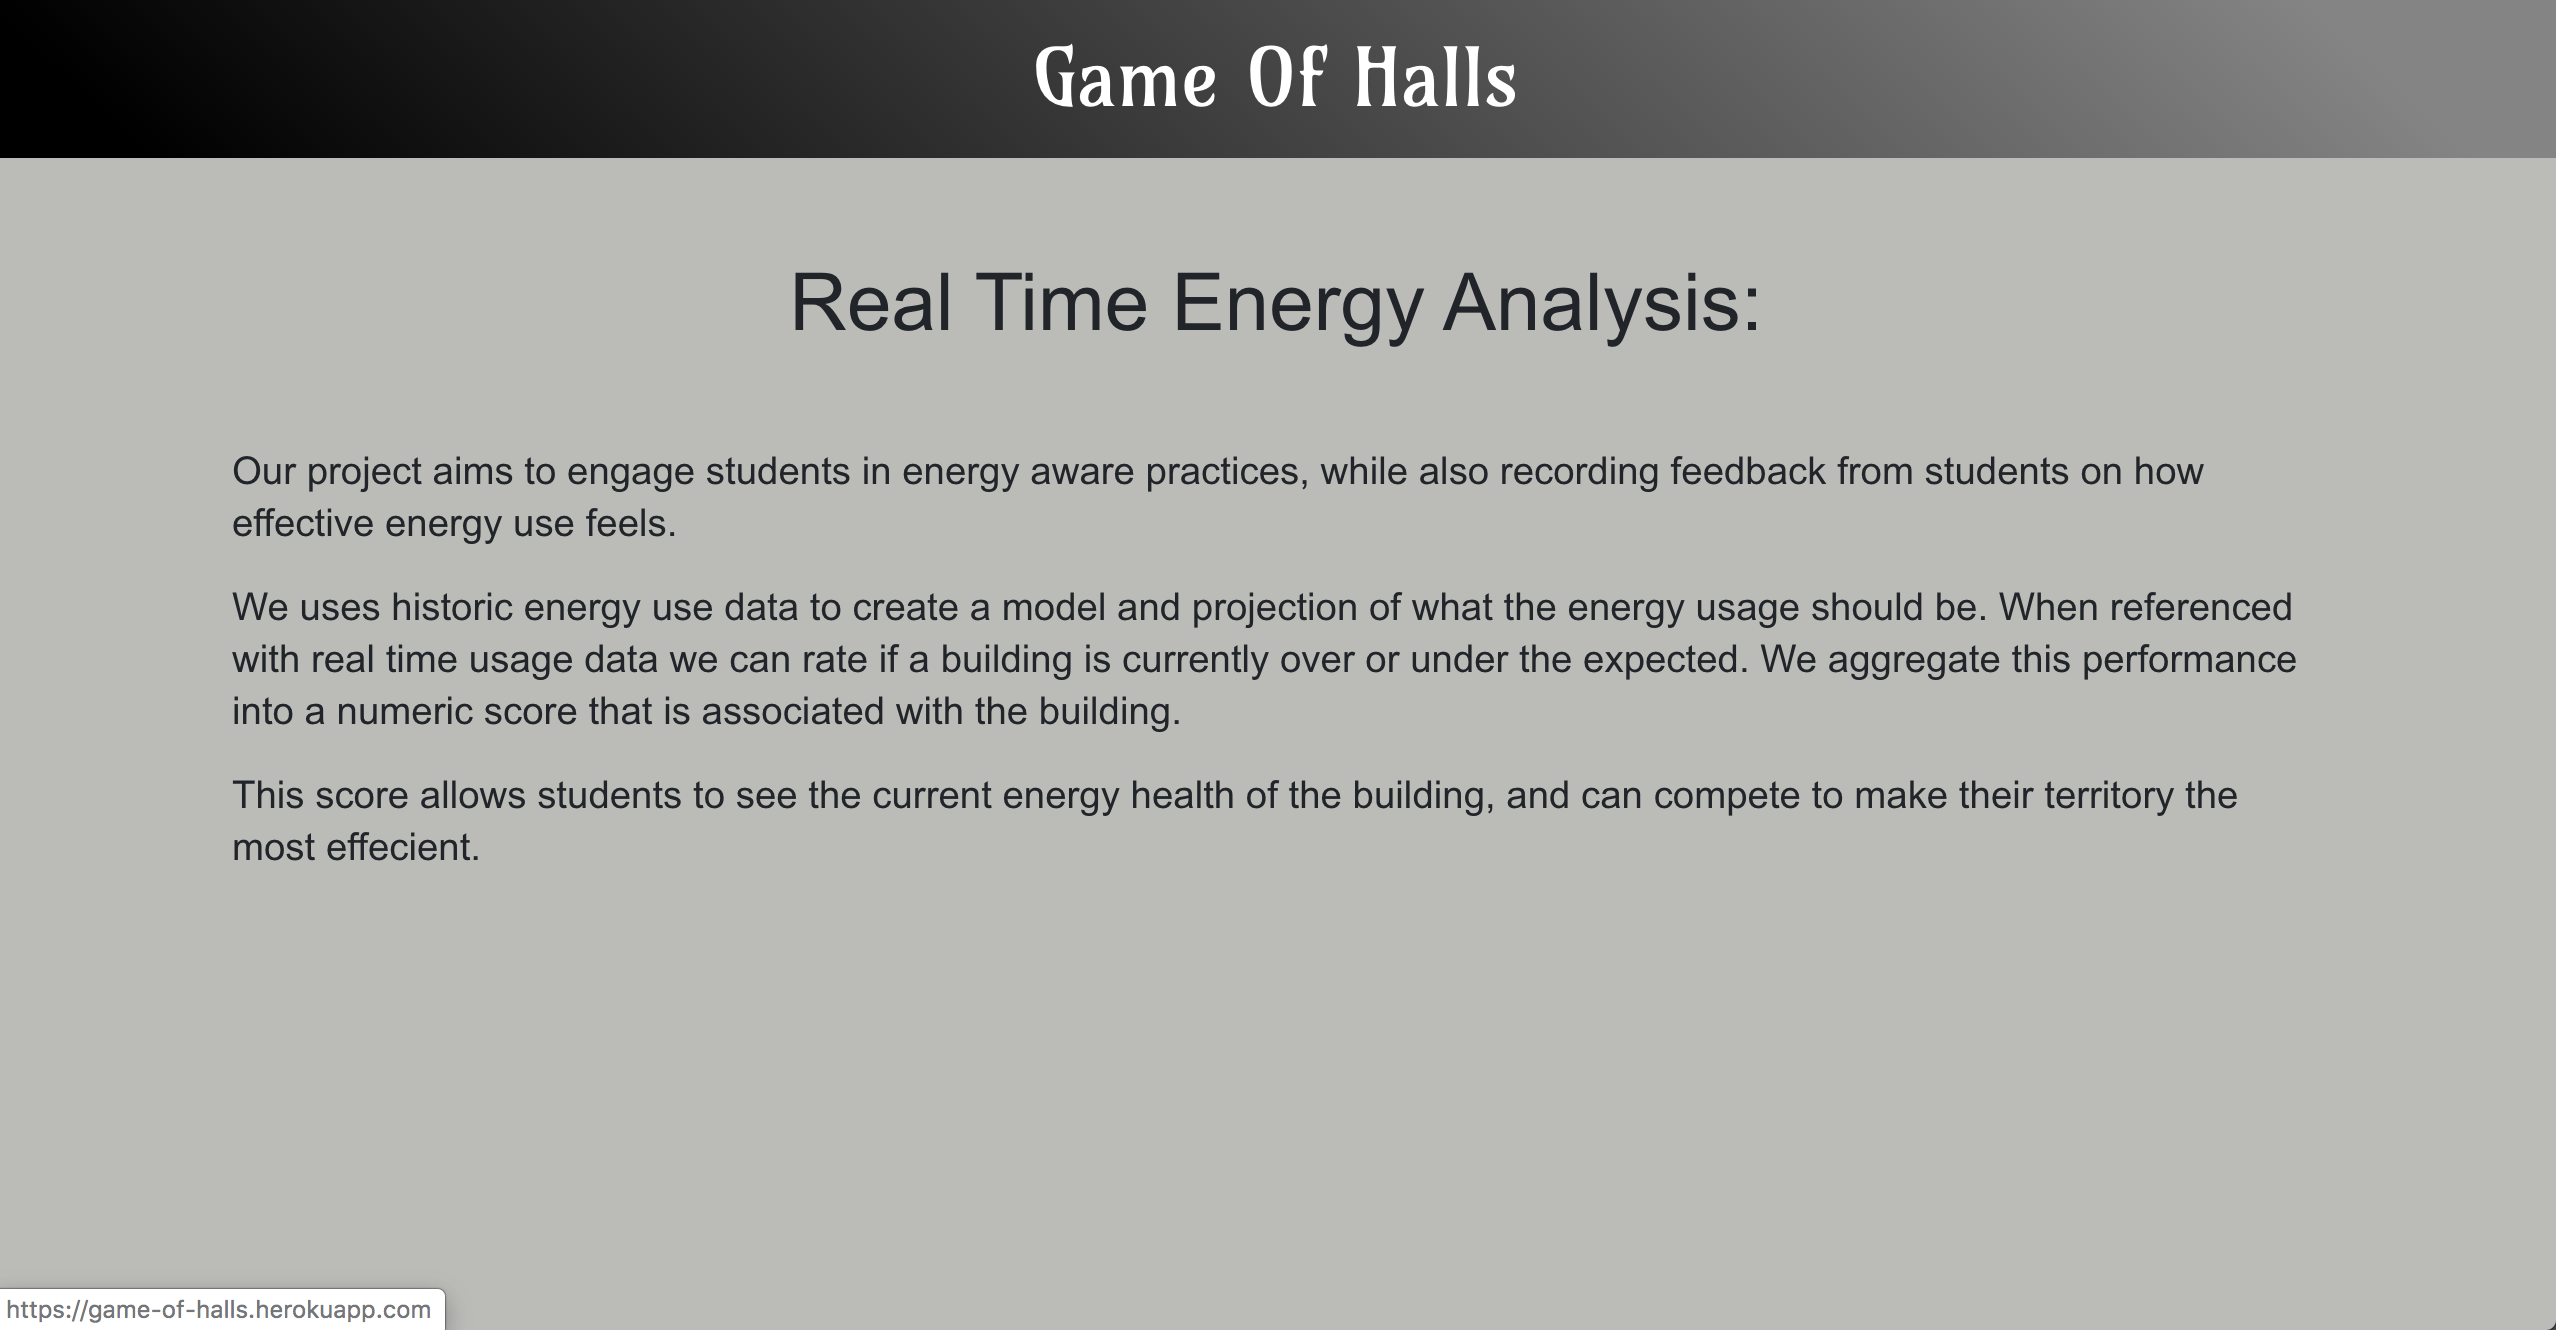
OsiSoft API provides historical data for energy use of UC Davis buildings. By comparing current data to historical data, different buildings are ranked according to energy-efficiency. Who will become "King of the North" / central California?
What it doess
OsiSoft API provides historical data for the energy use of UC Davis buildings. We are building a bidirectional communication channel between the management and the students. Students should be aware of the energy that they are using to motivate them to reduce their usage. We want to make a fun competition to motivate the students to contribute to our application. The competition is called the Game of Halls. By comparing current data to historical data, different buildings are ranked according to energy-efficiency. Who will become "King of the North", and which Hall will reign?
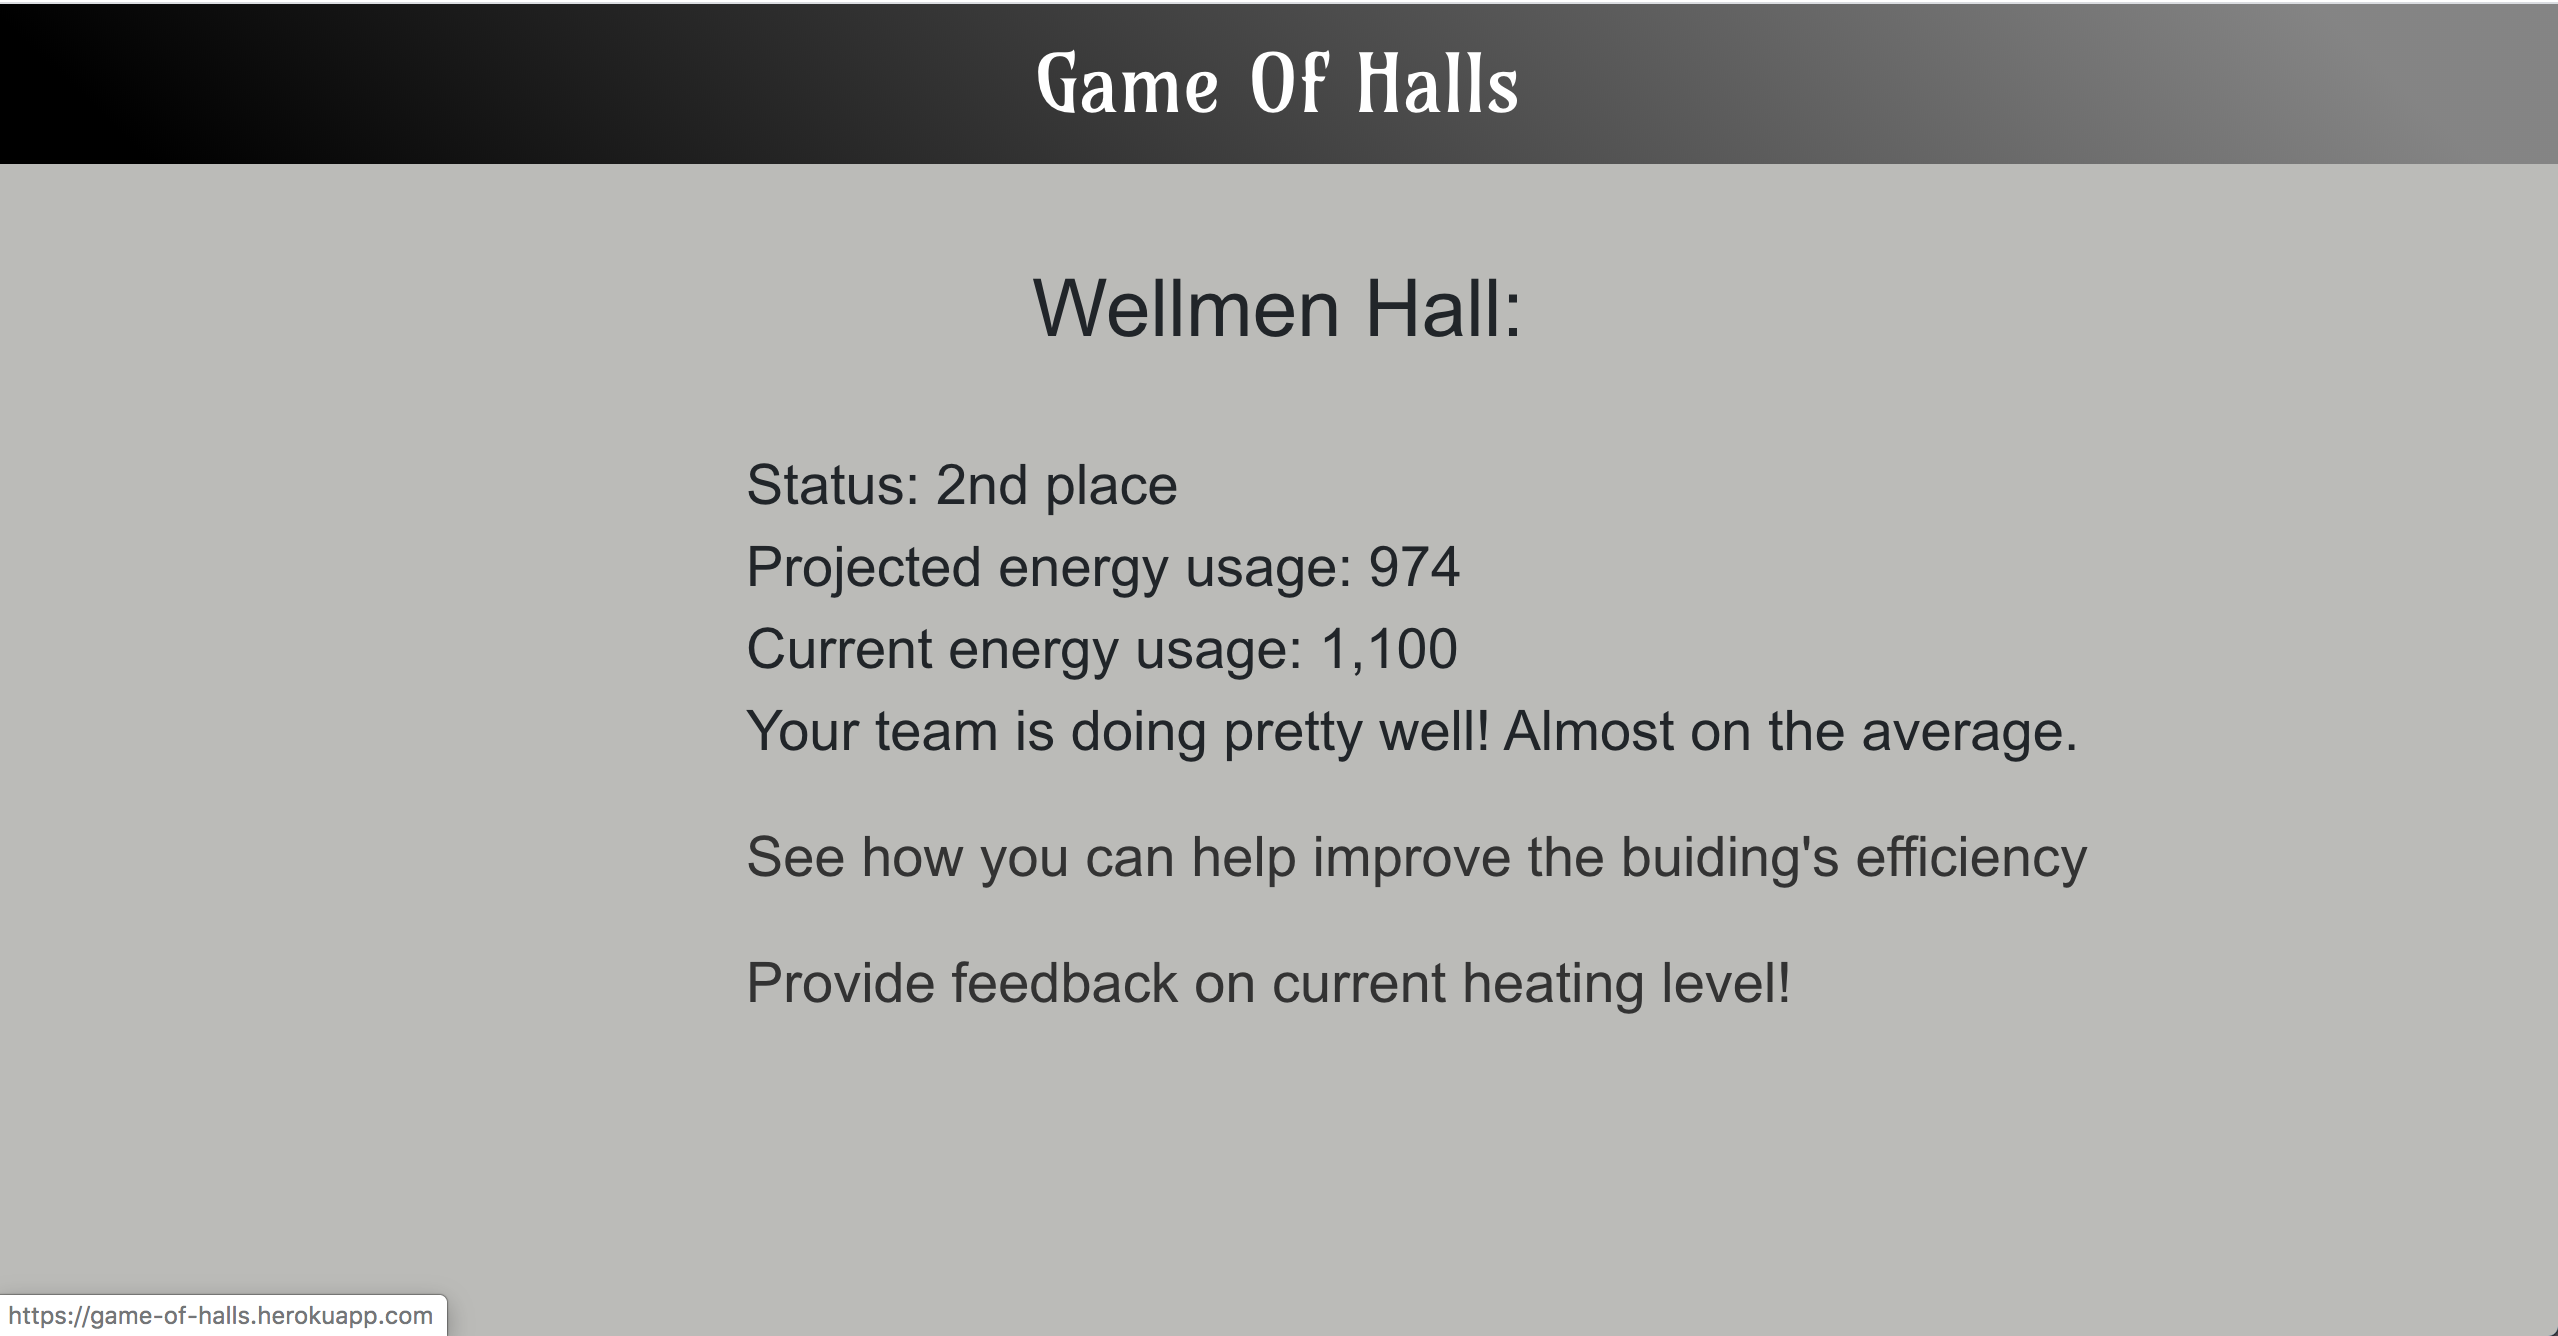
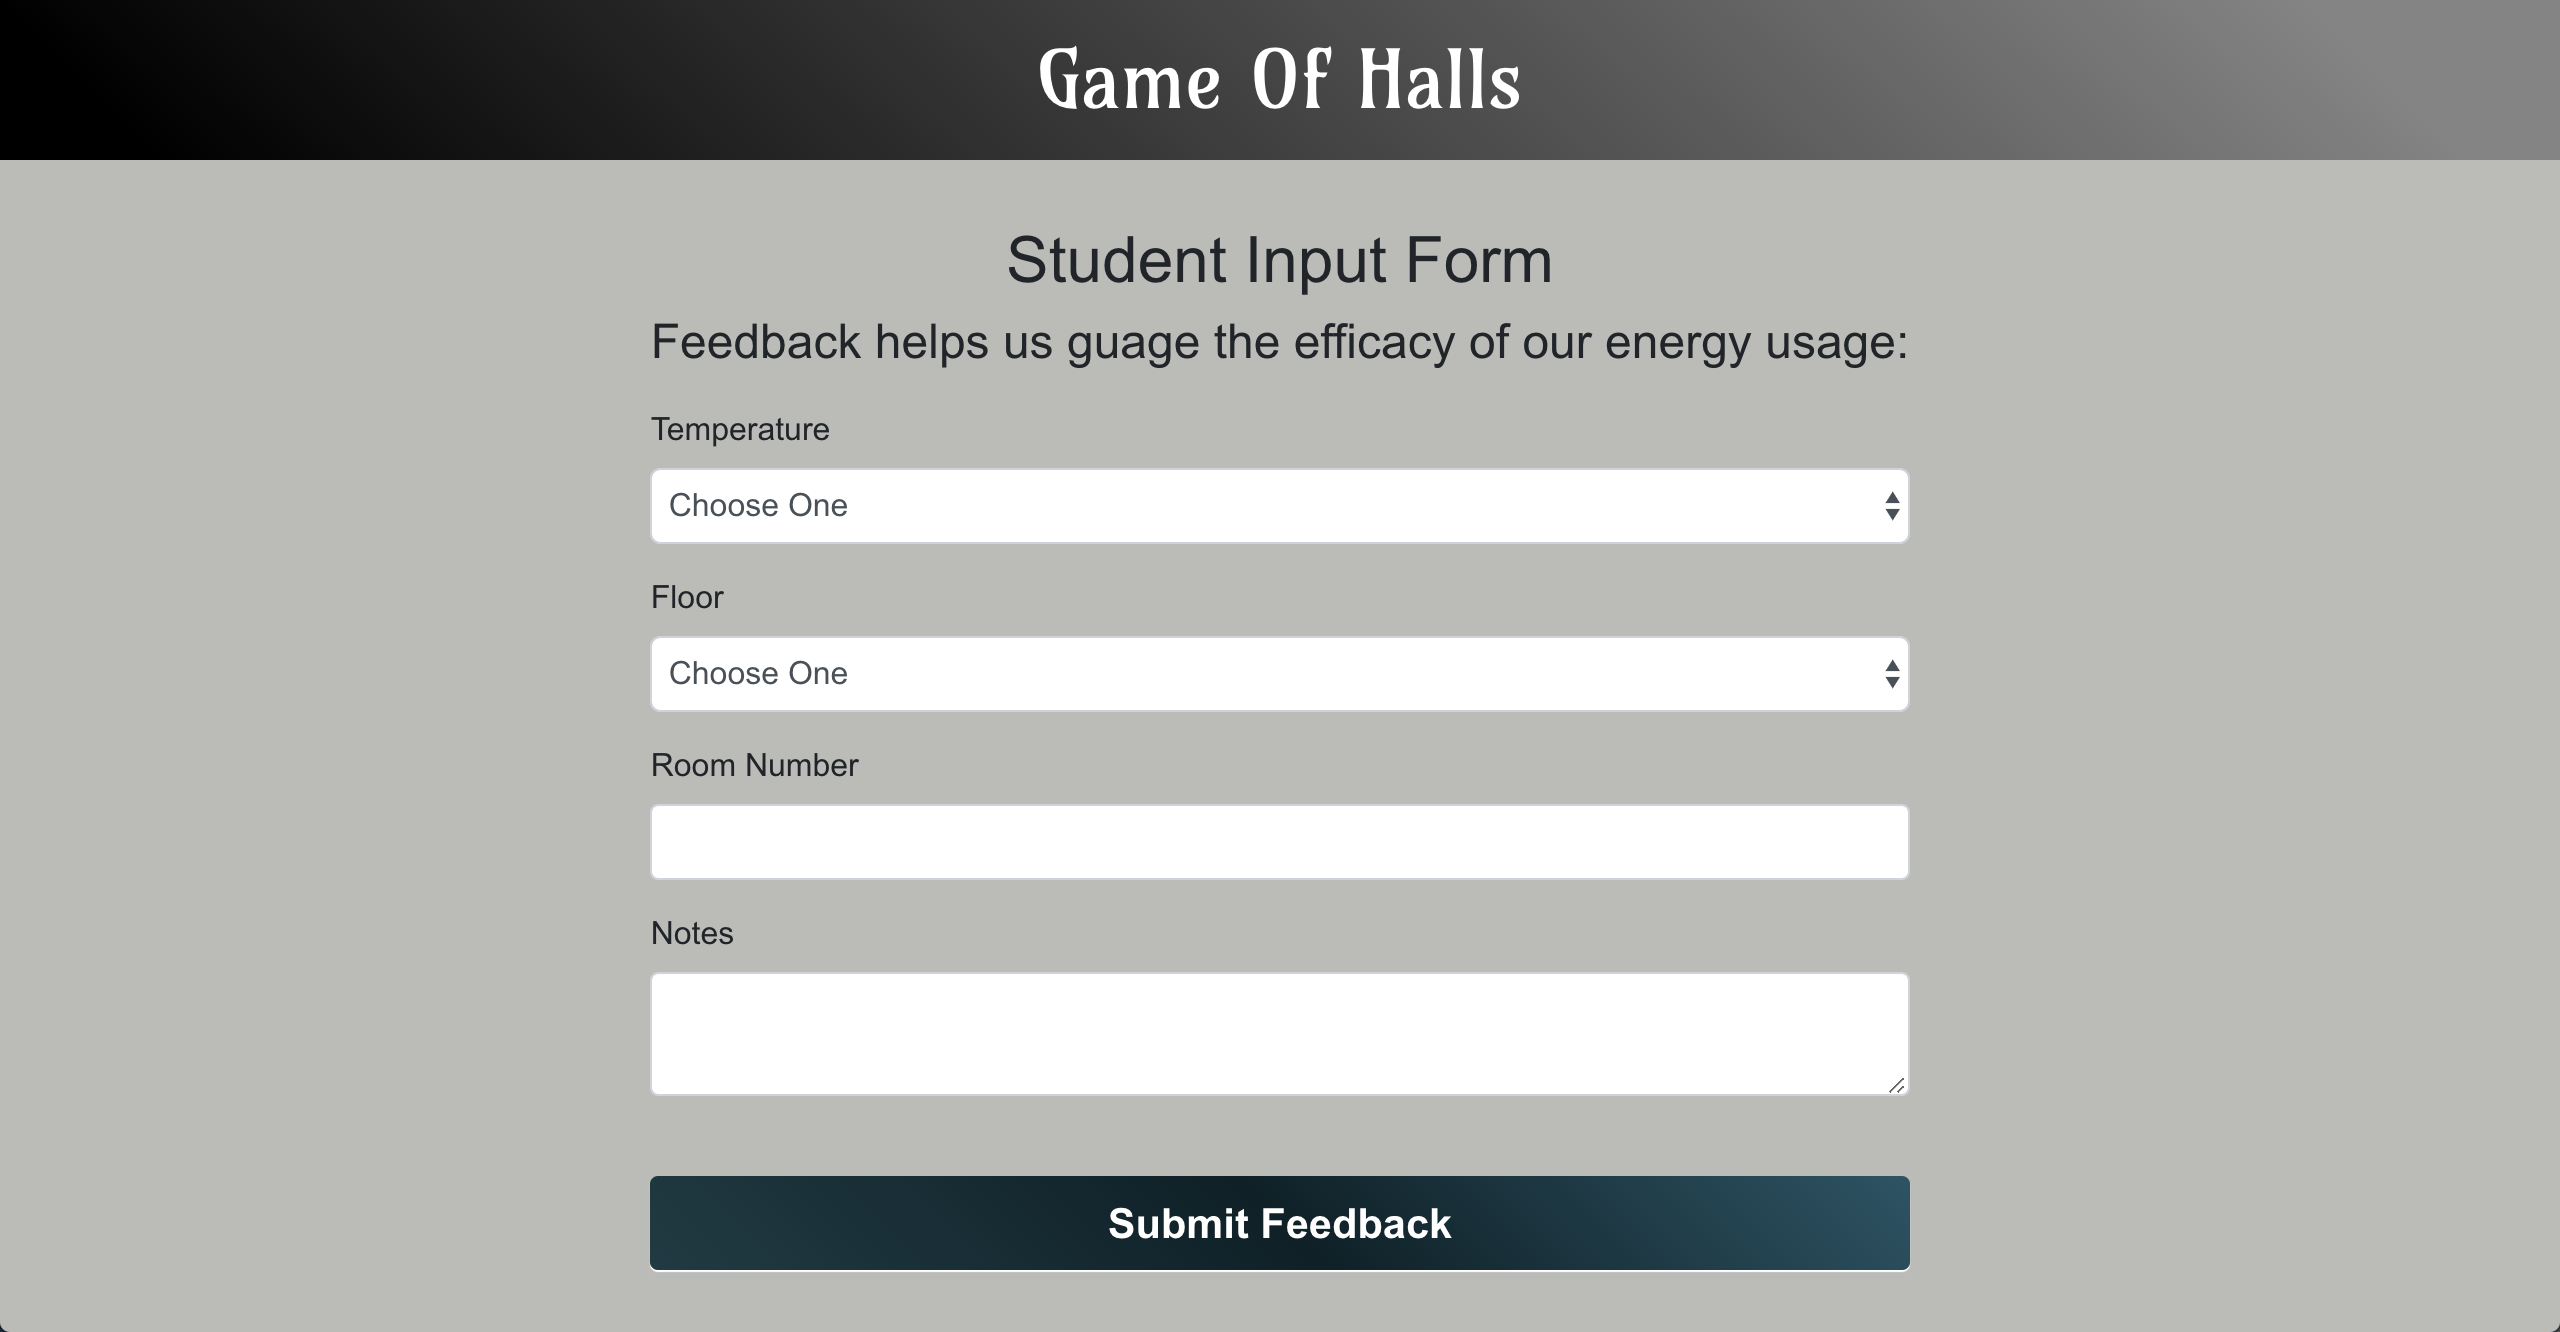
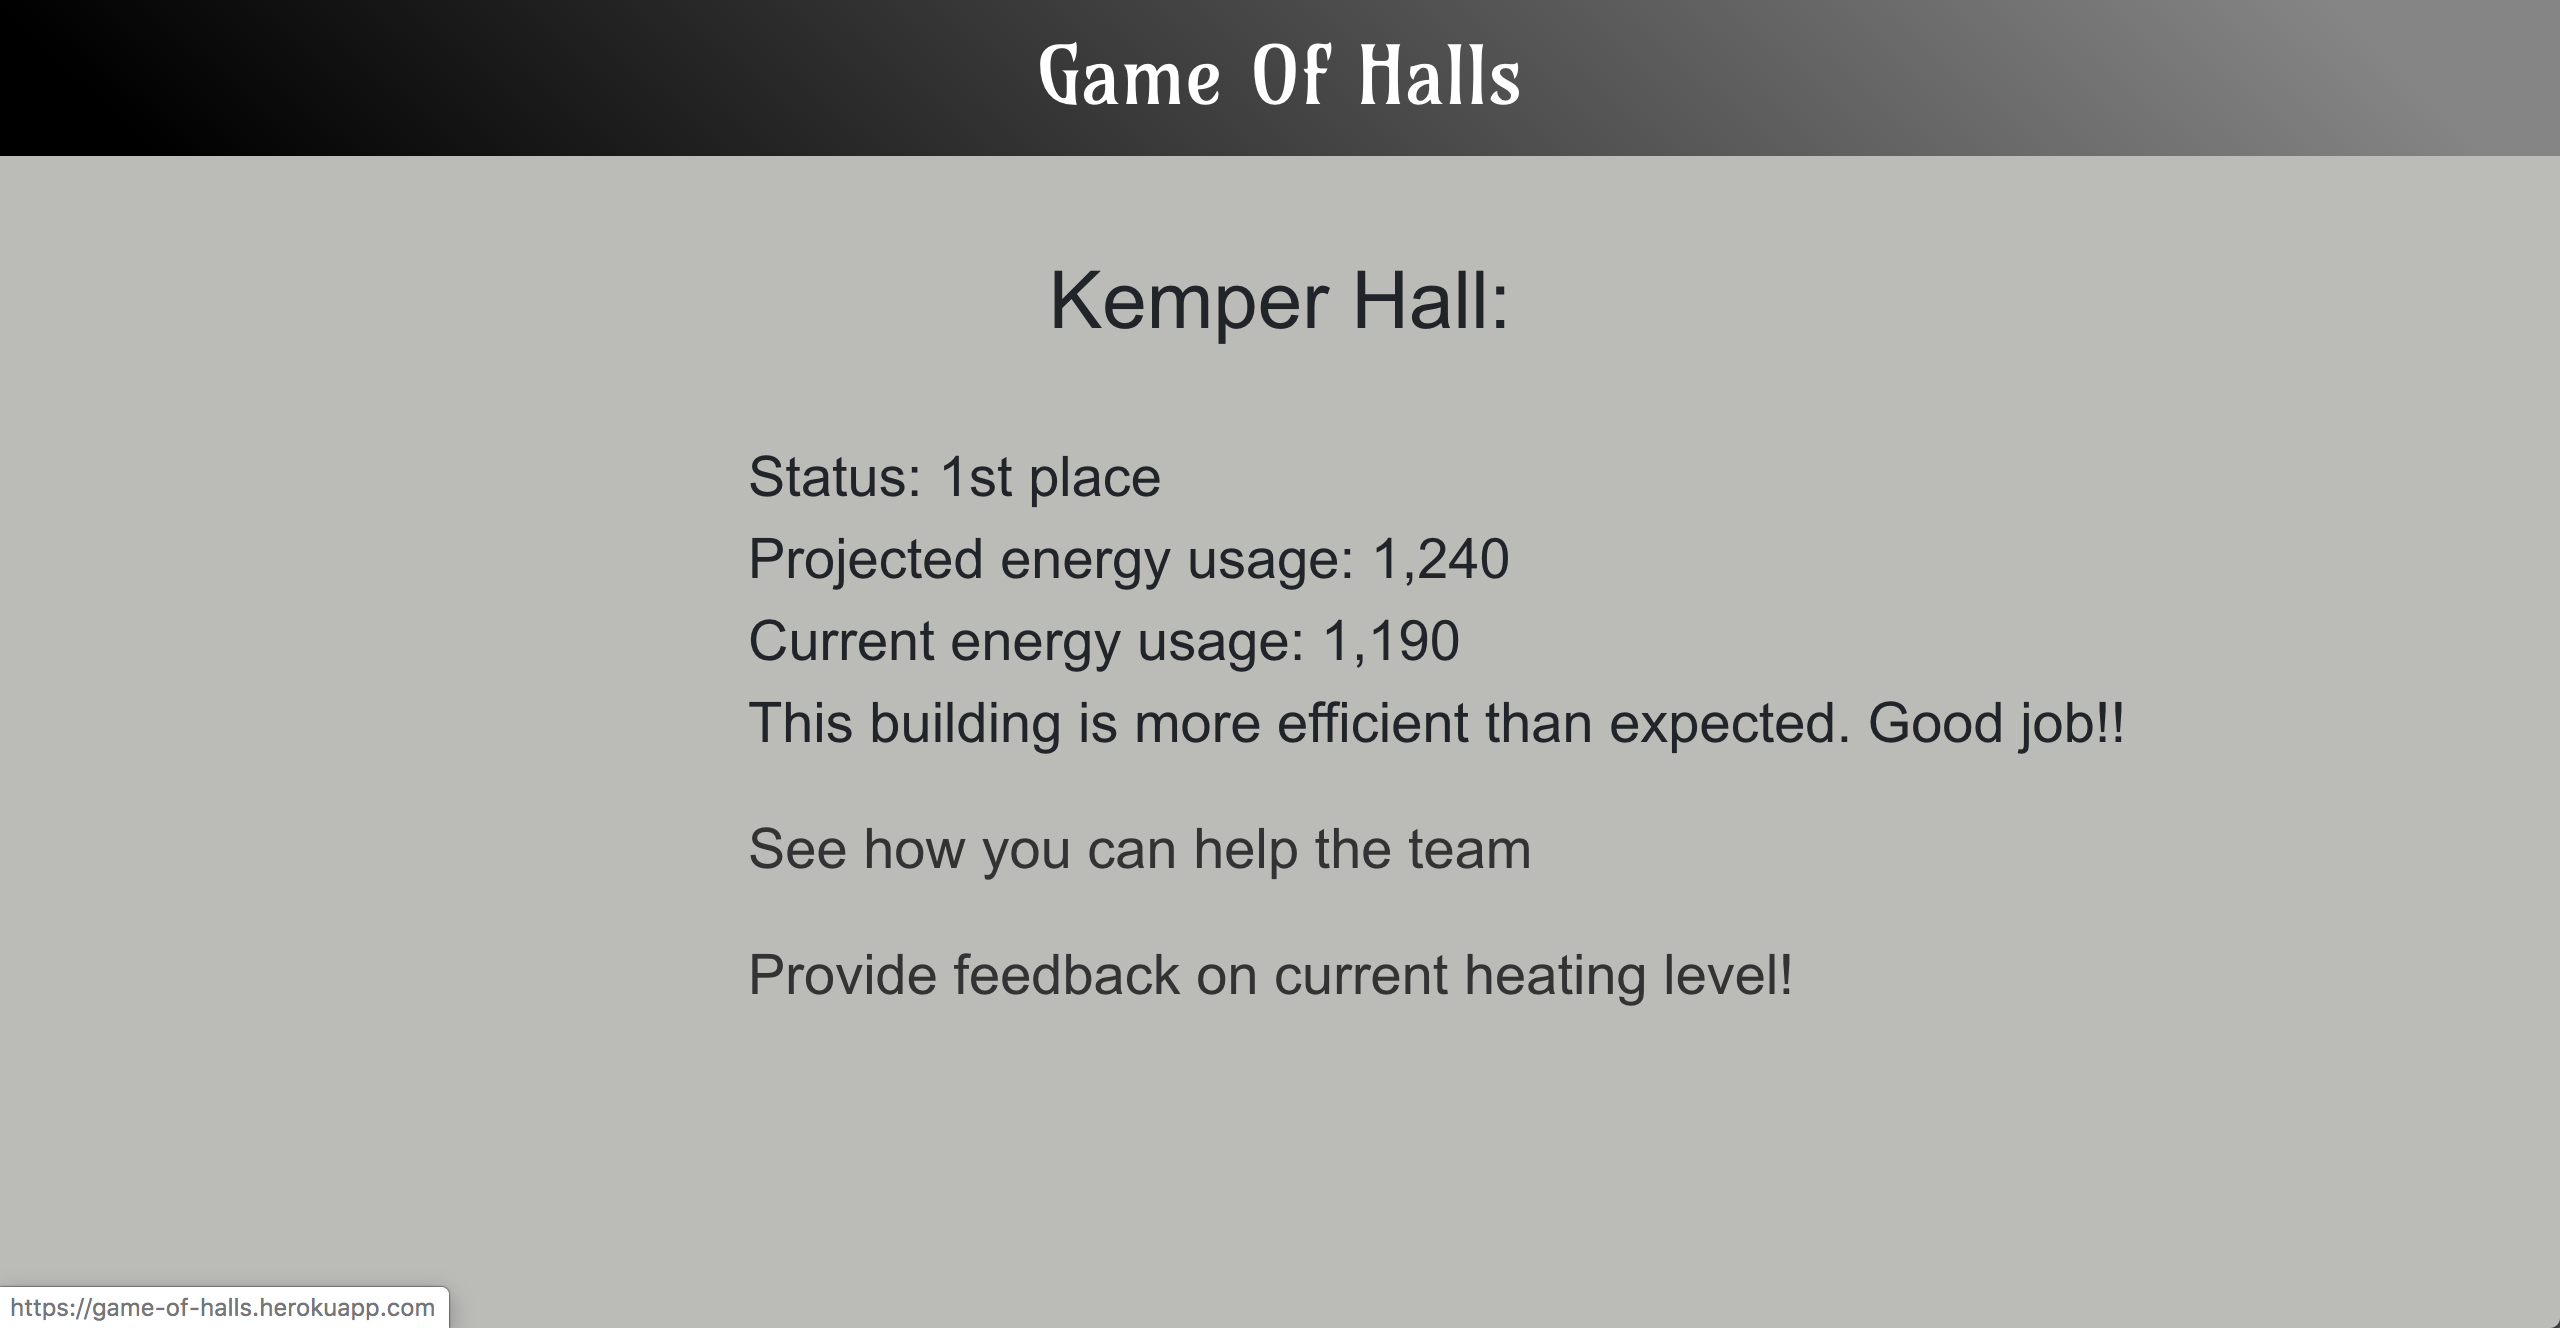
The app will allow students to provide feedback regarding current temperature in different buildings on the UC Davis campus. It may be overly warm inside a particular building, in spite of the best efforts of the UC Davis facilities team. If "overly warm" is reported, heating resources may be reduced, thus giving a particular building a more competitive score.
The app will also provide a list of helpful energy tips, such as reminding students to close windows during cold months, turn out lights, unplug device chargers when not needed, etc.
How I built it
This is two part project integrating data analysis and interactive web-applications. For data, we use the API offered by OsiSoft. There are 3 years of energy consumption data. We use the first two years for training to predict 2019 to see the accuracy of the model. Finally, we want to present the energy consumption levesl and the predictions to students through the web application to improve environmental awareness. Students can try to beat our prediction for the day.
We built a small application with the intention of using firebase and Google App engine, but we had critical struggles with the internet and time. We used Node.js as the server language, and wanted to have a shared database with our data analysis team. The frontend was built with react / CSS / reactstrap, and the browser would get data to render by using Axios to fetch from the API routes /api/buildings. The route handler would request data from firebase and populate a response for the browser. We setup redux to be used as state management to share the data between components, and began to build the associated actions and reducers. The main data fetch would be called in the ComponentDidMount() portion of core App component, and appropriate data would loaded into the redux store. Connect() and MapStateToProps() would then bring this data into the relevant components as props, and we would setup a fetch to update the data (and re-render components) at a 15 minute interval. Routing on the frontend was performed by the use of BrowserRouter from react-router-dom and the history utility.
Flexbox was used heavily in styling of components and building the layouts. Linear gradients in CSS were applied to navbar and buttons. Future versions could include sigils (icons from FontAwesome) for each Hall, and different methods of presentation of building data. Due to time constraints we kept it all as simple as possible and didn't attempt hooks or functional composition of components. We built a separate component for each participating Hall, but could abstract this into dynamic generation of Hall components based on the data.
The app would be promoted in person by passing out business cards with a QR code or website address. Because many students at Davis are environmentally conscious, we think some might be curious to log in and see the energy health of buildings they work in. Deployment would be using Google's firebase.
Challenges I ran into
1.The internet speed 2.our ideas didn't come together until late last night
- figuring out how to compare the buildings' energy consumption. In order to make progress, we focus on one building.
- Our team had a diverse set of experience and skills, and we all found that we had steep learning curve on the tools.
- Ran into issues deploying with Google Cloud, deployed to Heroku as a backup.
Accomplishments that I'm proud of
We feel like this is a good use of the data OsiSoft has made available. It promotes social good by connecting students to information about the energy usage in the spaces that they inhabit. The feedback that students provide could be beneficial in refining the models and optimizing energy usage in the future.
We spent a lot of our time on the design phase of the project, and just ran short on time for implementation. We are proud of the overall design of the project though, and have a clear vision of how to build the application.
What I learned
This was the first Hackathon for the whole team, so it was an eye-opening experience. We went many of the workshops and learned a lot about the tool available for use. We spent most of the time honing our concept and the overall design, and but in the future we'd probably aim to begin the implementation sooner. We would build a team before hand and choose tools that leverage our team members strengths.
What's next for Game of halls:
Future releases could include more participating buildings, more polished web application, mobile implementation, promotional QR code, and more options for data visualization. Since this is an app for social good, we propose to make this an open source project. We will deploy our source code to Github and solicit help from the community for further testing and deployment.

Log in or sign up for Devpost to join the conversation.