-
-
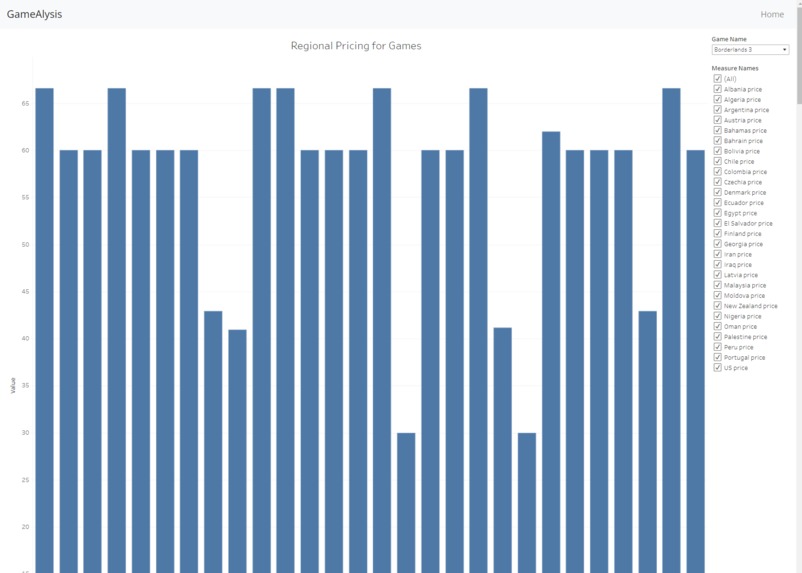
Picture of one of the graphs

Inspiration
As gamers ourselves, we have always been tied to how certain games are priced in certain regions, and with this project we hope to have our aspiration and learning experiences come to fruition!
What it does
This visualization project shows projected markers between different regions that are affected with game pricing and other datasets to compare the cost of having region pricing and not.
How we built it
This project was built with Python and mostly the storing and presentation is through Azure SQL Database Server and Tableau public.
Challenges we ran into
We feel that are biggest challenges of this project were the ever expanding notion of data, and we feel with learning experiences such as this it is great to see the power of data and to be able to expand/limit our scope in future revisions of something such as this.
Accomplishments that we're proud of
As a first time experience for this type of project, we got to.
- Expand upon new learning opportunities through data visualization.
- Exploring different technologies such as Tableau, and Datasets. ## What we learned
- There is lot more in data that we need to learn.
- To keep it as simple to the user as possible.
What's next for Game Analysis Project
- Expanding upon the backend and frontend of this project
- Being able to learn more about the world of data and incorporate this into this project and beyond!

Log in or sign up for Devpost to join the conversation.