-
GaitGuard Logo
-
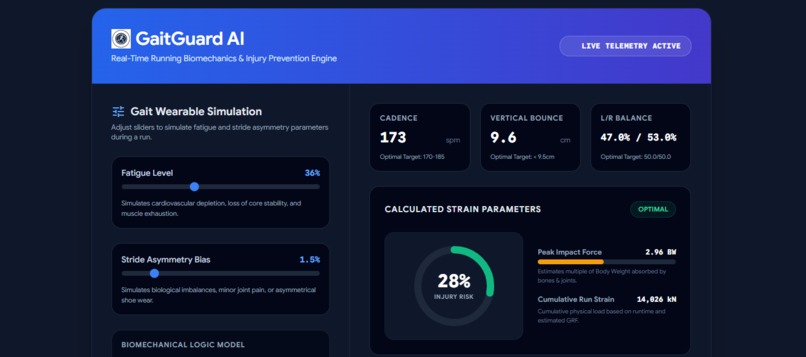
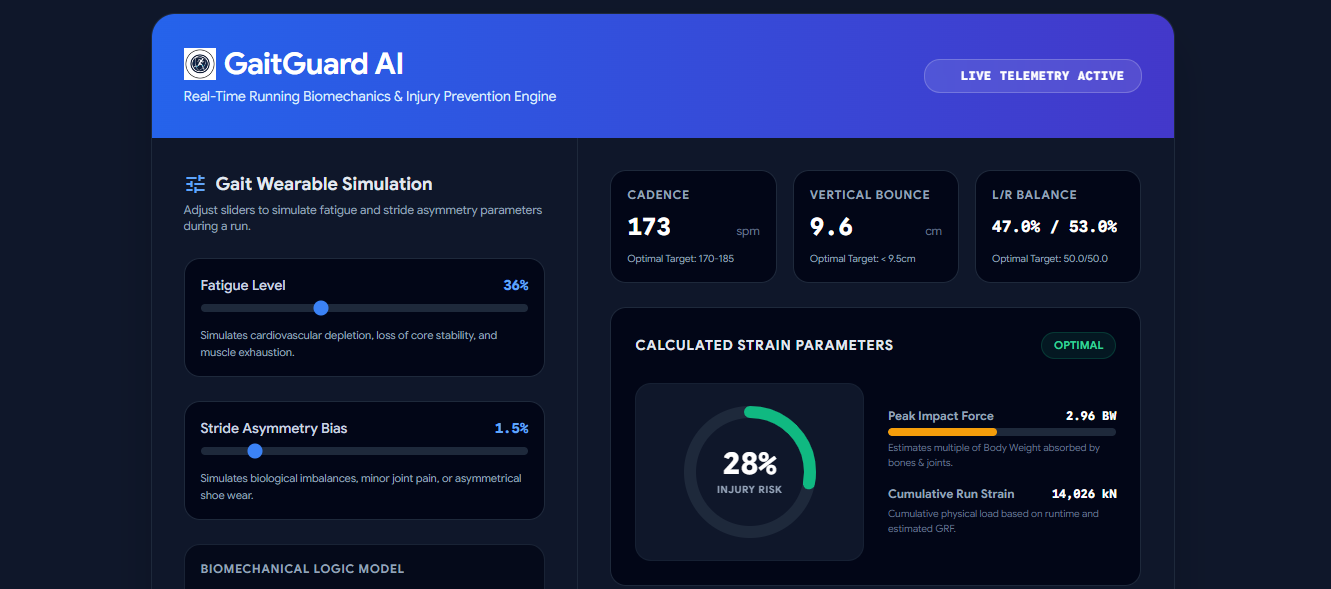
Dashboard
Project Demo Link: https://canva.link/fnmzby5pg0dwiv5
- Inspiration: Over 50% of recreational runners suffer an injury annually (such as Patellofemoral Pain Syndrome, Shin Splints, or Achilles Tendinopathy). The primary culprit is not a single traumatic event, but rather the cumulative micro-trauma caused by fatigue-induced gait degradation and bilateral load asymmetry.
Currently, runners only discover these issues after tissue damage has occurred and pain sets in. High-end athletic labs can perform 3D gait analysis, but these services are highly expensive, stationary, and inaccessible to the everyday runner. There is a massive analytics gap between raw wearable telemetry (such as steps or simple cadence) and clinical biomechanical insights.
- What it does: GaitGuard AI bridges this gap. It is a proactive software engine designed to run on a smartphone or smartwatch. By ingesting basic motion data (accelerometer and gyroscope data easily obtained from modern running watches or smart insoles), GaitGuard AI extracts high-level spatial-temporal metrics:
Cadence (C, in spm): Step frequency. Vertical Oscillation (V_o, in cm): The vertical displacement of the runner's center of mass. Bilateral Ground Contact Time Symmetry (S_{gct}): The ratio of ground contact time between the left and right foot.
The system uses these inputs to continuously calculate a real-time Injury Risk Index (IRI) and peak Ground Reaction Forces (GRF). If fatigue causes a runner's form to decay past a physiological threshold, or if an asymmetrical limp is detected, the app provides real-time, non-intrusive audio coaching cues to correct their stride immediately or advises them to end their session safely.
- The Science & Mathematical Framework: GaitGuard AI relies on validated dynamic equations to map raw metrics to physical strain: Dynamic Peak Ground Reaction Force (F_{peak}) Estimate
We estimate vertical ground reaction forces in units of body weight (BW) using an approximation based on vertical oscillation (V_o) and cadence (C): F_{peak} \approx 2.0 + \alpha \cdot \left(\frac{V_o}{C}\right) + \beta \cdot A_{bias}
Where: V_o is the vertical oscillation (typically 6.0 \text{ cm} \le V_o \le 13.0 \text{ cm}). C is the stride cadence in steps per minute. A_{bias} is the calculated bilateral asymmetry bias percentage (0\% \le A_{bias} \le 10). \alpha \approx 15.0 and \beta \approx 0.08 are empirically derived scaling coefficients.
As fatigue rises, vertical bounce (V_o) naturally increases due to failing core and hip stability, while cadence (C) decreases. This causes the ratio \frac{V_o}{C} to expand exponentially, driving up the impact forces absorbed by the lower limbs with every single stride.
Cumulative Biomechanical Stress & Injury Risk Index (IRI)
We model the probability of repetitive strain injury as a function of cumulative dynamic stress: IRI = \min\left(100, \omega_1 \cdot F_{load} + \omega_2 \cdot A_{bias}\right)
Where: F_{load} = \text{Fatigue Level (\%)} \times 0.70 represent the metabolic and structural degradation under stress. A_{bias} = |50\% - \text{Left Contact Balance}| \times 2.0 represents mechanical load inequalities. \omega_1 = 1.0 and \omega_2 = 4.0 are safety weights.
When IRI > 70\%, the runner enters the Critical Red Zone, where tissue strain exceeds average ligamentous elasticity limits, triggering immediate stop alerts.
- How we built it: We engineered a high-fidelity interactive dashboard using standard web technologies:
Frontend Interface: Handcrafted in Tailwind CSS, designed for high contrast and extreme readability on a smartphone or watch screen during intensive physical activity.
Visualization Engine: Powered by Plot.js and standard SVG rendering to produce real-time dynamic charts mapping Fatigue vs. Impact Force.
Scientific Notation: Rendered using dynamic KaTeX to show the user the precise biomechanical formulas processing their data, proving the computational validity of our sports science calculations.
Coaching Expert Engine: A rule-based translation matrix that takes mechanical variables and outputs precise verbal coaching cues and physical therapy exercises customized to the runner's exact biomechanical weak points.
Challenges we ran into: Our primary challenge was designing a robust system that works with minimal sensor arrays. Traditional gait labs require 12+ infrared cameras. We successfully simplified the computational math so that we can approximate complex ground forces using only a single pelvis-worn sensor (or smartphone strapped to the waist) combined with bilateral foot pod outputs.
Accomplishments that we're proud of & learnt from: We are incredibly proud to have created a tool that does not simply log retrospective workout data, but actively acts as an on-the-fly biomechanical protector. It makes clinical sports science understandable, actionable, and accessible to any regular citizen looking to stay healthy.
What's next for GaitGuard:
Machine Learning Personalization: Train the app on a runner's baseline "fresh gait" over their first 3 runs, establishing a highly customized anomaly detection envelope.
Haptic Smart-Shoe Integrations: Partner with smart-insole companies to directly read pressure sensor arrays to calculate exact center-of-pressure (CoP) progression curves.
Clinical Pilot Study: Partner with a university sports medicine department to track over a 100 runners over a 6-month period to validate if our real-time coaching alerts successfully reduce injury rates.

Log in or sign up for Devpost to join the conversation.