GAIA: Graph Analysis & Intelligence Agent
Inspiration
The gaming world generates vast networks of interconnected data that hold immense hidden insights. I was inspired by the challenge of making complex graph analytics accessible to anyone through natural language.
The Steam platform, with its rich user-game relationships, presented the perfect opportunity to demonstrate how graph intelligence can unlock patterns that traditional analytics miss. I wanted to create a system where asking complex questions about gaming relationships is as simple as having a conversation.
What it does
GAIA (Graph Analysis & Intelligence Agent) is an AI-powered analytics platform that transforms natural language questions into complex graph queries and visualizations.
Using a Steam gaming dataset with users, games, and playtime relationships, GAIA can:
- Perform complex network analysis like community detection, centrality calculations, and path finding.
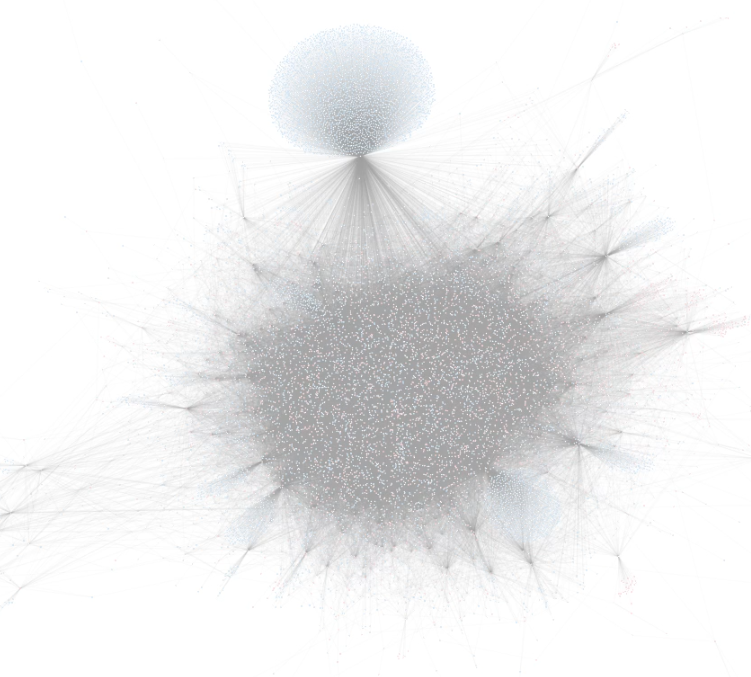
- Generate interactive visualizations showing relationships between games and players.
- Identify game recommendations based on network patterns.
- Detect communities of players with similar tastes.
- Find "bridge games" that connect different gaming communities.
- Analyze user playing patterns and statistics.
- Visualize the structure of gaming ecosystems through force-directed graphs, heatmaps, and other specialized visualizations.
Users simply ask questions in plain English, and GAIA handles the complex graph querying, algorithm selection, and visualization creation automatically.
How I built it
I developed GAIA using a multi-agent architecture that leverages:
- Graph Database Layer: ArangoDB stores my Steam gaming network with users, games, and playtime relationships.
- RAG Agent: Processes natural language queries and constructs complex AQL (ArangoDB Query Language) queries or NetworkX algorithms to extract the requested insights.
- Visualization Agent: Analyzes results and dynamically generates appropriate D3.js visualizations based on the data structure and query intent.
- LangGraph Framework: Orchestrates the agent workflow, allowing for conditional processing paths and tool selection.
- Gradio Interface: Provides a clean, accessible frontend where users can input queries and view results.
I integrated both direct database queries and NetworkX graph algorithms to support a wide range of analytical capabilities, from simple statistics to complex community detection and path finding.
Challenges I Faced
- State Management & Data Sharing: Ensuring tools and agents maintain awareness of previously retrieved data while preventing redundant processing and context overflow.
- LangGraph Integration: Dealing with undocumented features, debugging state transitions, and handling inconsistent state propagation across nodes.
- D3.js Prompt Engineering: Crafting prompts that generate accurate and adaptable visualizations while avoiding context window limitations and handling diverse data structures.
Accomplishments I'm Proud Of
- Seamless State Management: Designed a sophisticated data-sharing architecture that allows data retrieved in one step to be leveraged in subsequent steps, creating a continuous knowledge chain and reducing redundant queries.
- Dynamic Visualizations: Engineered a system that analyzes data structure and generates custom D3.js visualizations instead of using pre-built templates.
What I Learned
- Gradio UI Development: Balanced simplicity with powerful functionality
- Multi-Agent System Architecture: Designed specialized agents for query translation, algorithm execution, and visualization.
- State Management & Context Retention: Implemented coherent state management within LangGraph and custom state reducers and routing logic to maintain knowledge across the workflow.
What's Next for GAIA
- Vector Similarity Search: Enhance recommendations by embedding game descriptions and genres into vector space, allowing semantic search beyond player overlap.
- Persistent Visualizations: Enable saved visualizations, allowing users to compare results.
- Dashboard Feature: Introduce dashboard feature over the visualization to support filters and other customization settings.


Log in or sign up for Devpost to join the conversation.