-
-
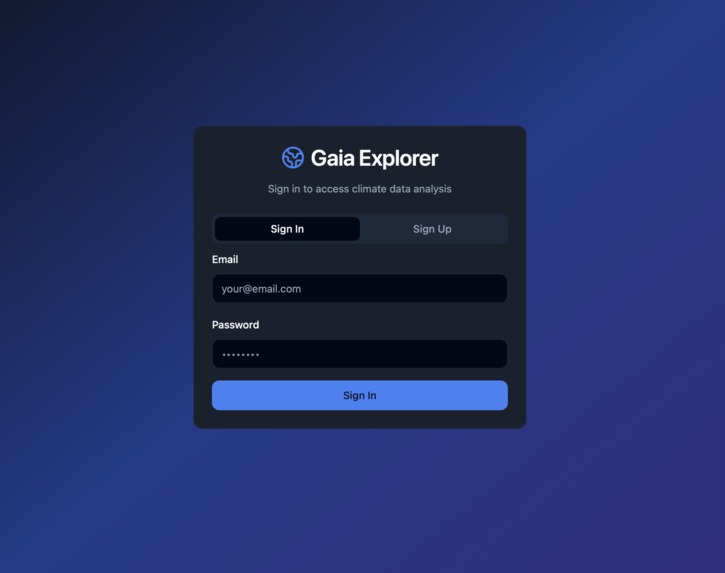
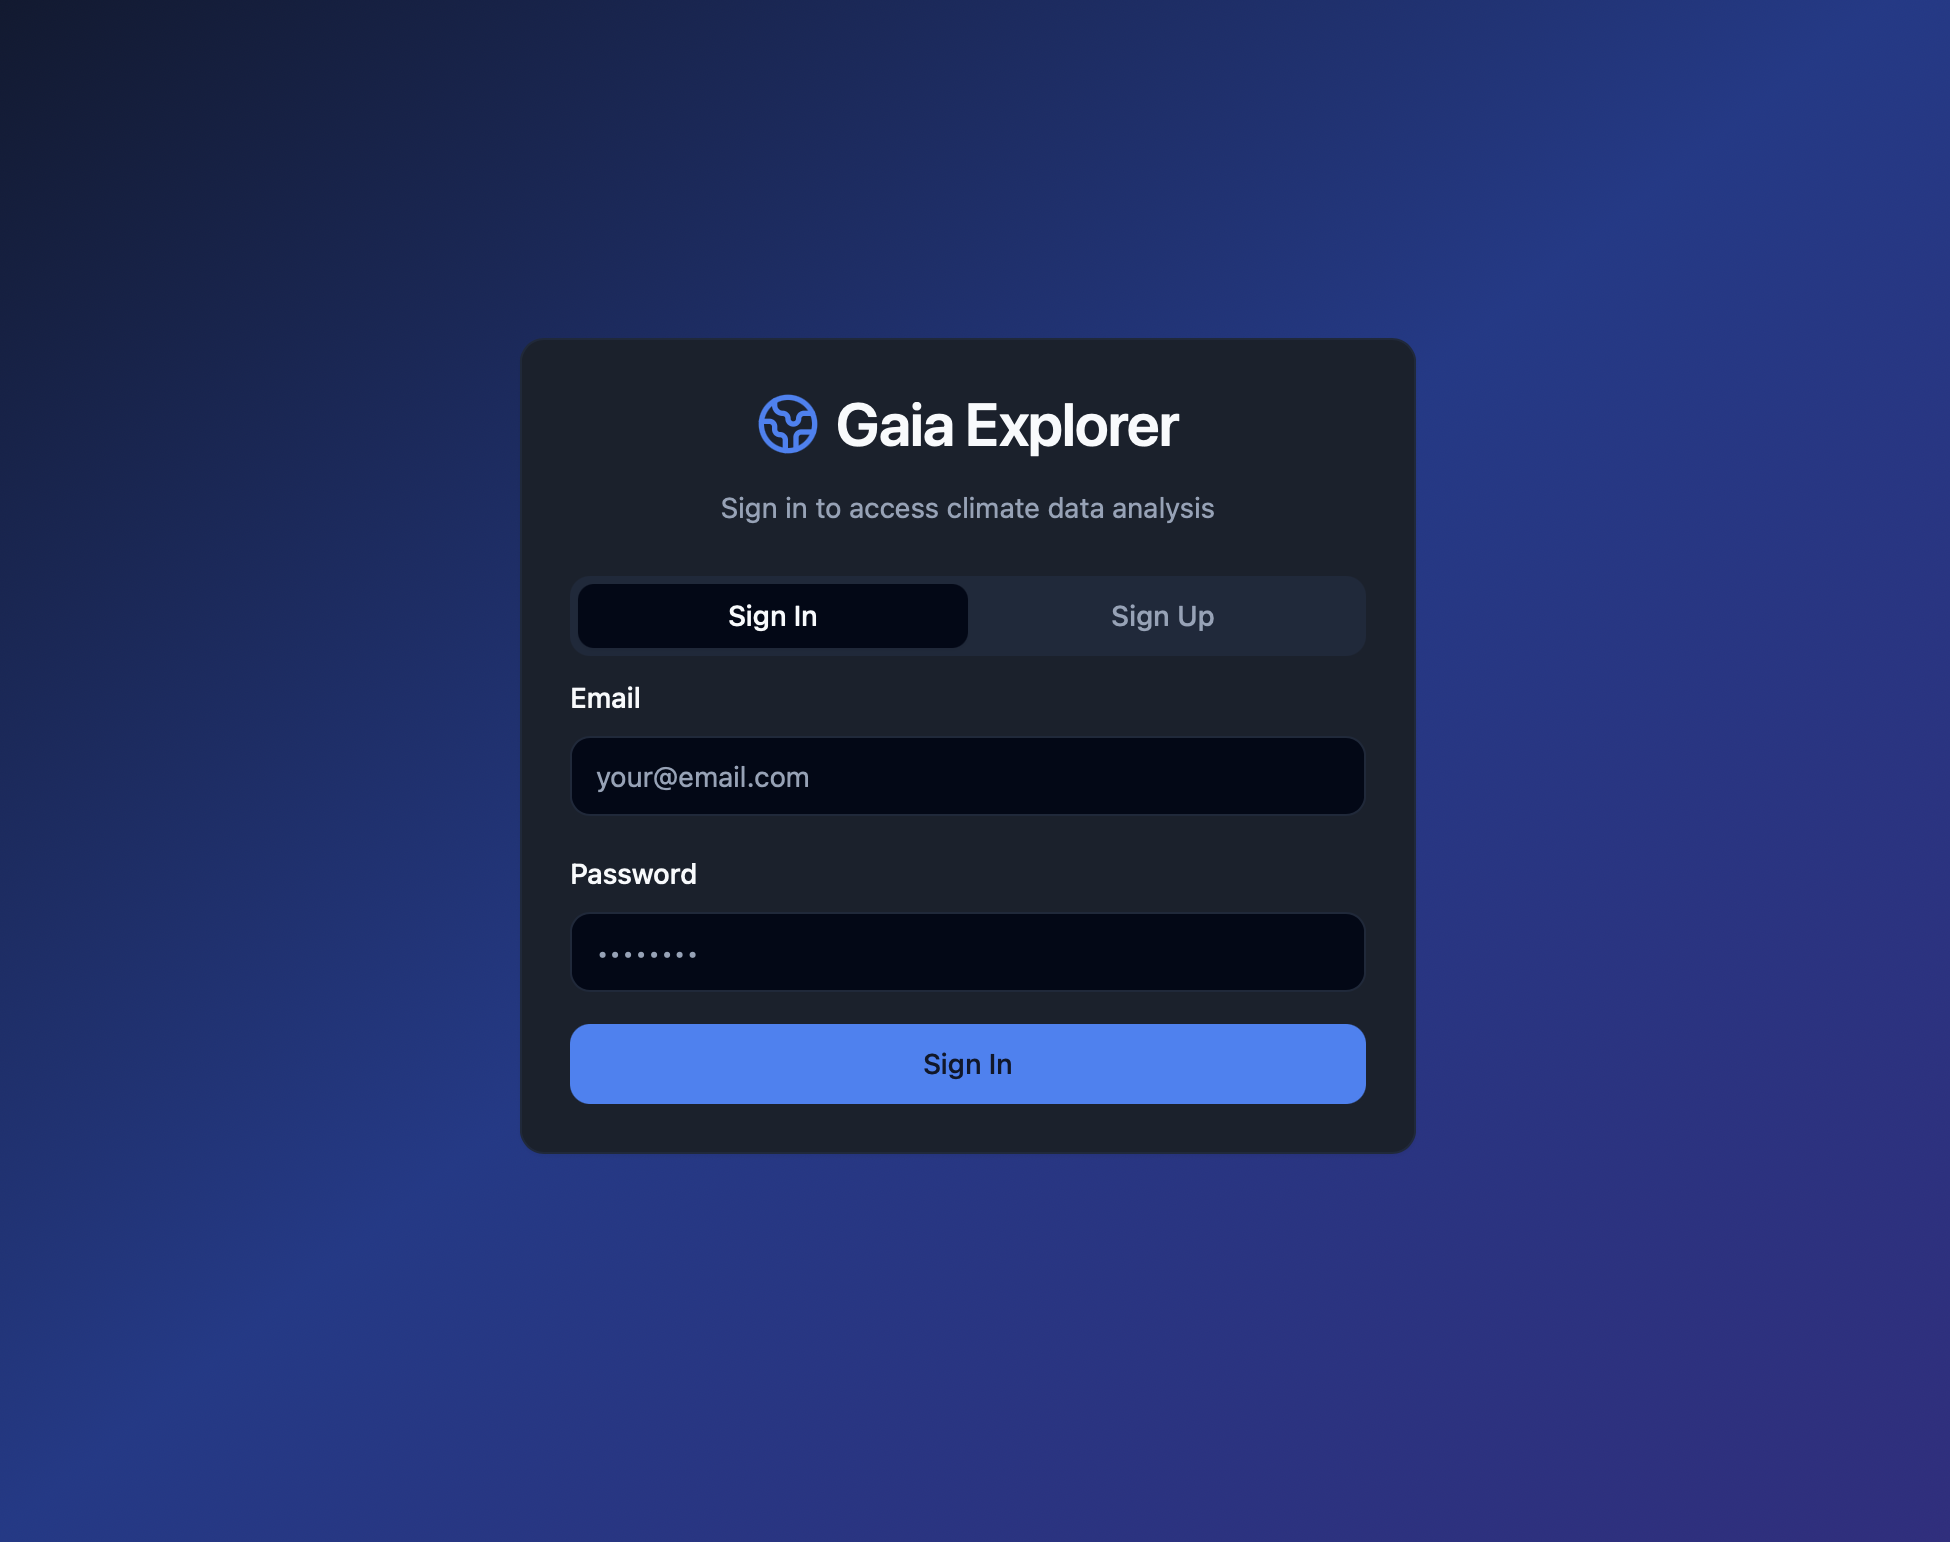
Log in page
-
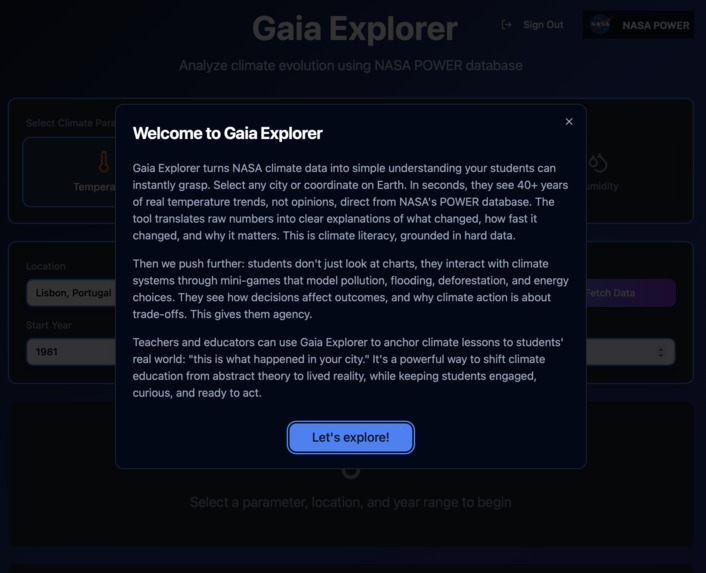
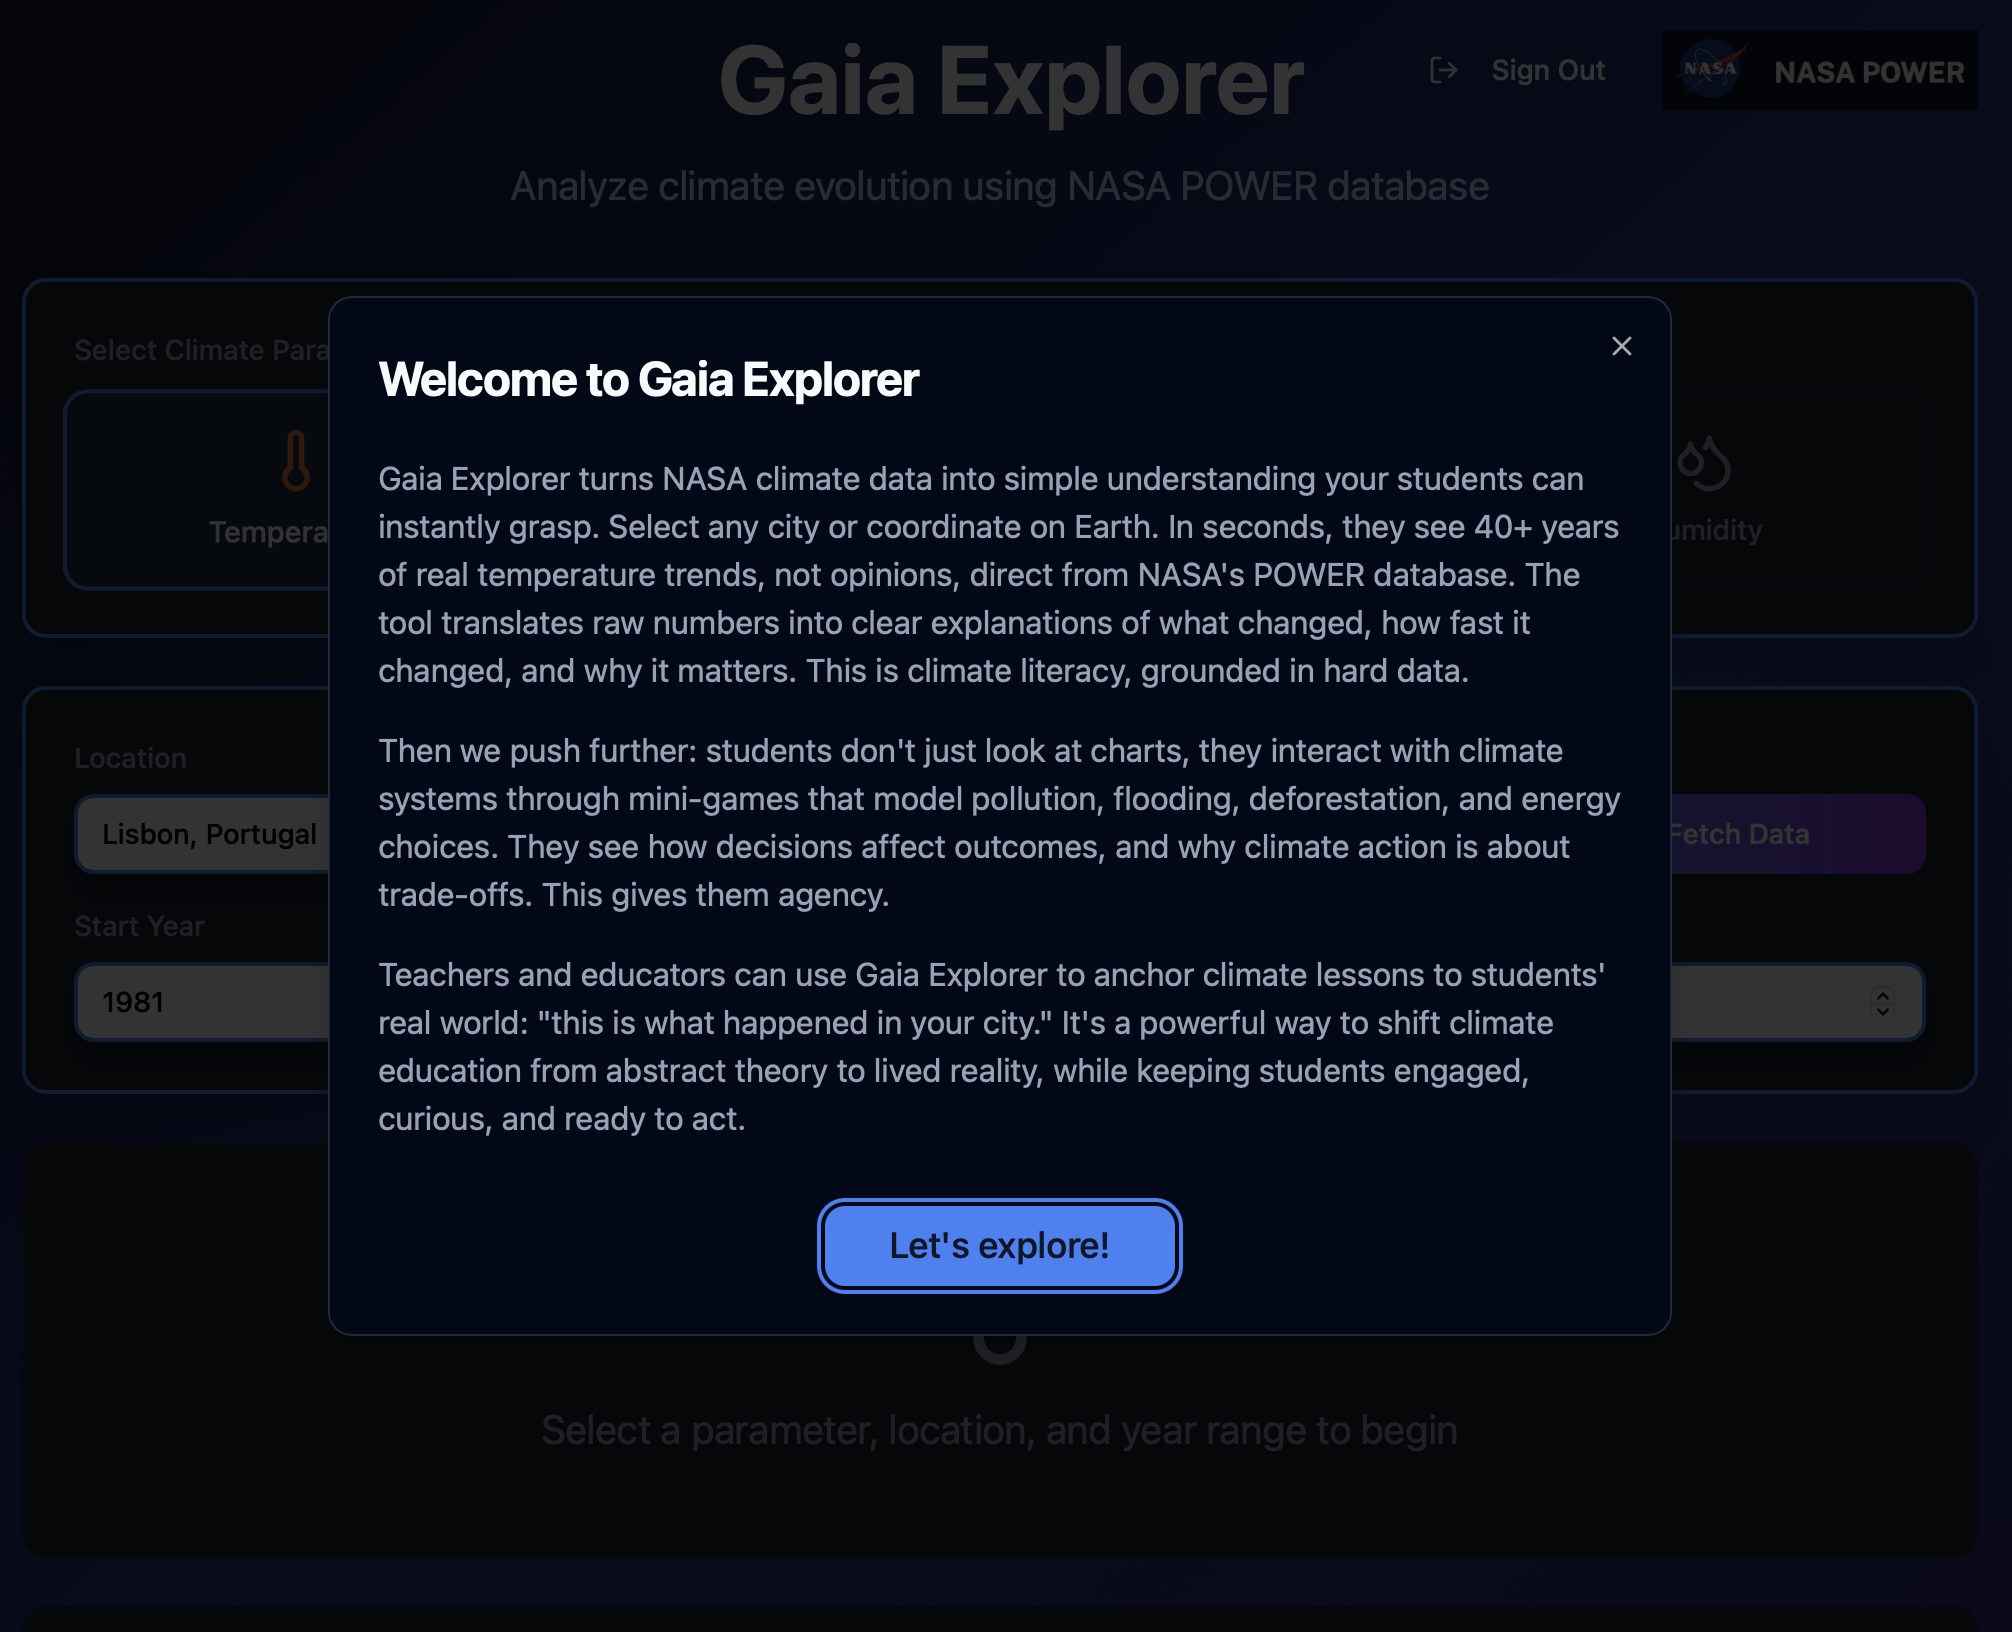
Dialogue window explaining who this app is for and why
-
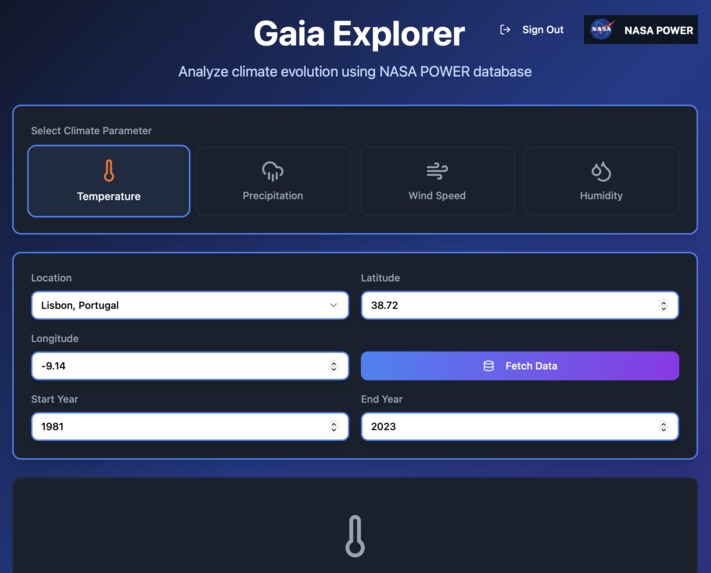
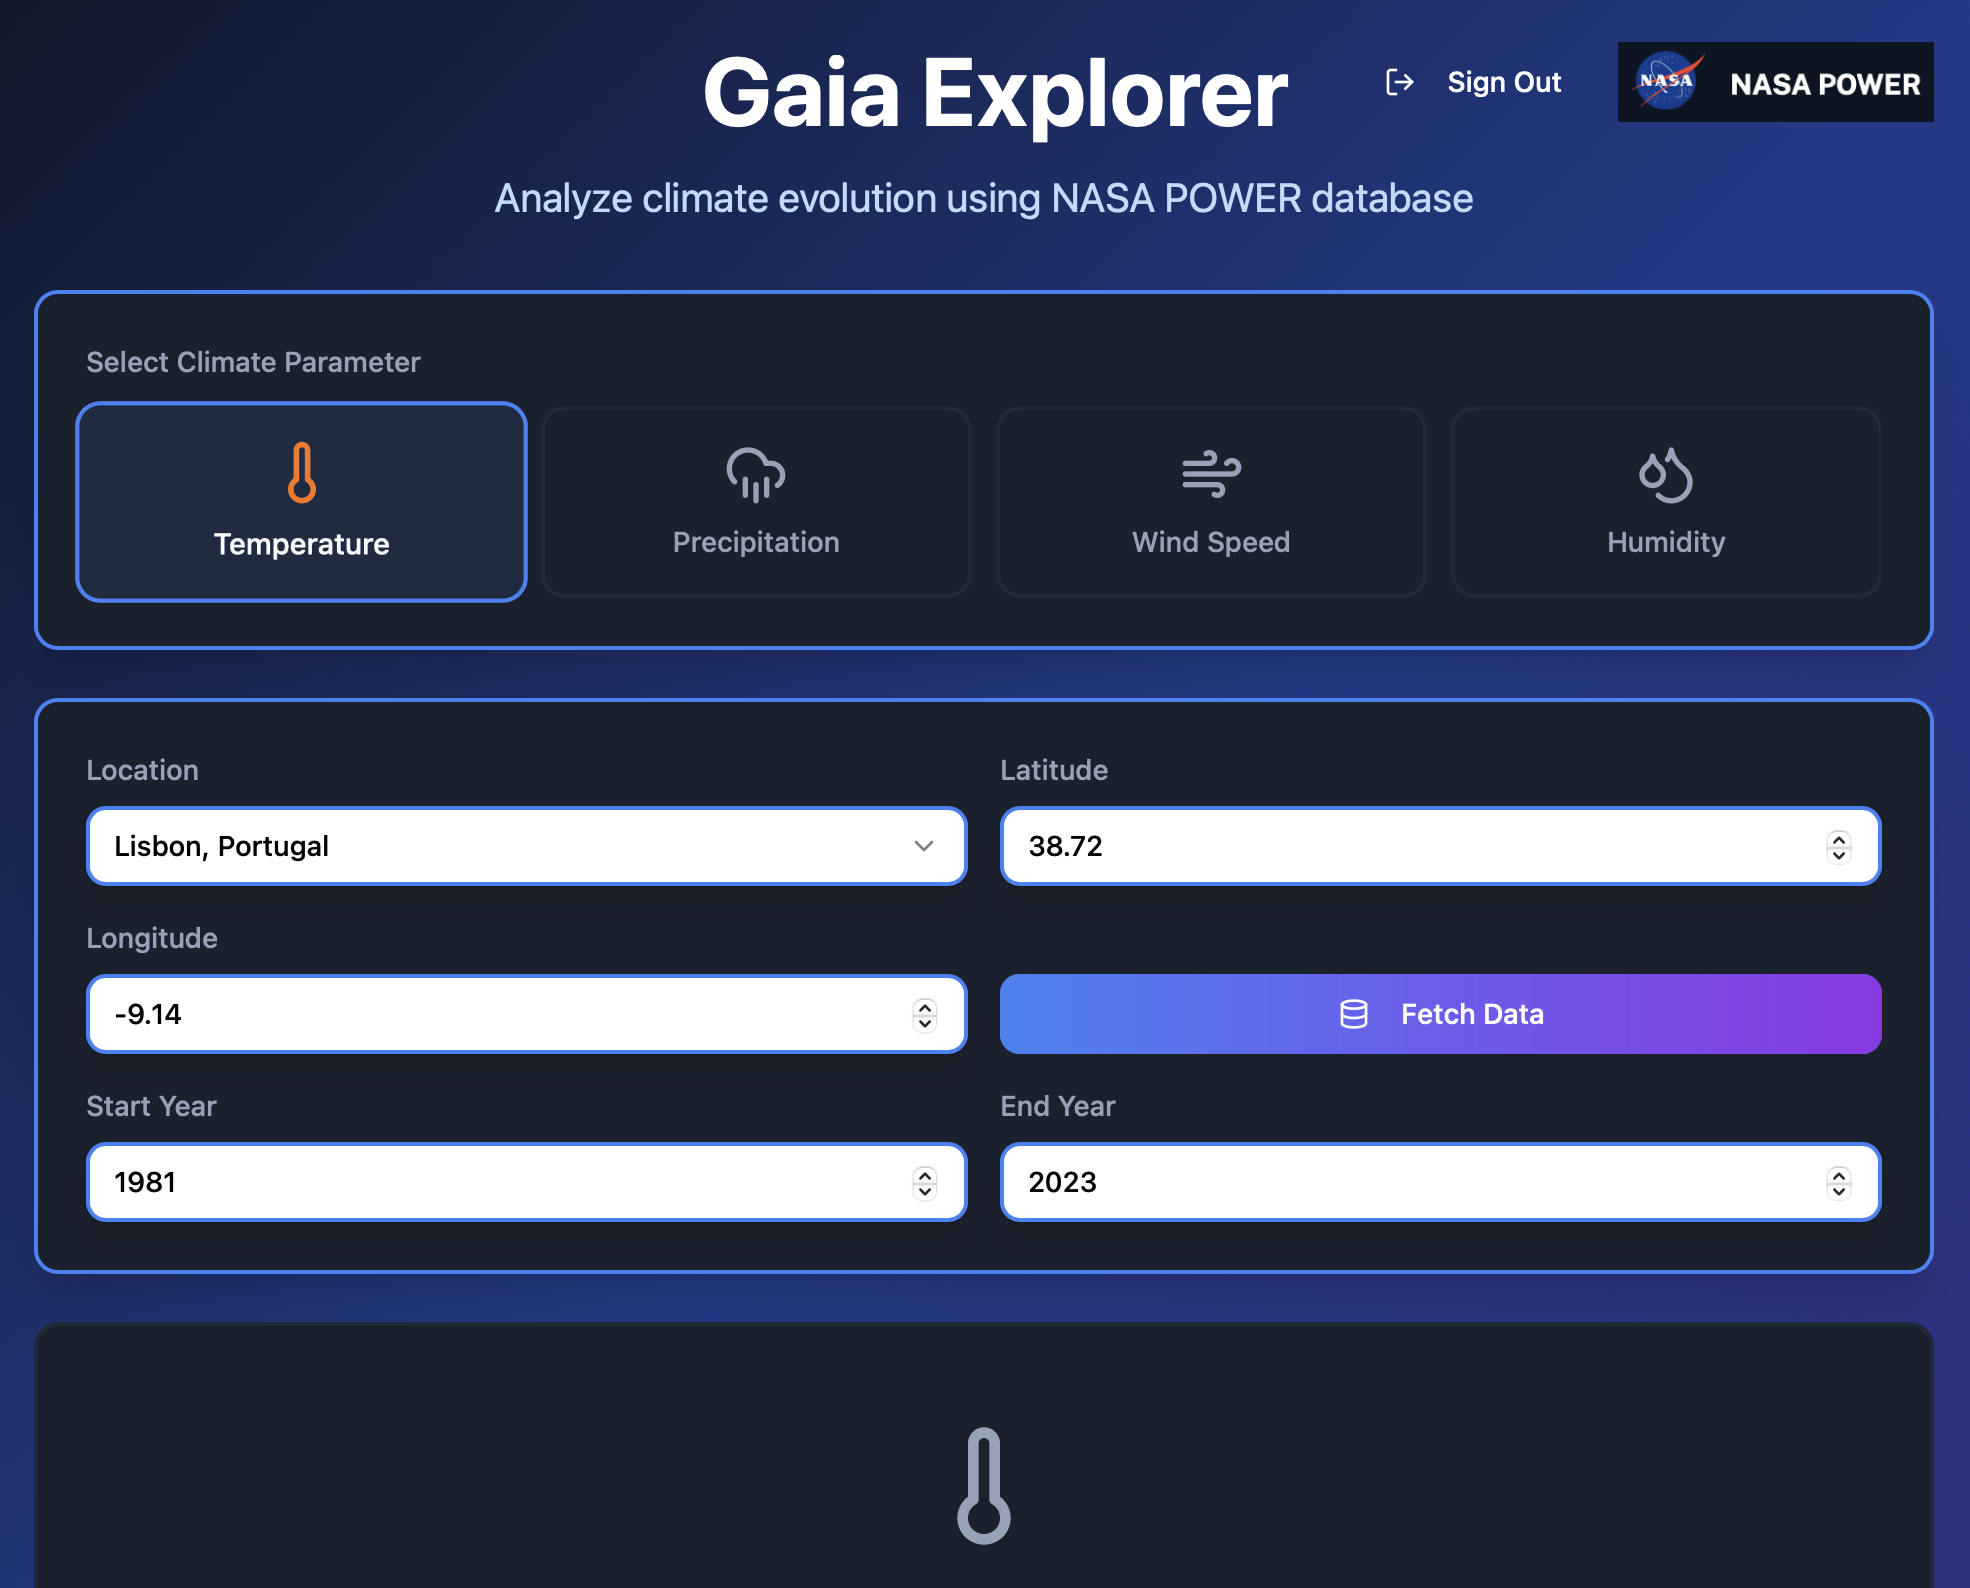
First action in the website: what city and what parameter?
-
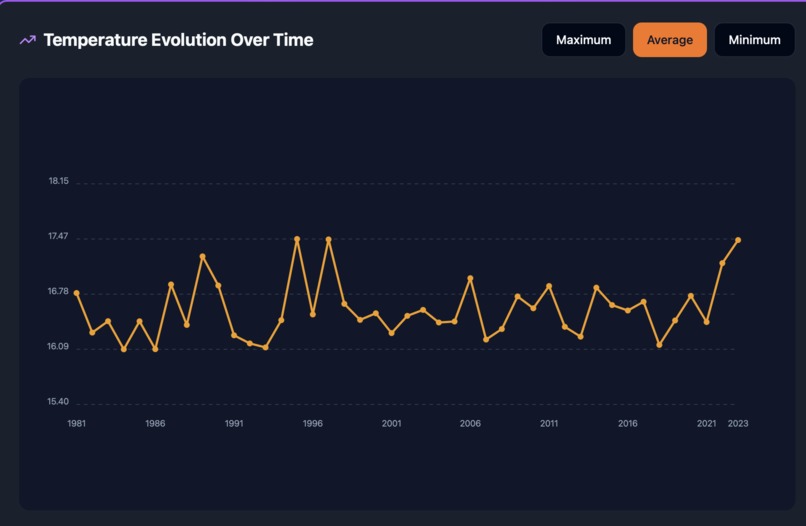
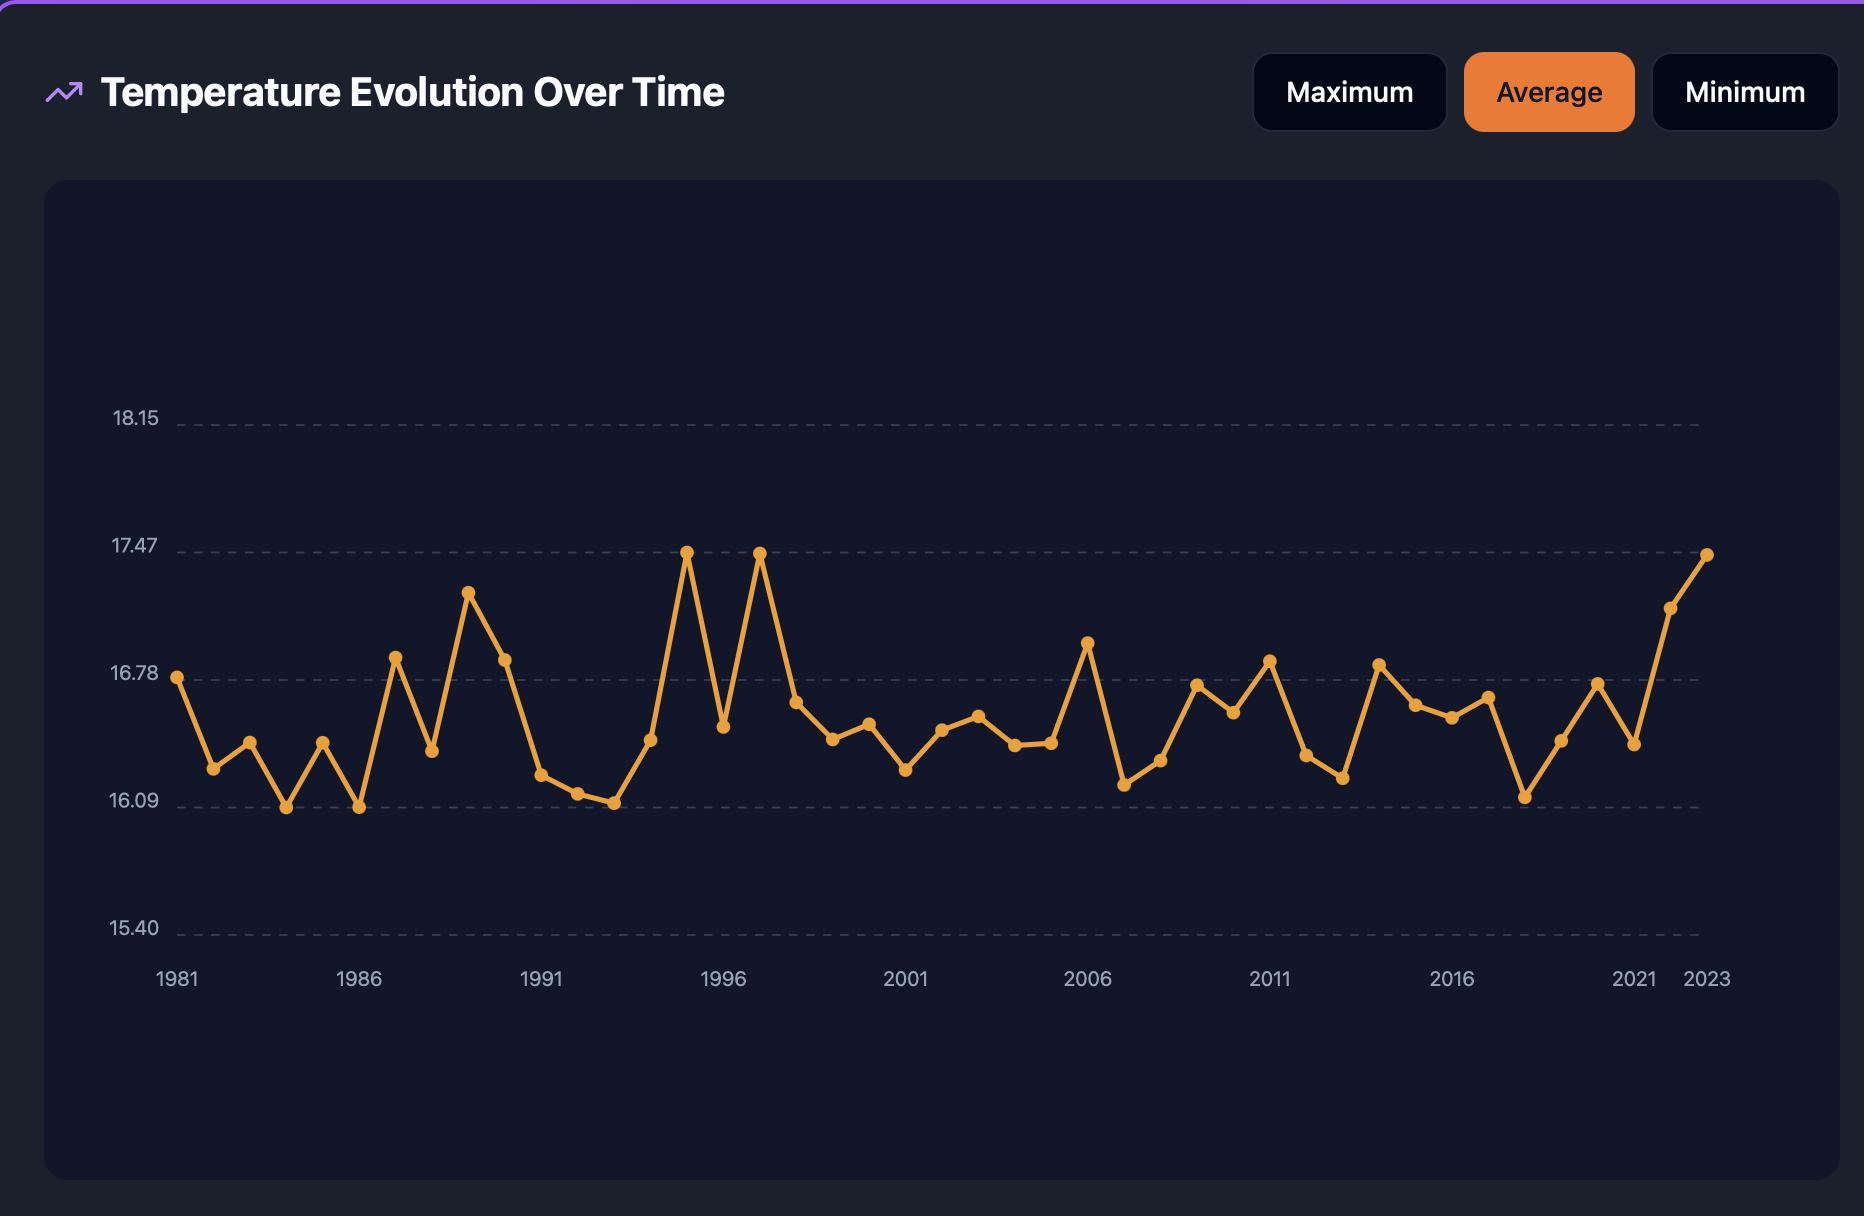
Sample graph output: visualising immediately the problem
-
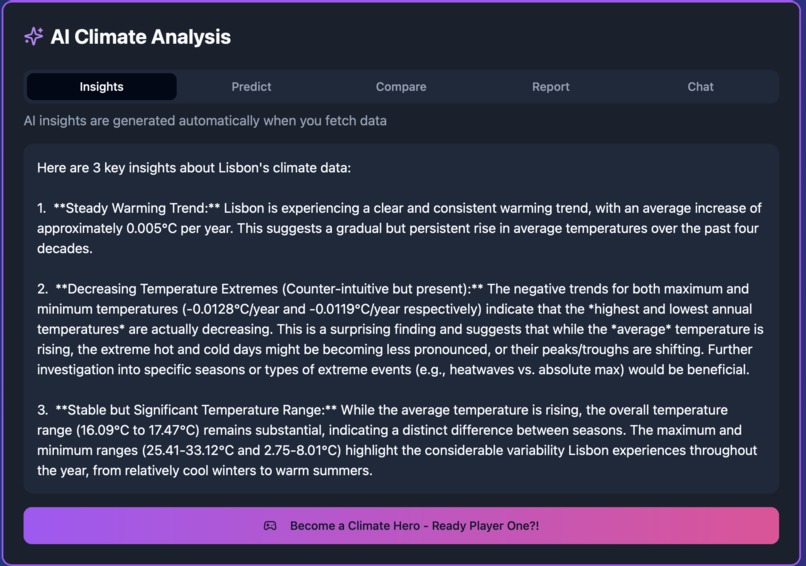
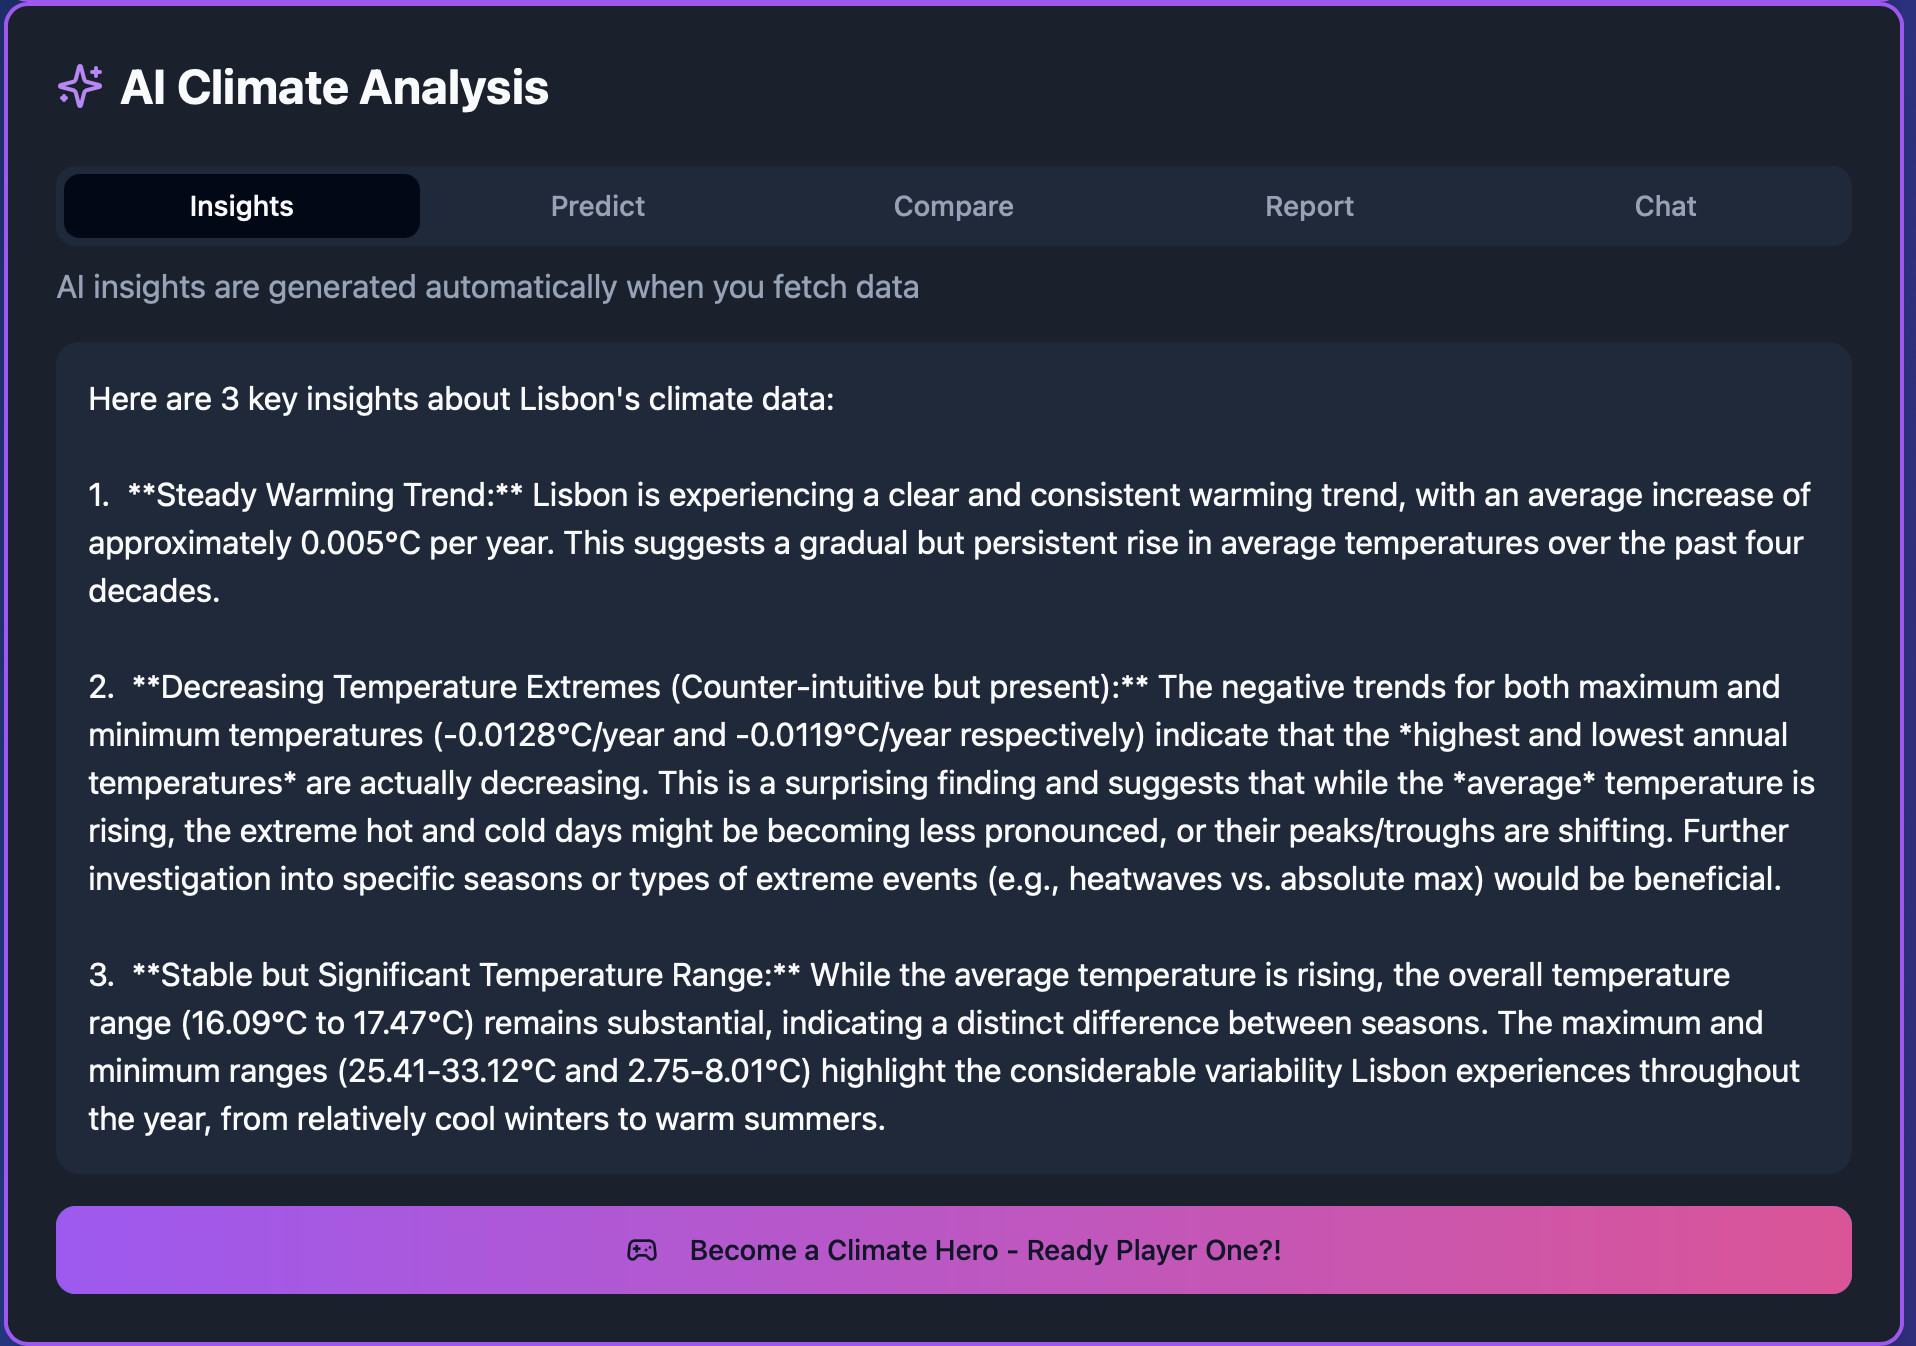
Insights: explaining the problem, and suggesting a gamified 'call to action'
-
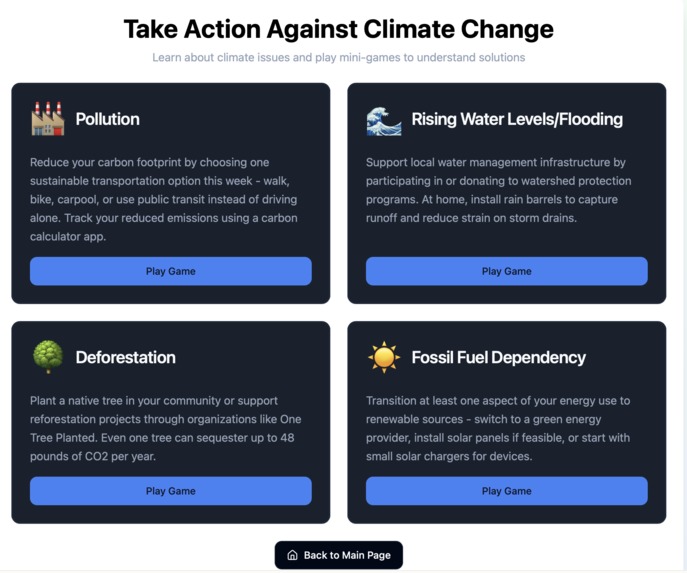
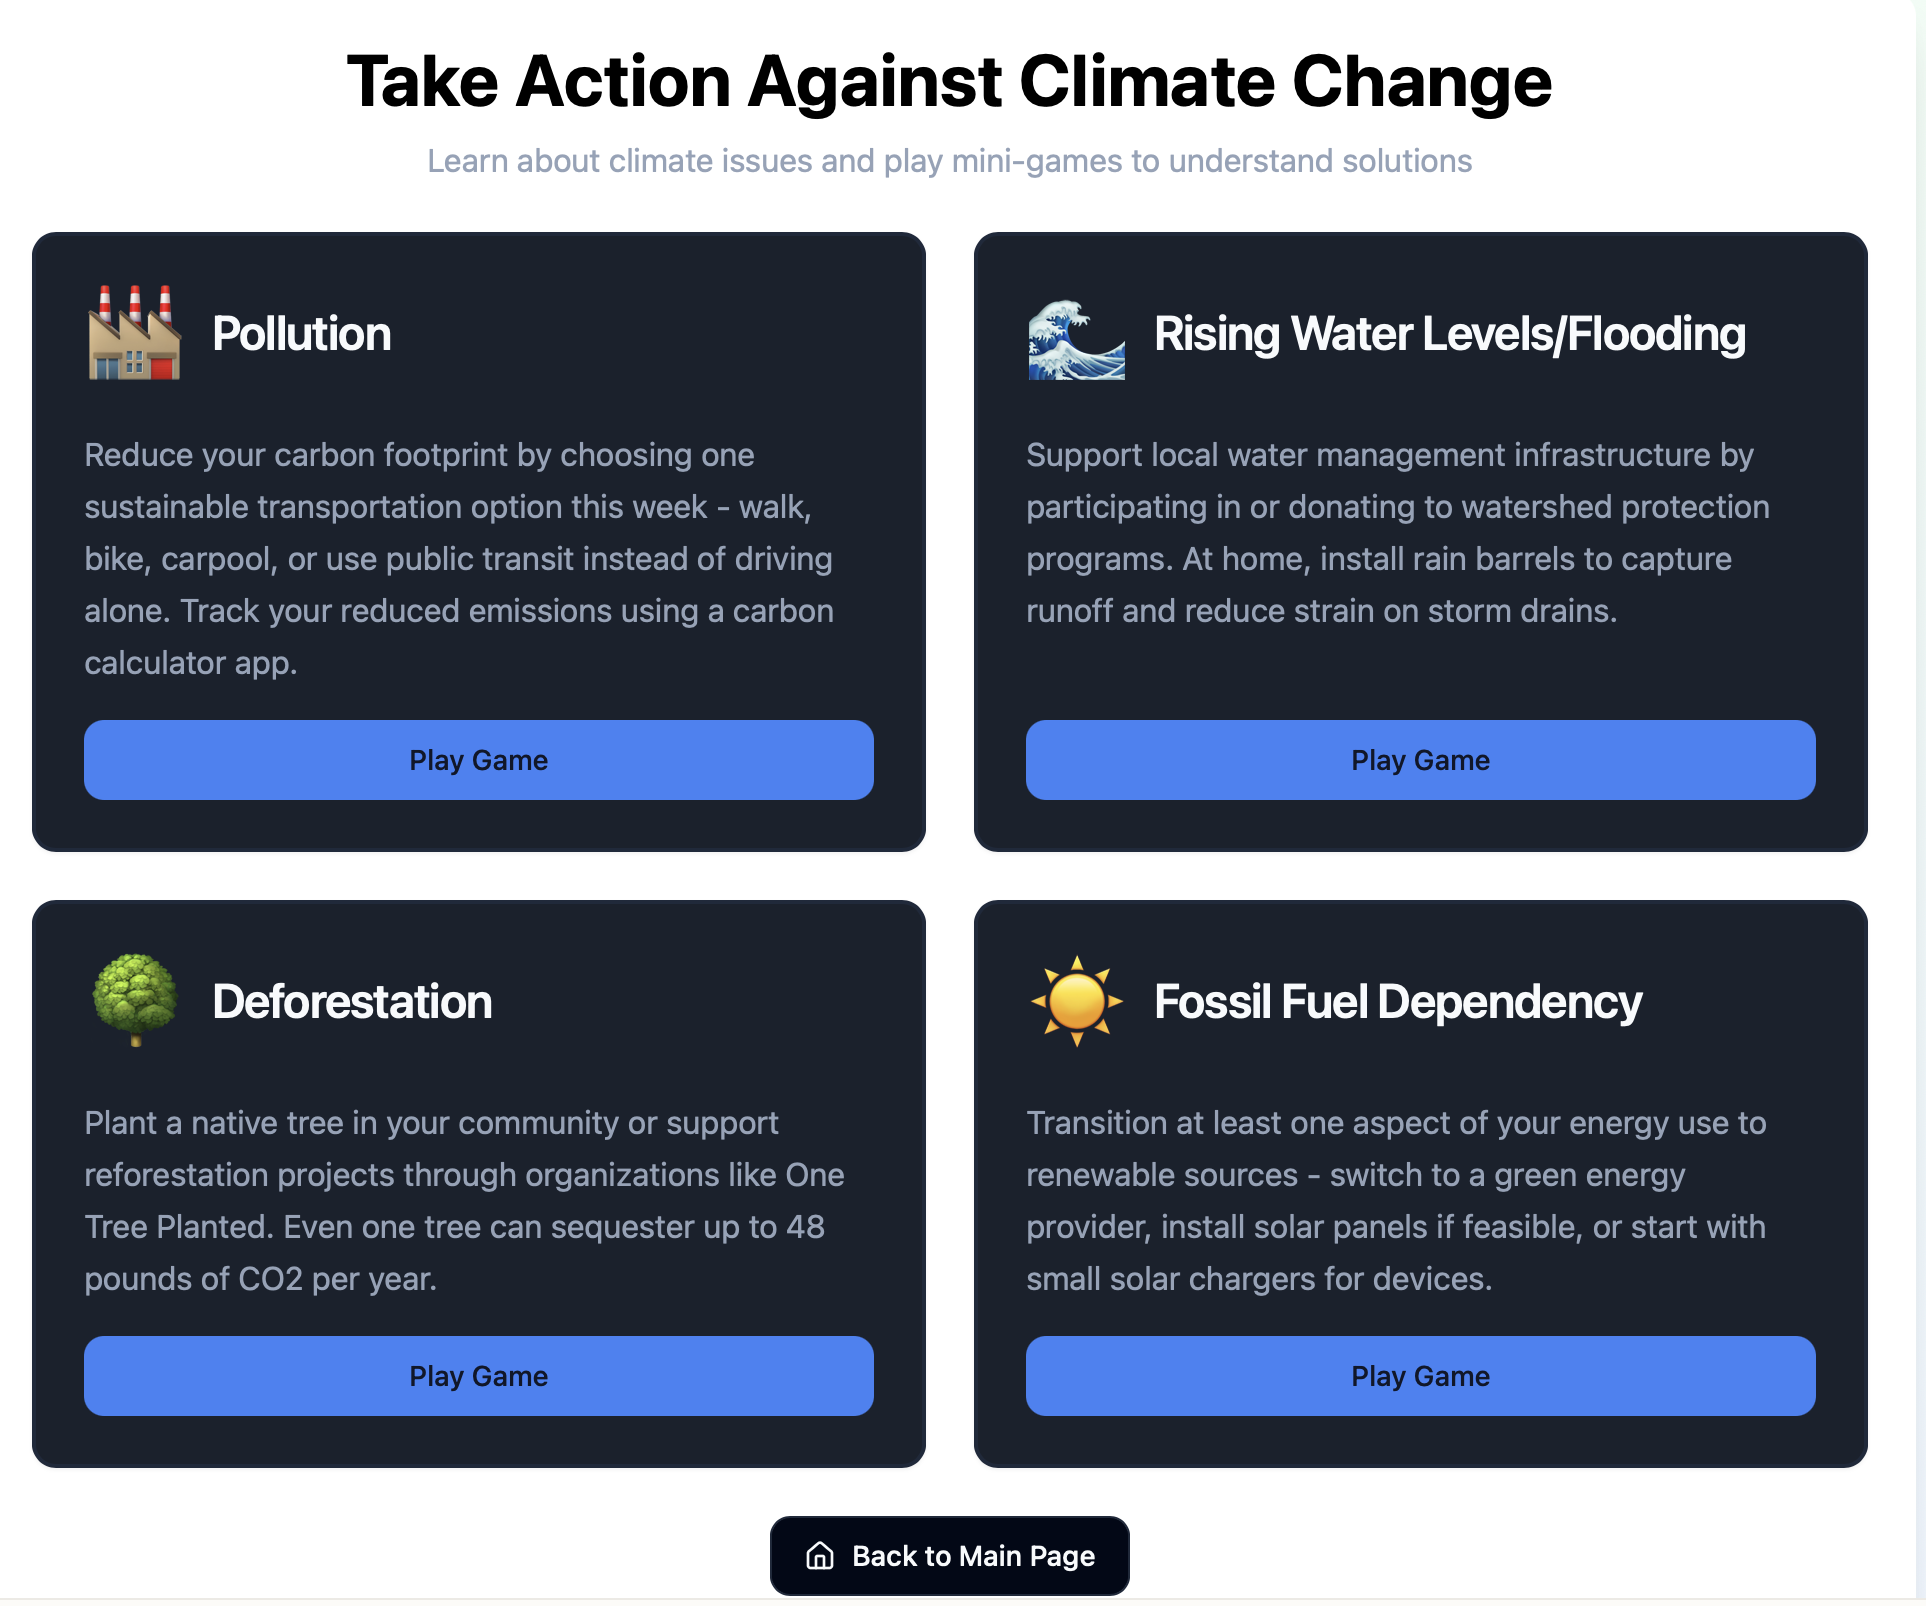
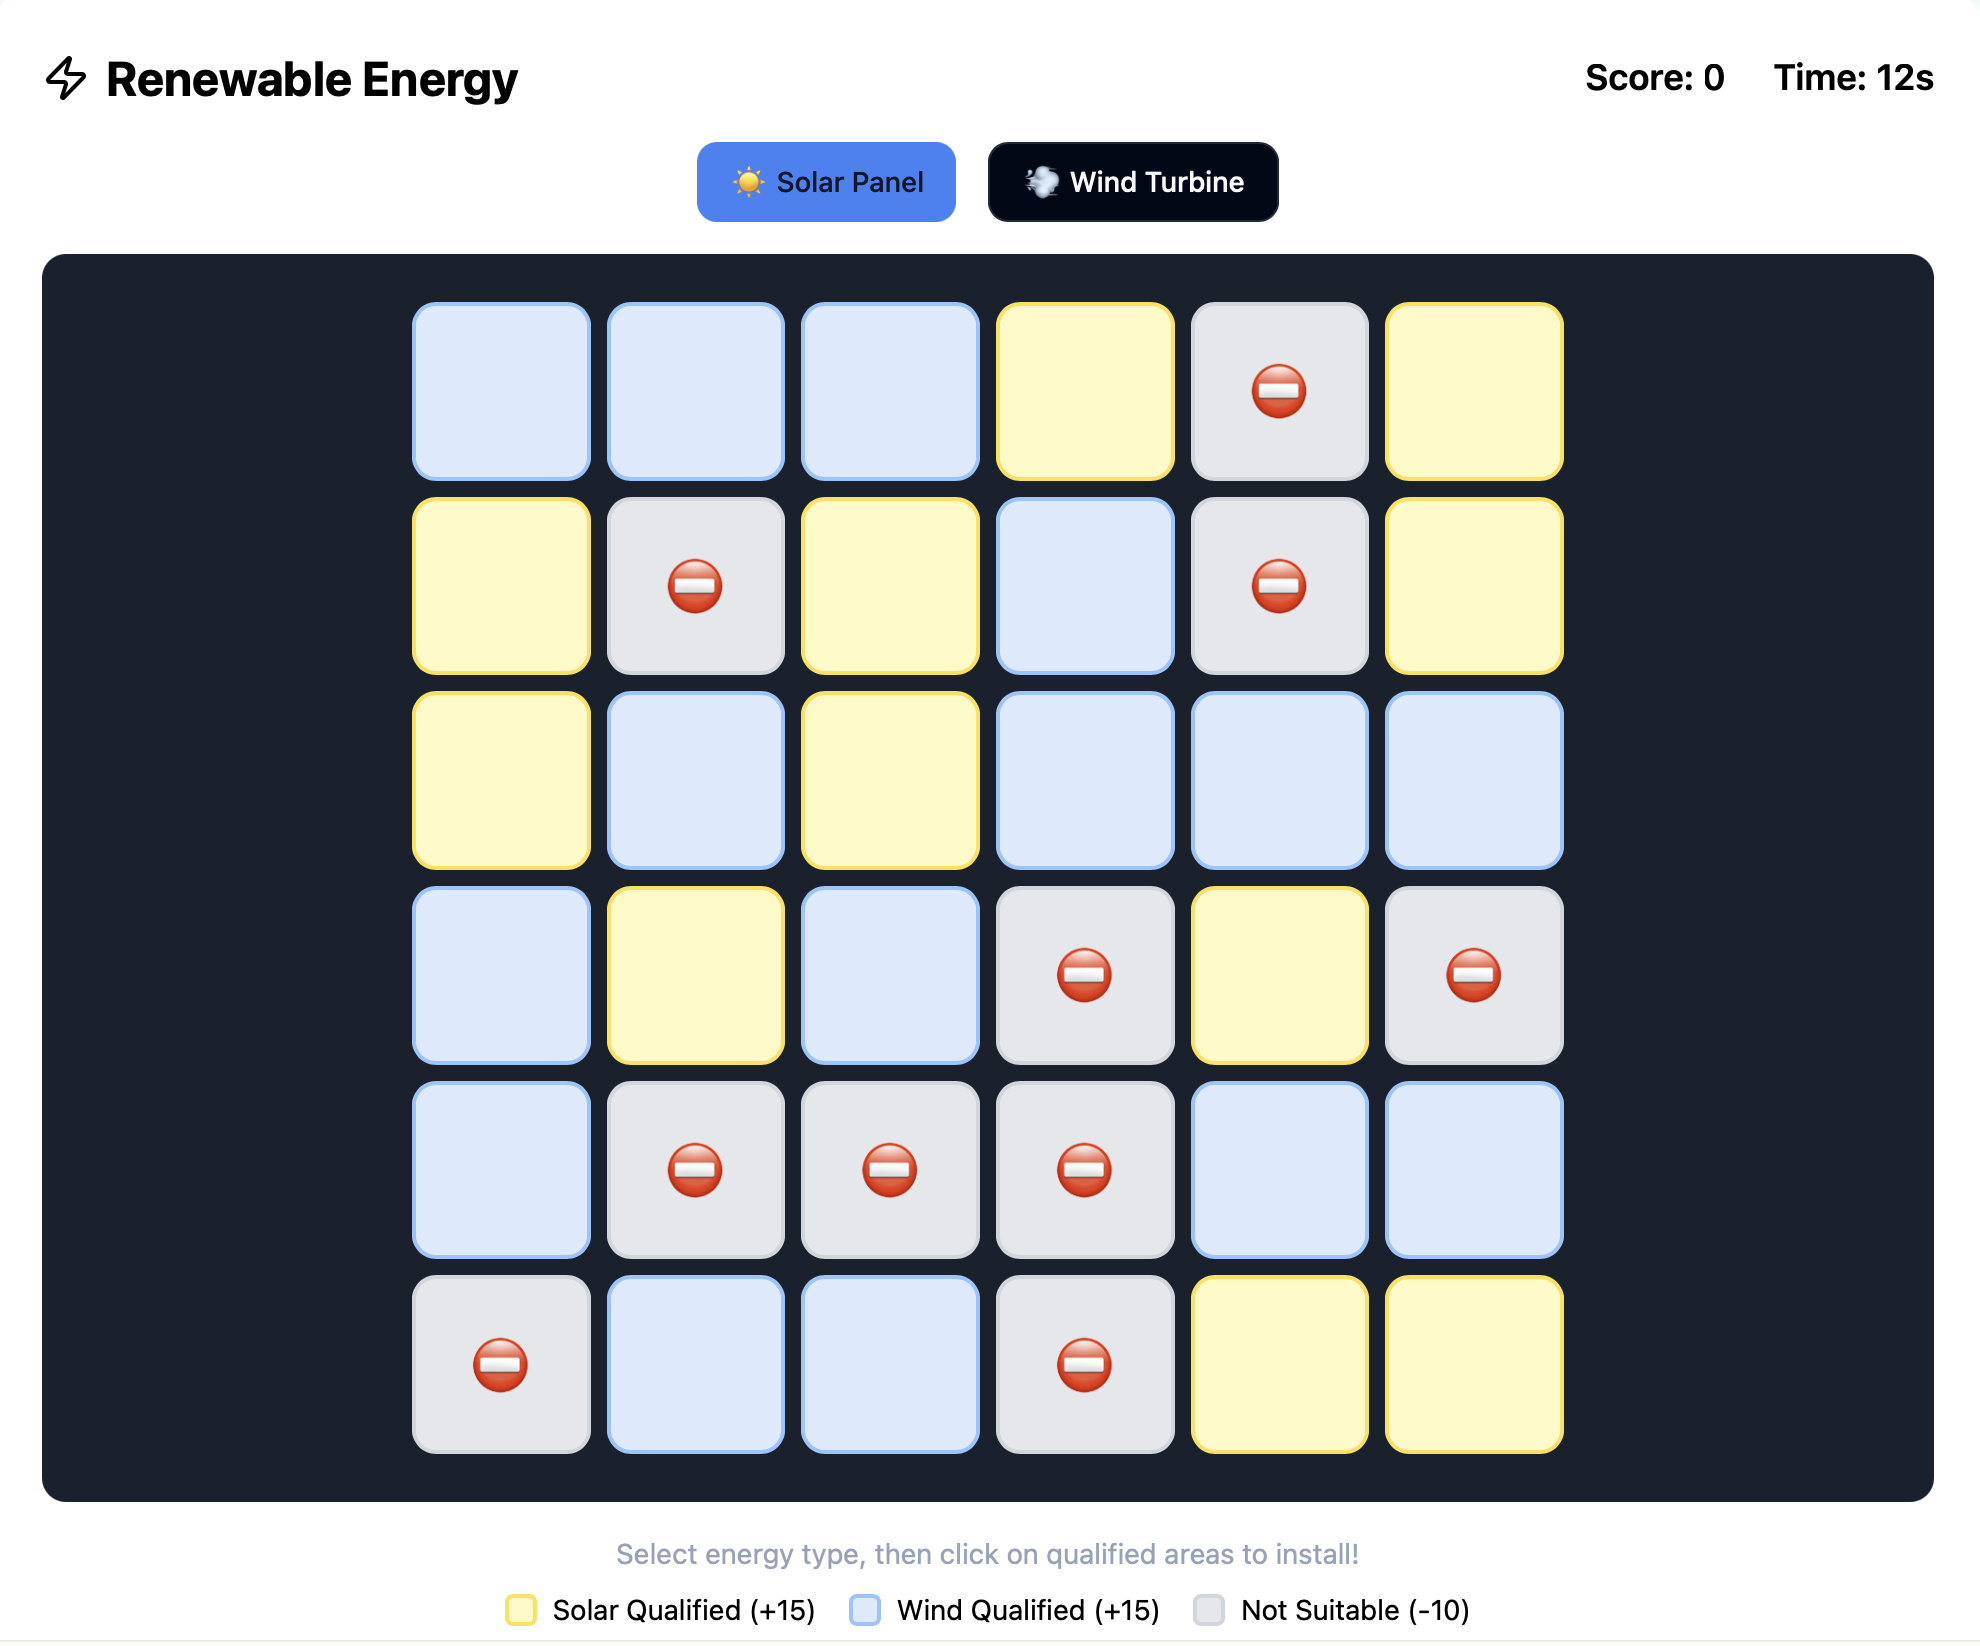
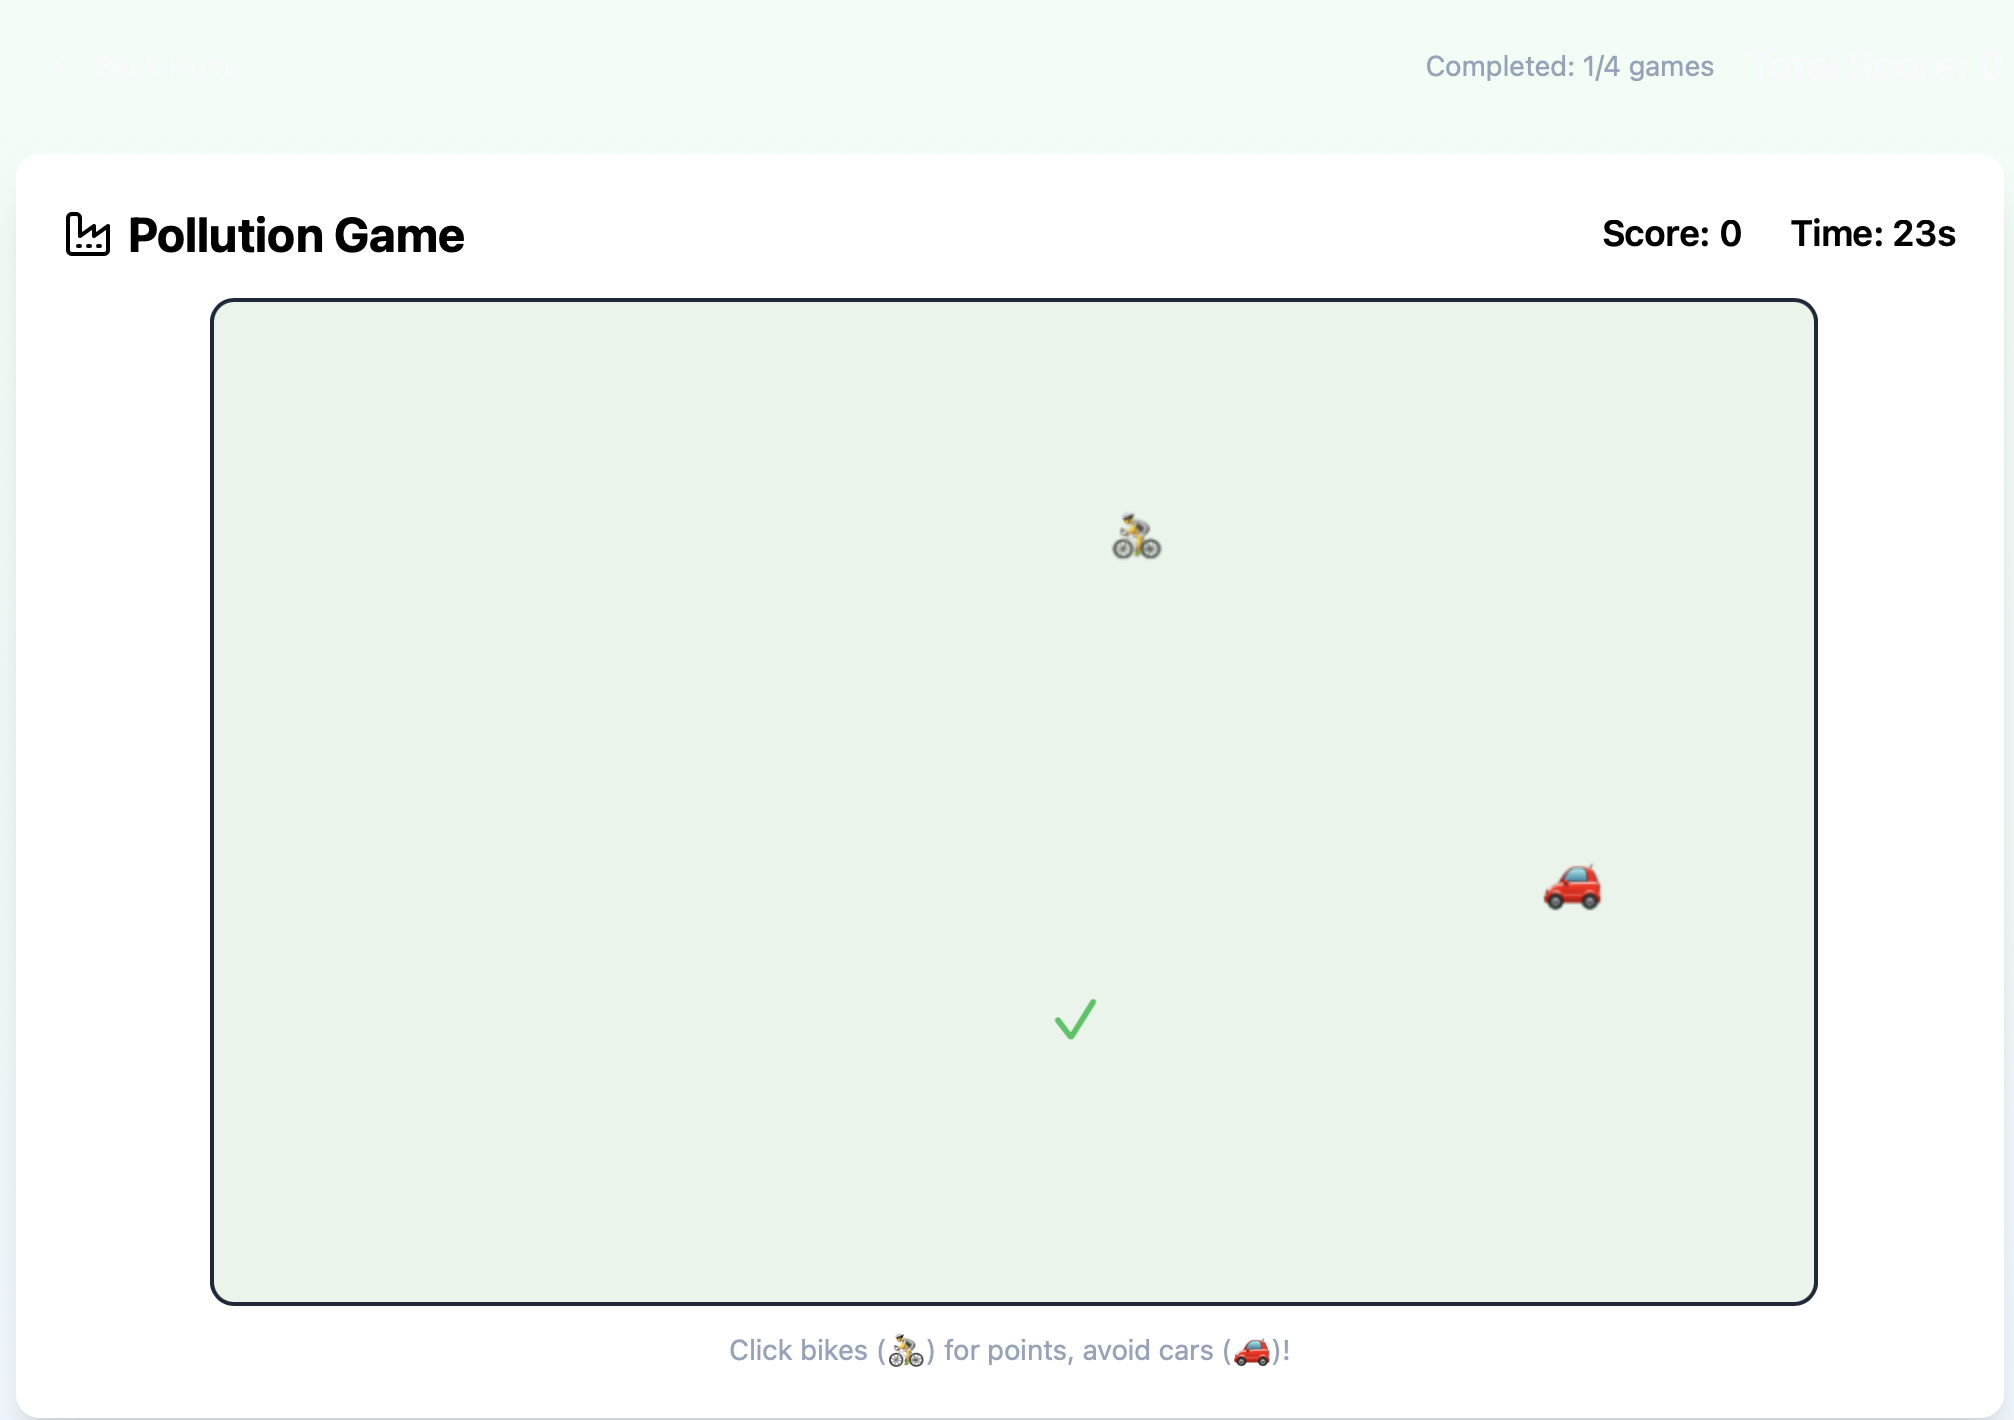
Four games to make the solutions more tangible
-
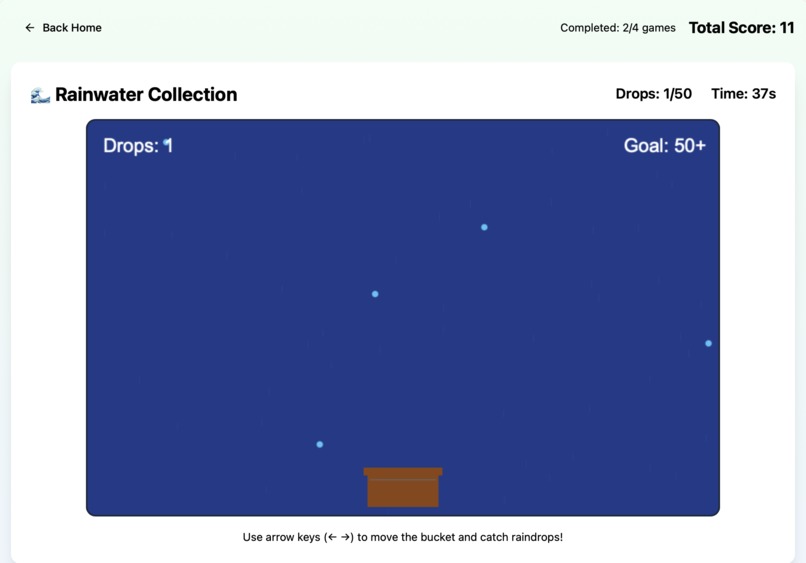
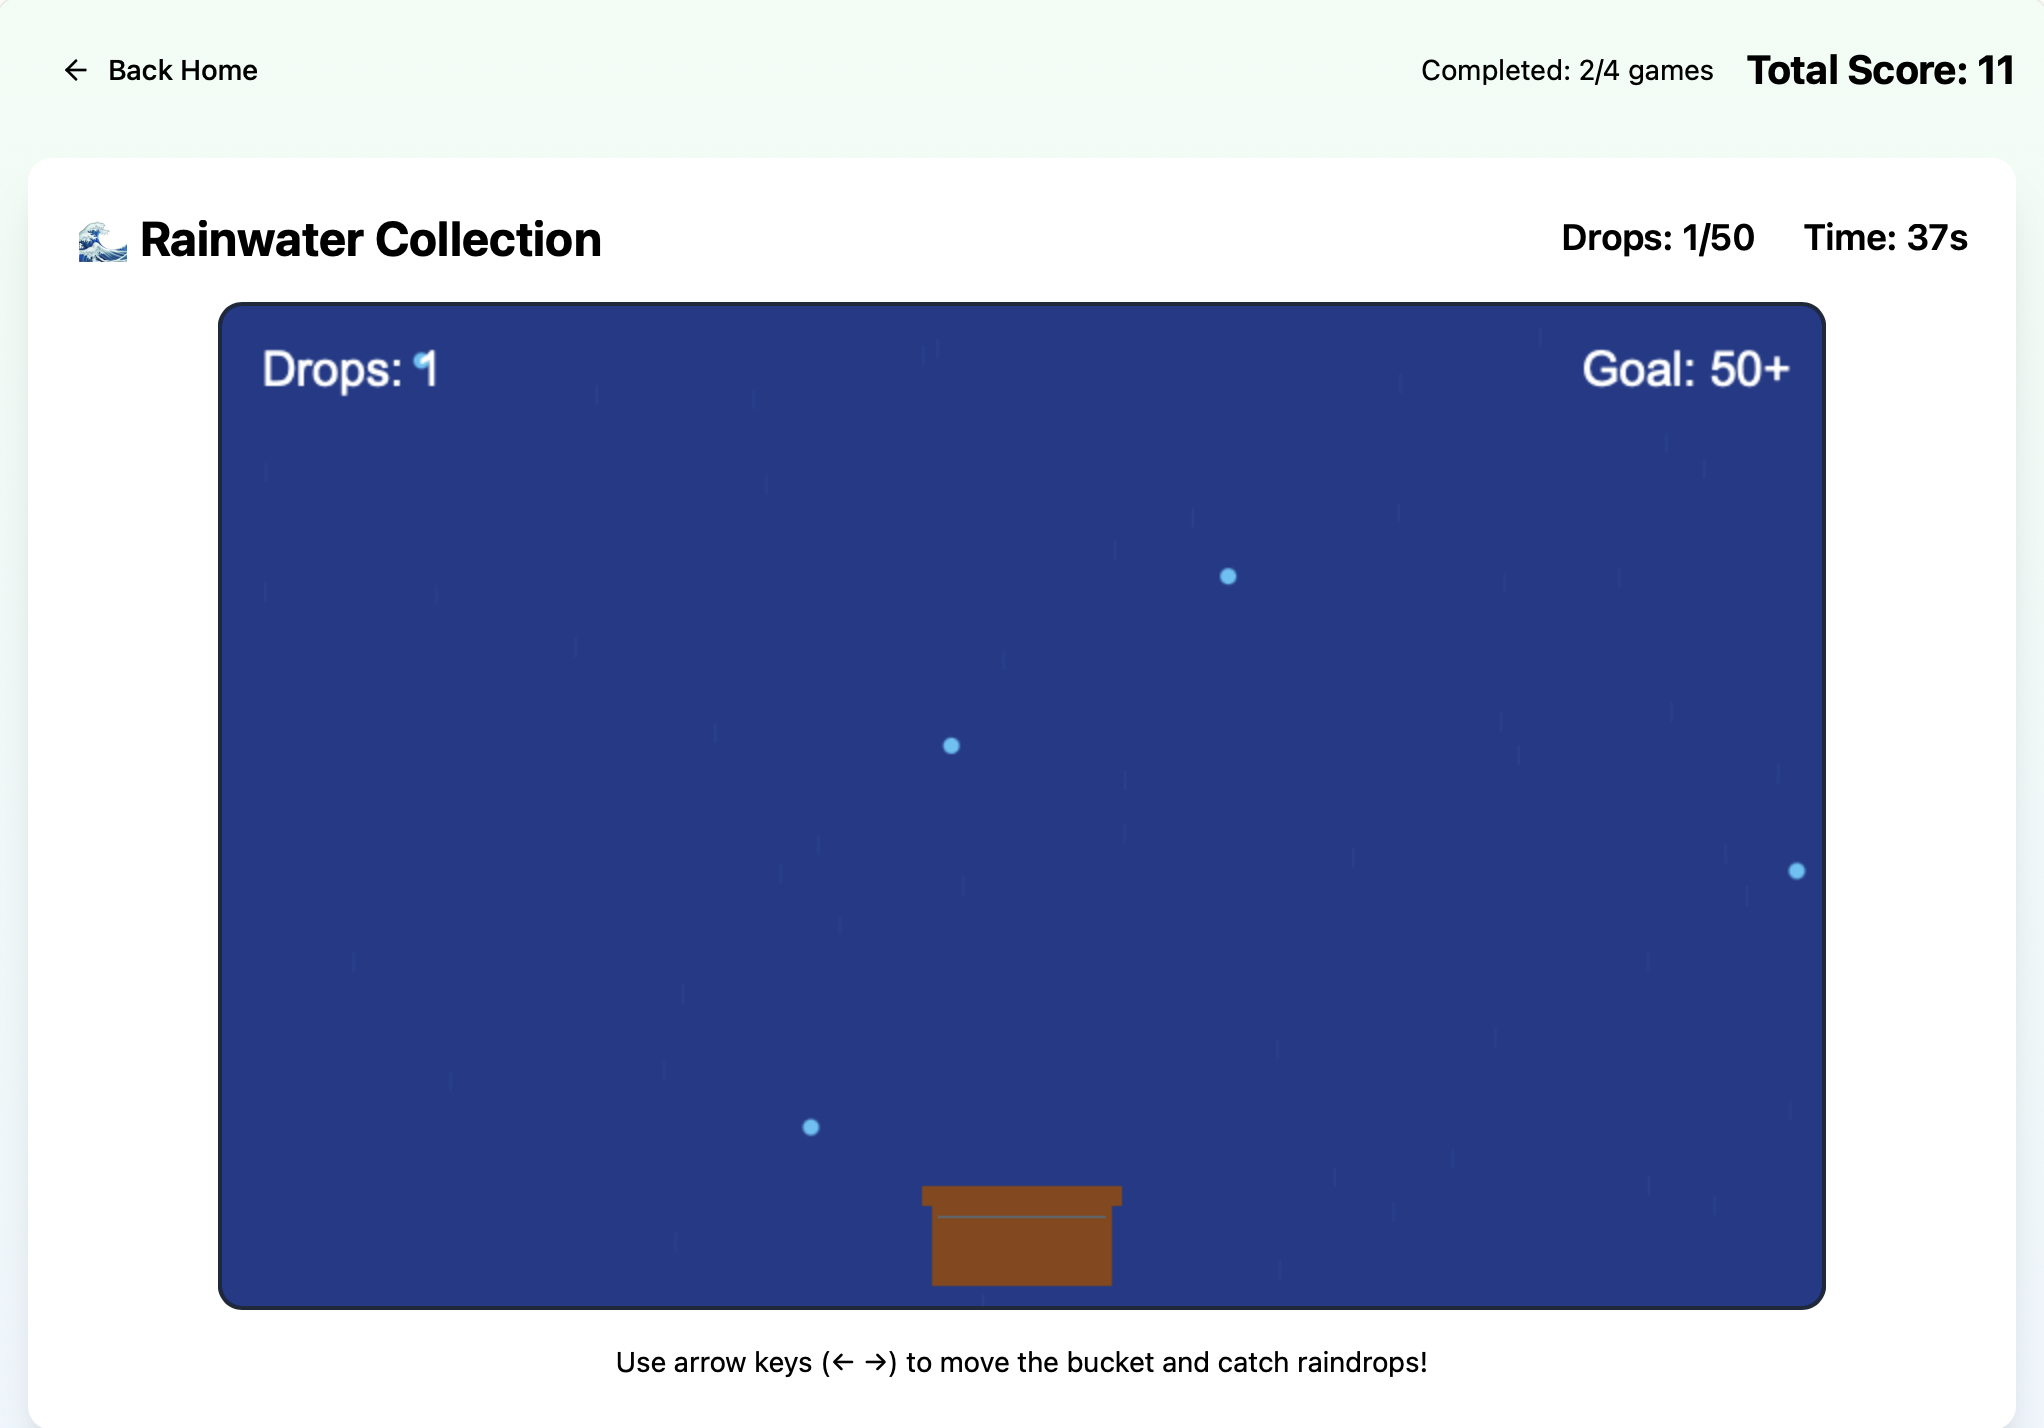
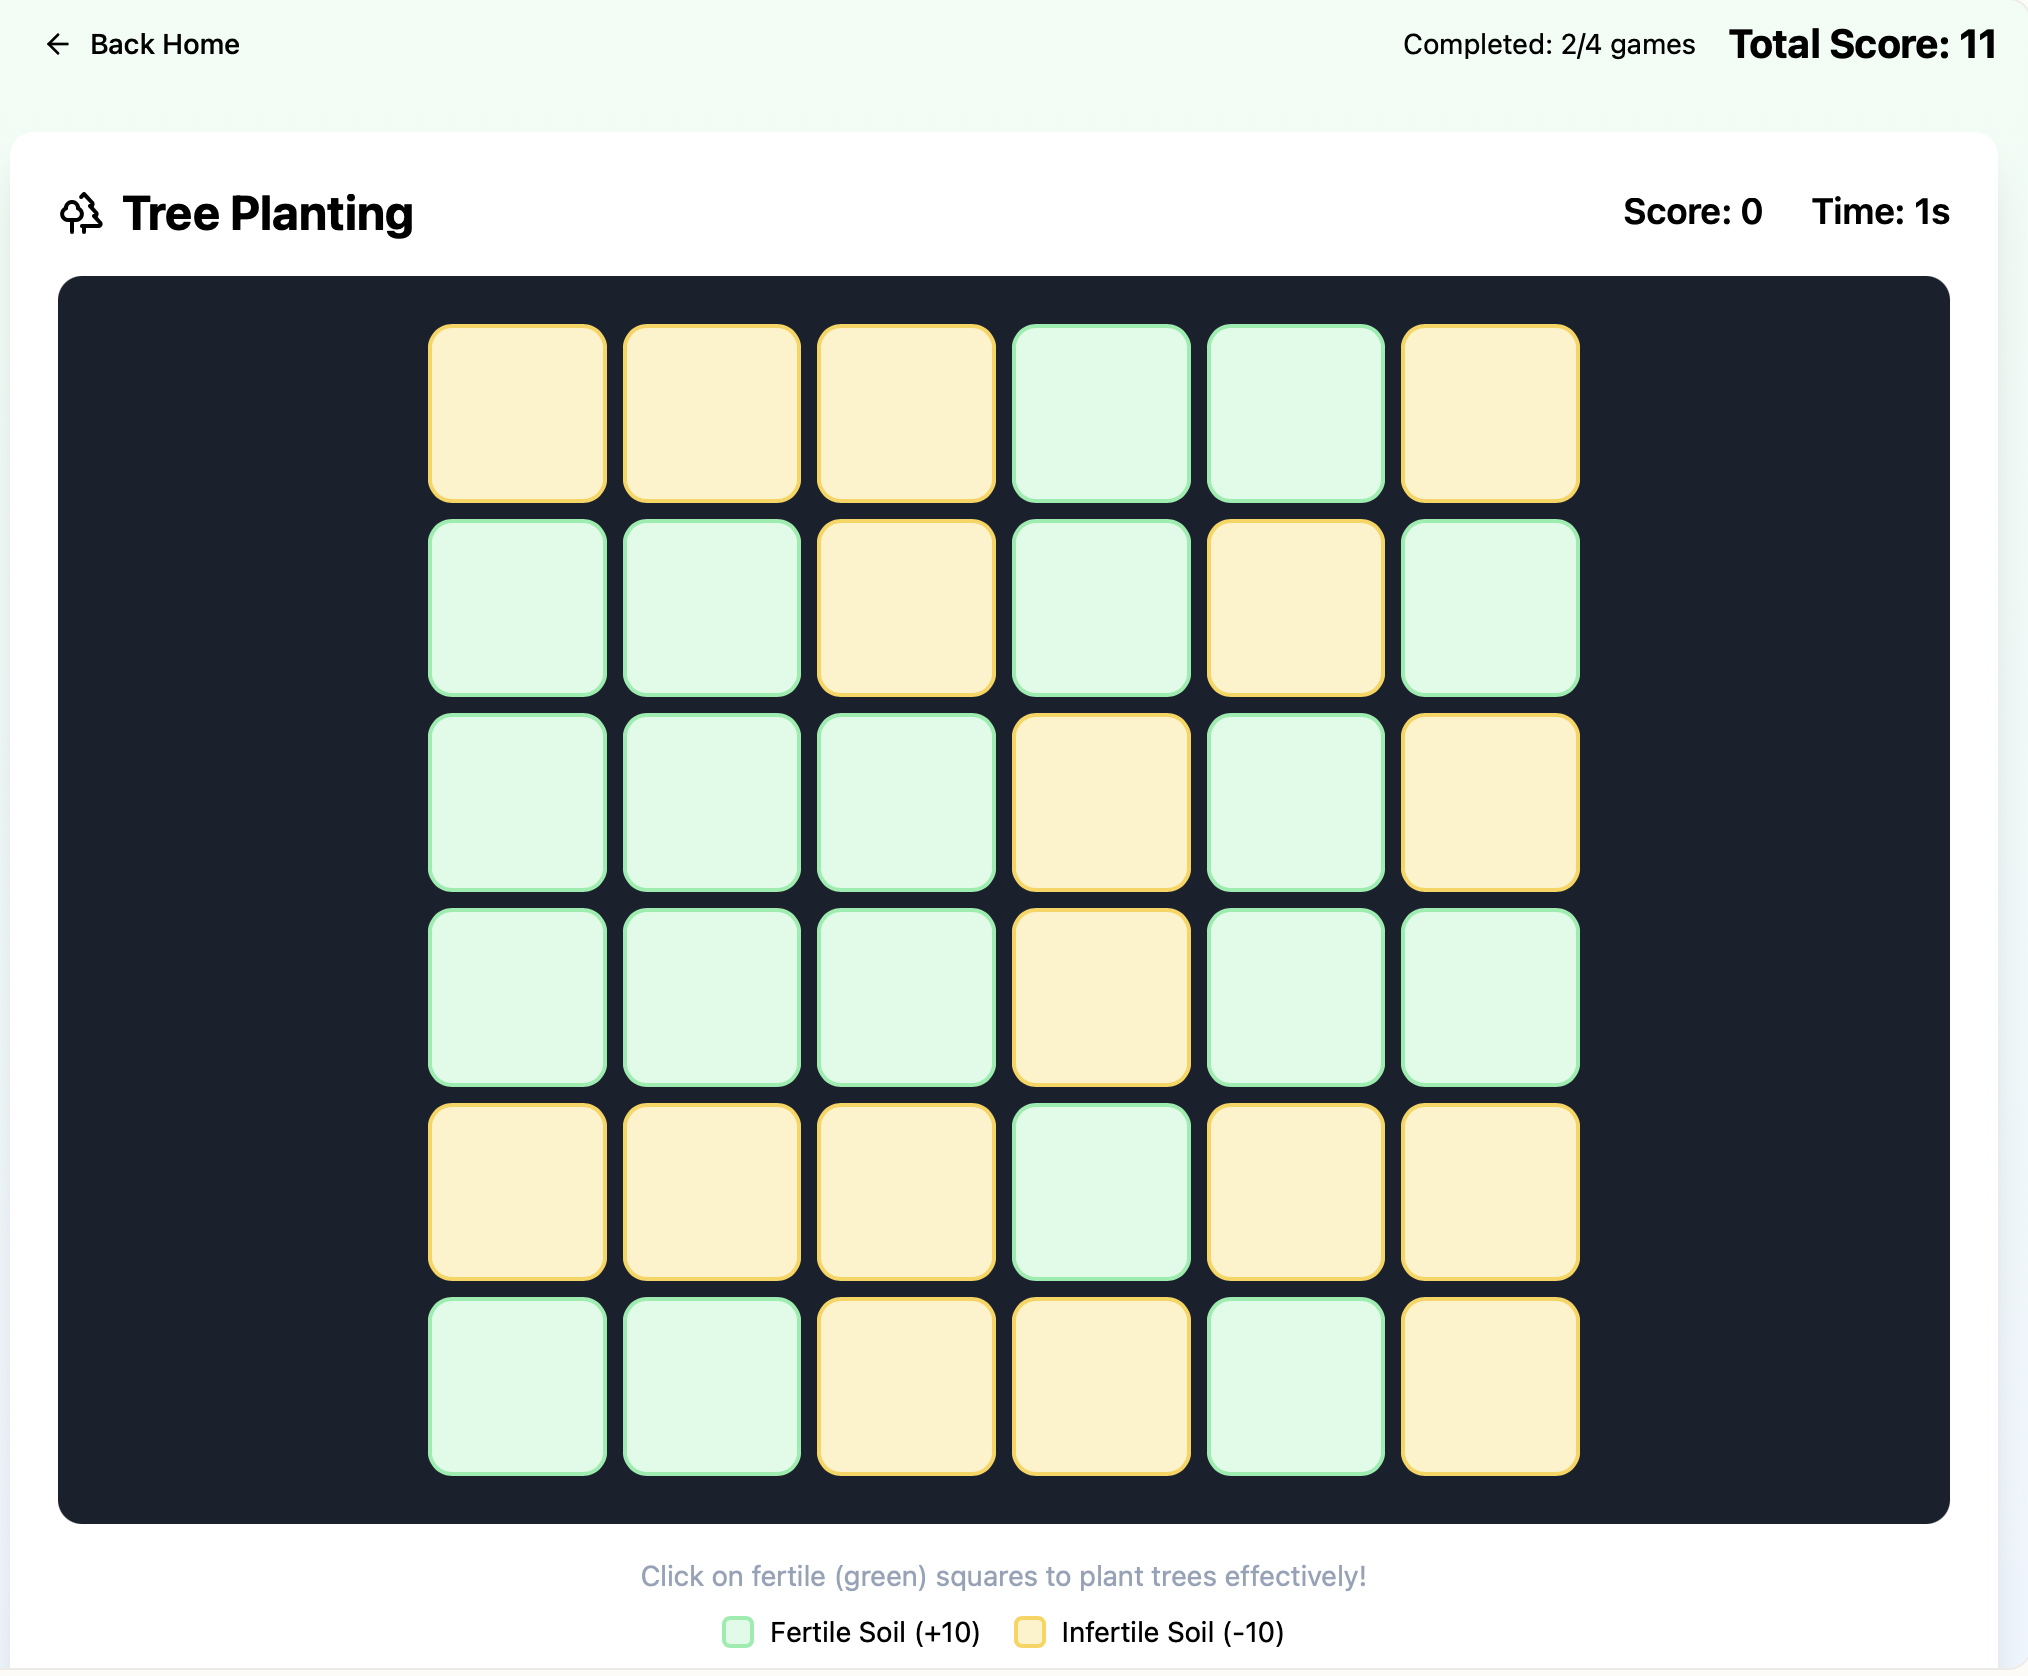
Game 1
-
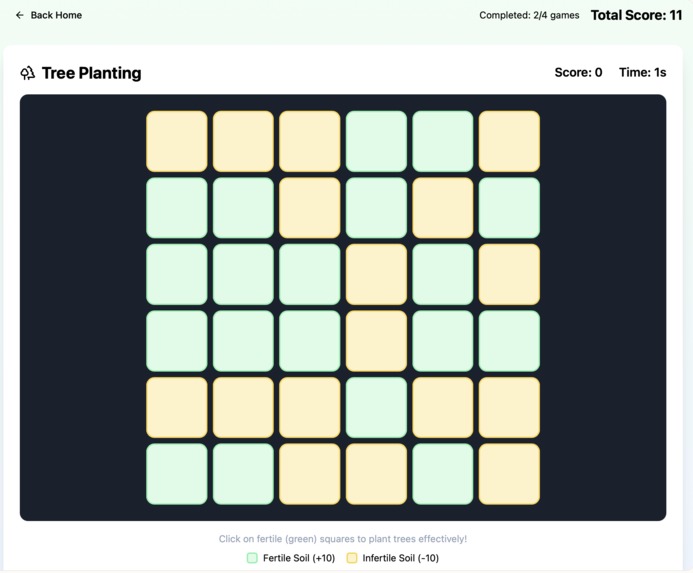
Game 2
-
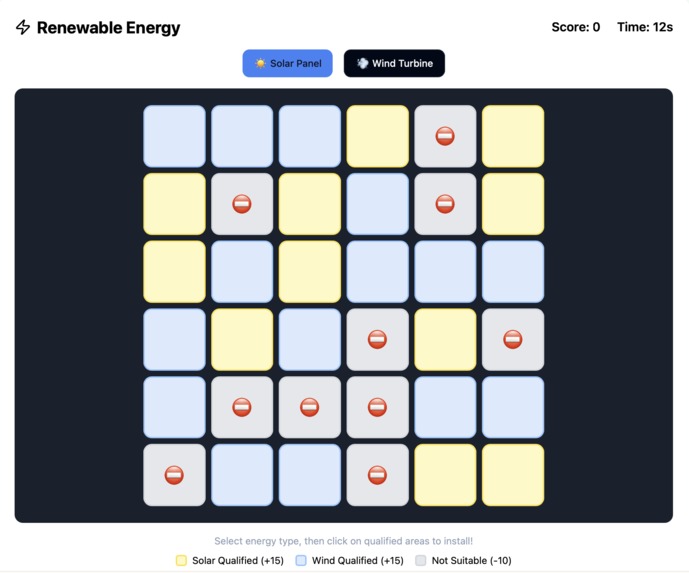
Game 3
-
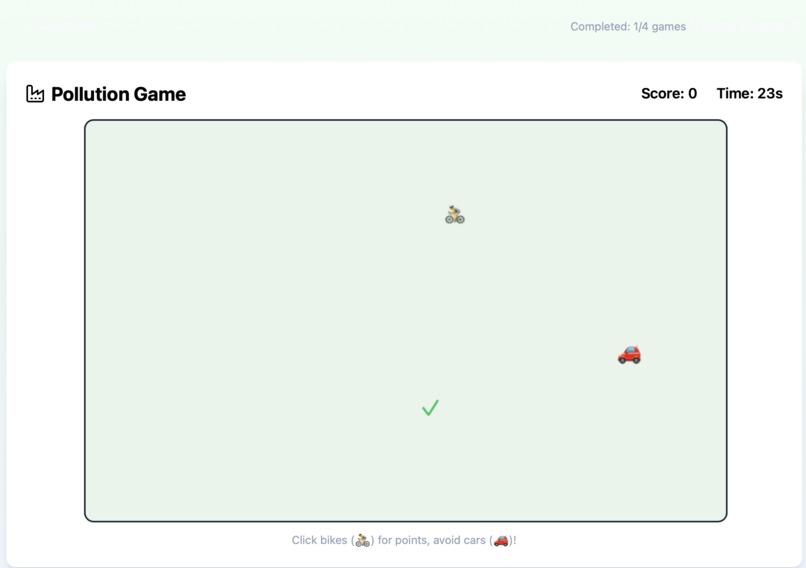
Game 4
-
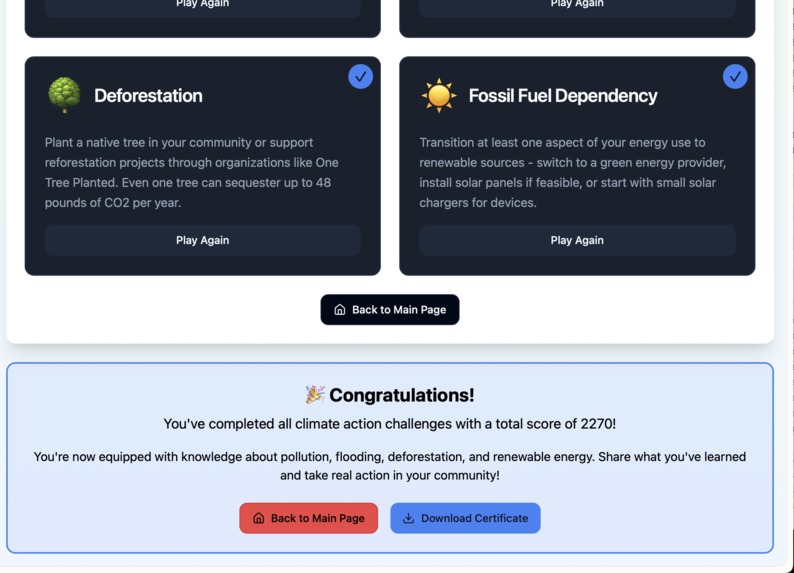
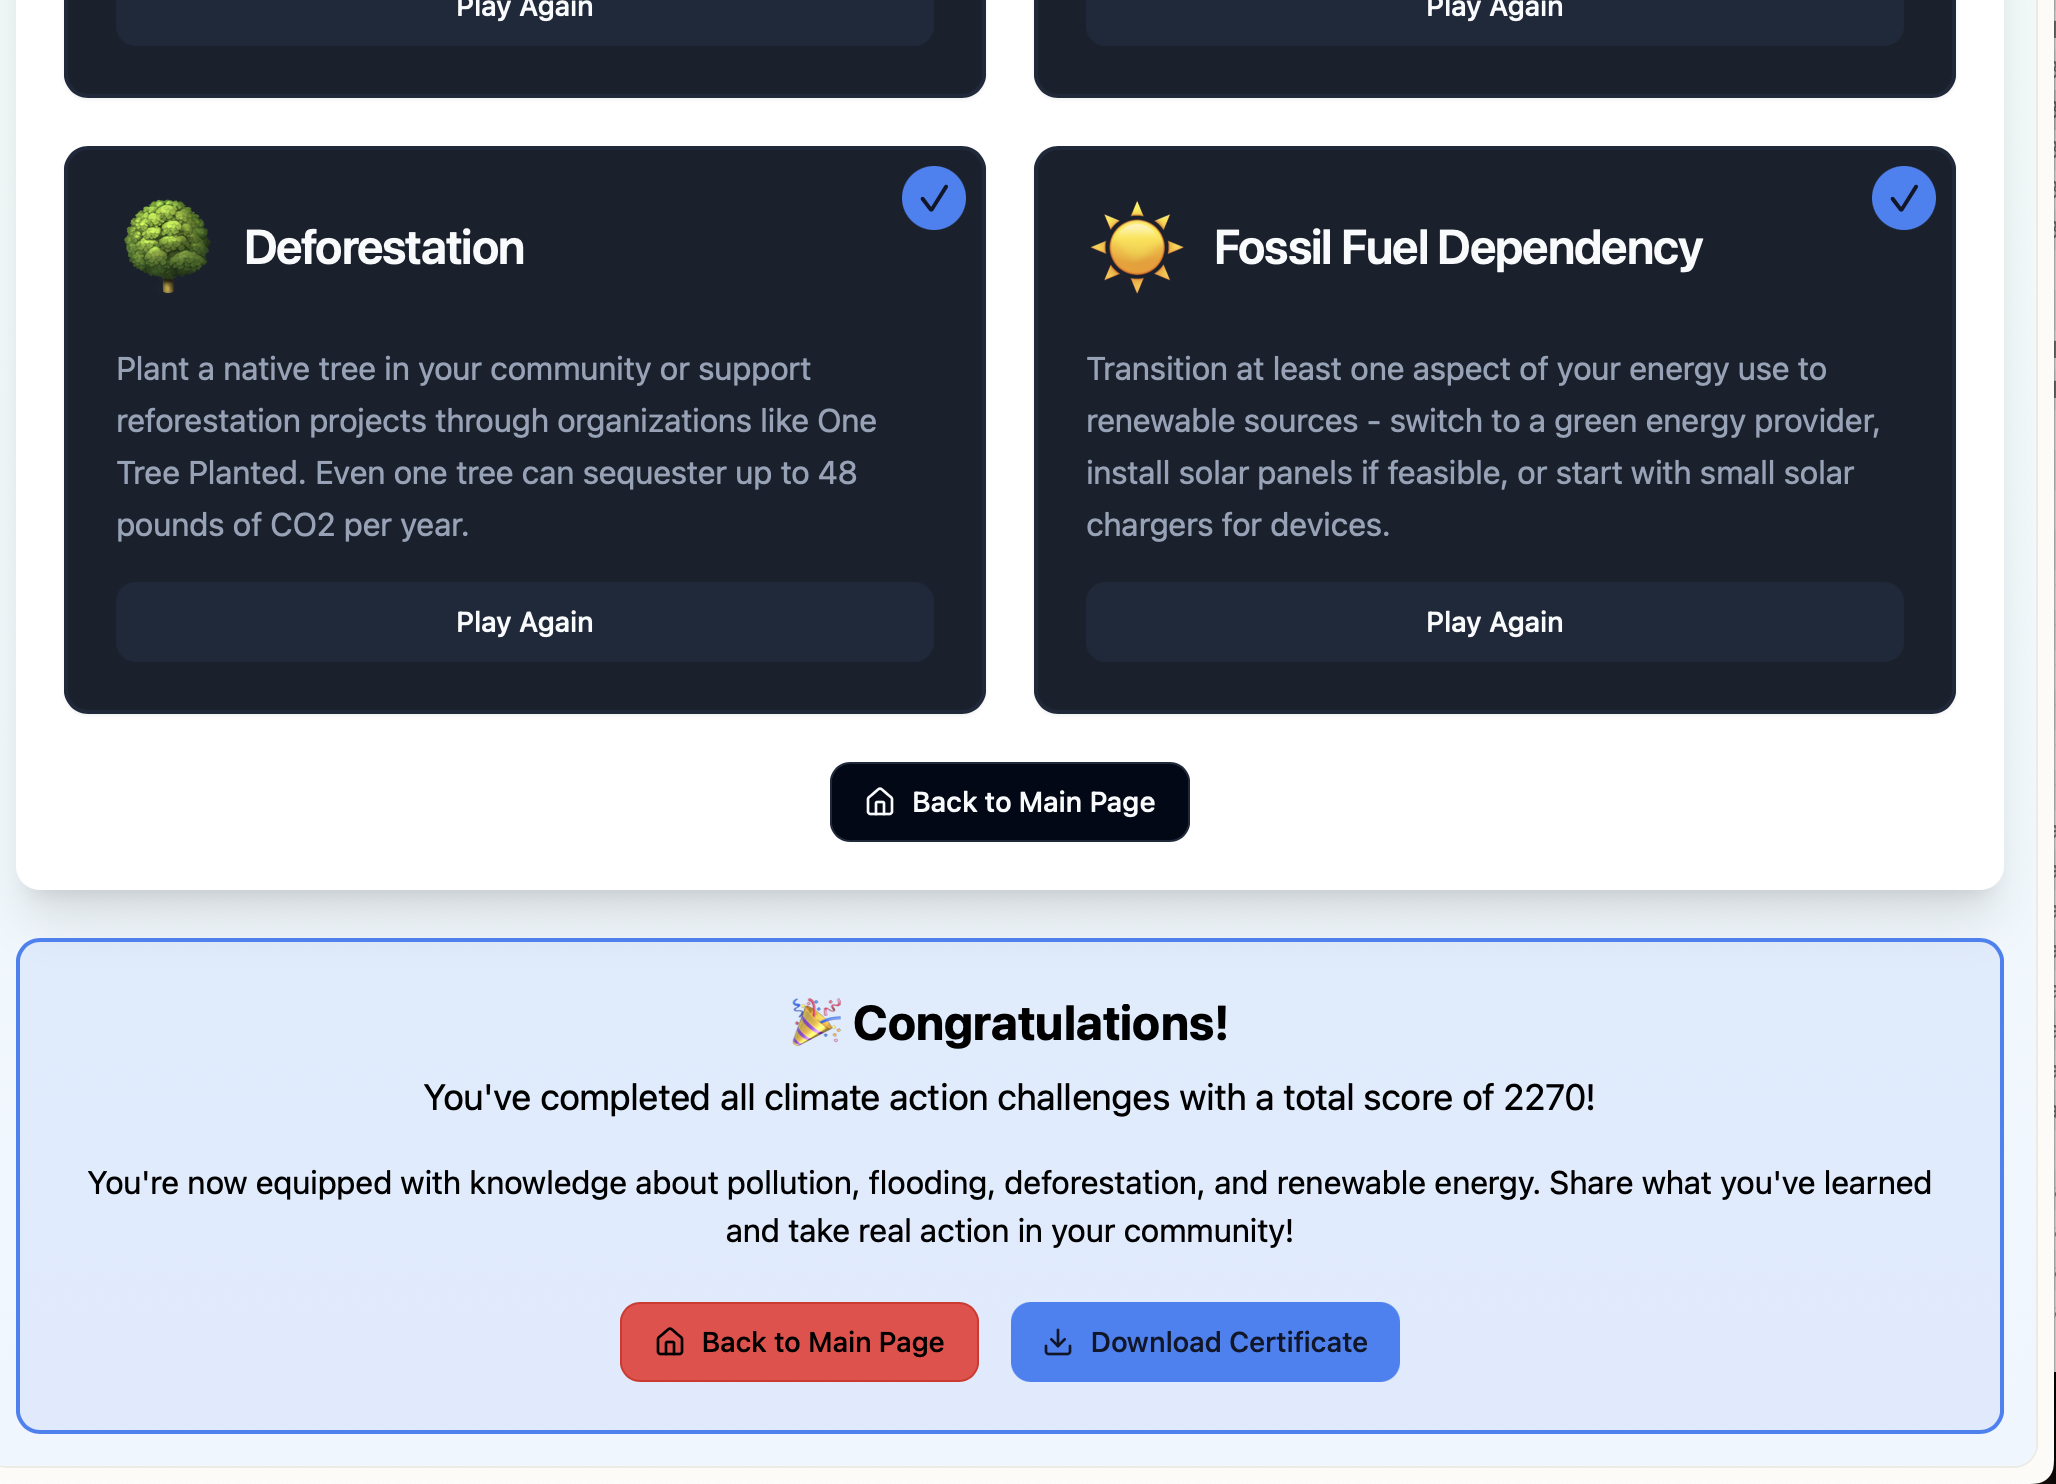
Congratulations page at completion
-
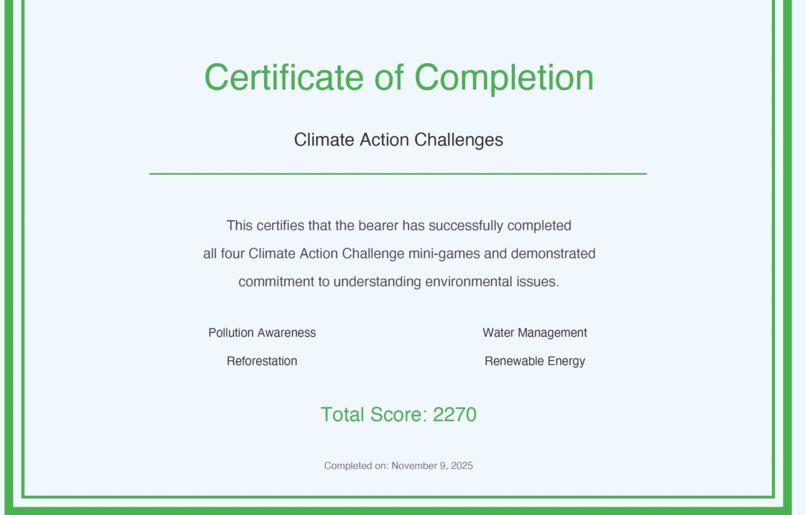
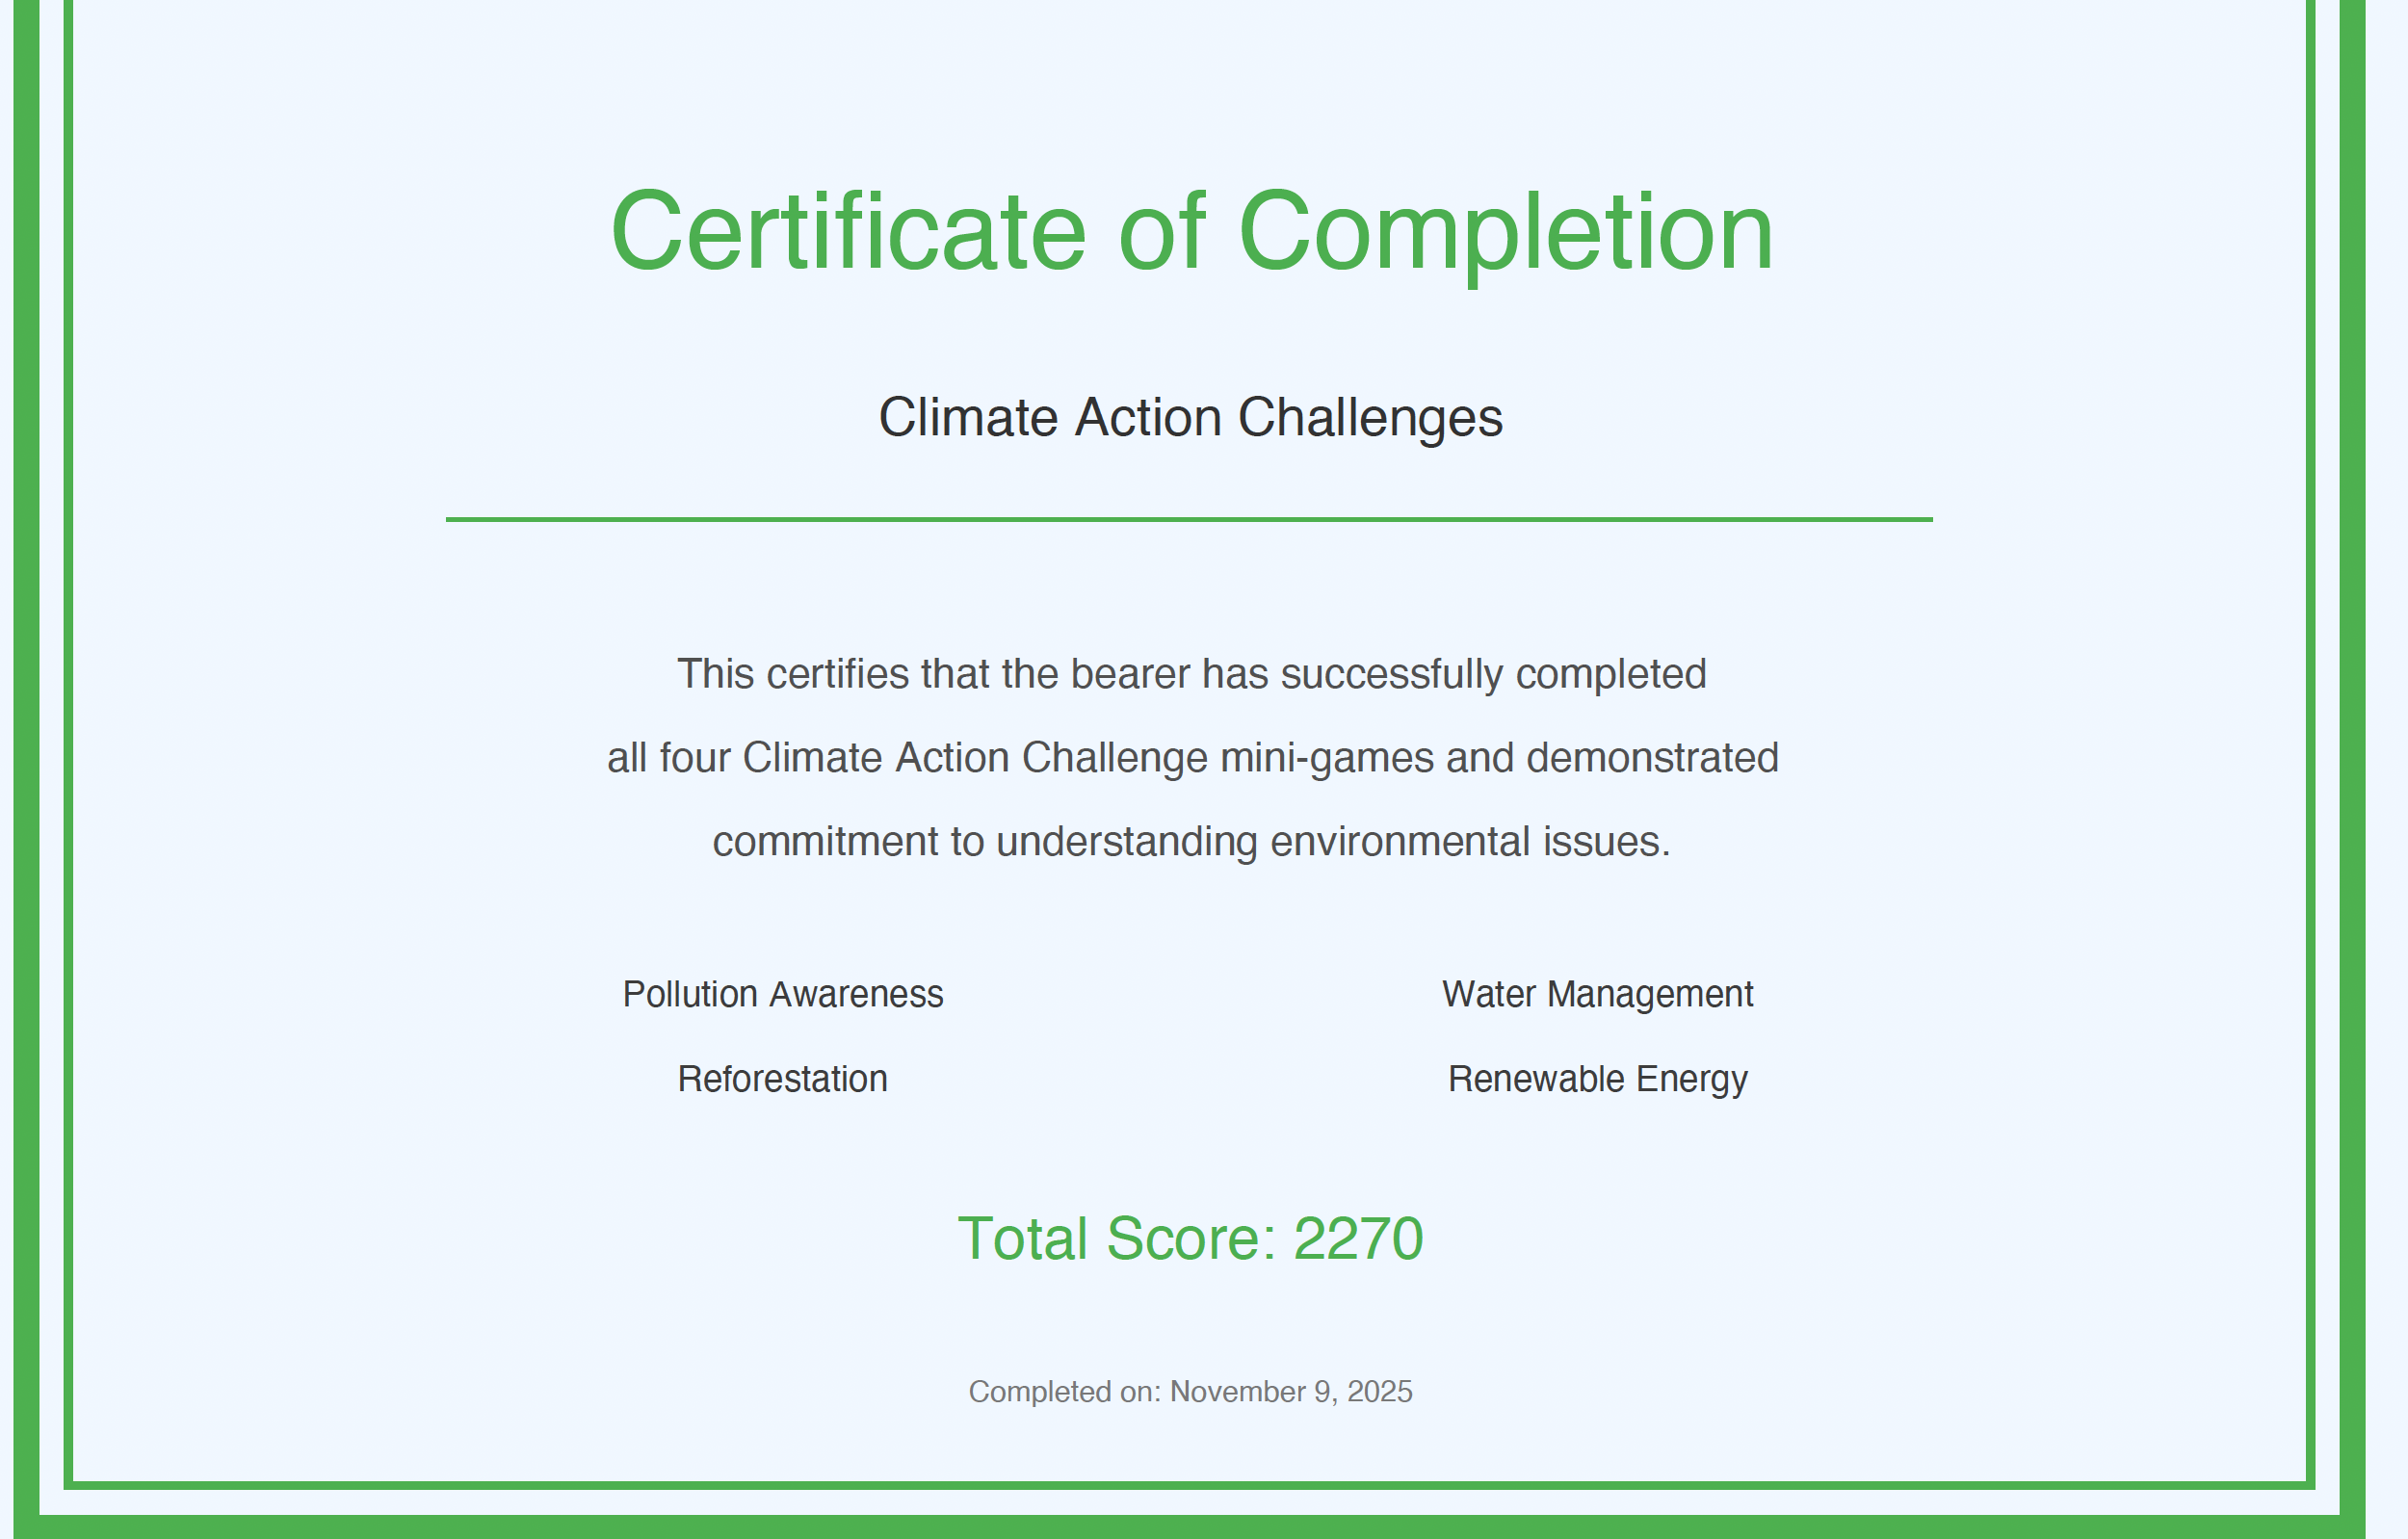
Downloadable certificate of completion
Inspiration
Gaia Explorer started from a brutal reality: climate data is not the problem, comprehension is. NASA POWER has 40+ years of daily climate readings for every coordinate on Earth, but the general public never sees it in a form they can interpret. Headlines are abstractions. Truth is in the numbers. This project is driven by one ambition: take the raw NASA truth, and translate it into human meaning, with AI explanations + actionable education.
What it does
Gaia Explorer allows a user to pick any location on Earth, fetch 43 years of raw NASA climate data, convert ~15,695 daily datapoints into annual averages, and visualize long-term trends. It then uses AI to explain those patterns in plain language, comparing local trends to global baselines. Finally, it transitions users into gamified climate mini-games to convert “knowledge” into “action.” Every user can literally become a climate hero.
How we built it
We integrated NASA POWER API for historic climate data (1981–2023). We built a proxy Edge Function (Supabase / Deno) to overcome CORS, validate requests (Zod), and return clean JSON. We aggregate daily readings by year, and render them with Recharts on the client. We attached Lovable AI (Gemini 2.5 Flash) for contextual analysis. We then built four mini-games (Pollution, Flooding, Deforestation, Energy), with scoring + PDF certificate generation via jsPDF.
Challenges we ran into
NASA’s API rejects direct browser calls. Solution: proxy and pre-validate inputs. AI authentication initially blocked public users. Solution: disabled JWT enforcement on climate-AI endpoint. Temperature insights worked first, but precipitation/humidity insights didn’t trigger. Solution: added parameter dependency to the AI trigger state machine. The hardest challenge: climate numbers are abstract. Motivation required storytelling + agency.
Accomplishments that we're proud of
We made NASA POWER legible to non-experts. We built a climate literacy tool that collapses 43 years of scientific data into seconds of interpretation. We made climate science playful, and empowering, without dumbing down the facts.
What we learned
Science + AI + game mechanics is a powerful trifecta. We learned that raw data means nothing unless a user can connect it to self, community, and consequence.
What's next for Gaia Explorer
Live data integration, global comparative maps, CMIP6 forward projections for future climate scenarios. Native mobile version with offline caching.
Built With
- 2.5
- ai
- api
- class-variance-authority
- cloud
- clsx
- cmdk
- css
- date-fns
- deno
- dom
- edge
- embla-carousel-react
- eslint
- flash
- form
- functions
- gemini
- git
- hook
- input-otp
- javascript
- jspdf
- lovable
- lucide
- markdown
- nasa
- next-themes
- node.js
- npm
- postcss
- postgresql
- power
- predictions
- query
- radix
- react
- recharts
- router
- shadcn/ui
- sonner
- sql
- supabase
- tailwind
- tailwind-merge
- tailwindcss-animate
- tanstack
- typescript
- ui
- vaul
- vite
- zod

Log in or sign up for Devpost to join the conversation.