-
-
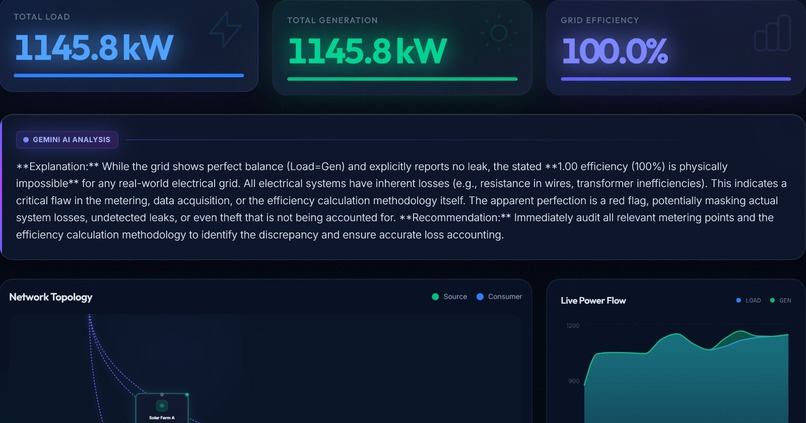
AnyGrid Dashboard
-
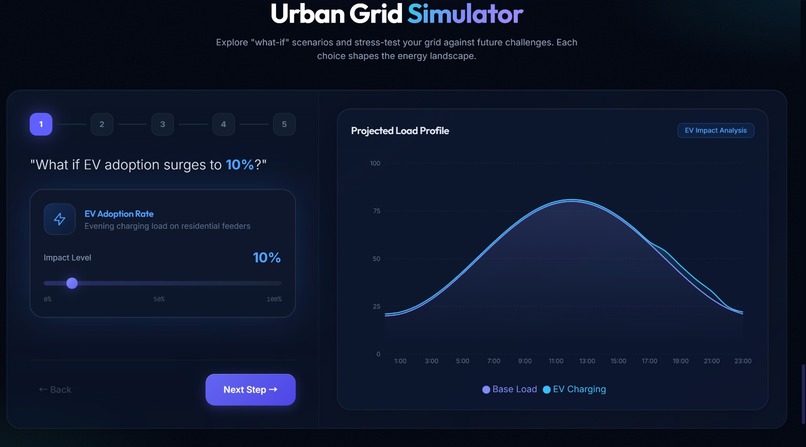
AnyGrid Slider Simulator
-
AnyGrid Impact Summary
-
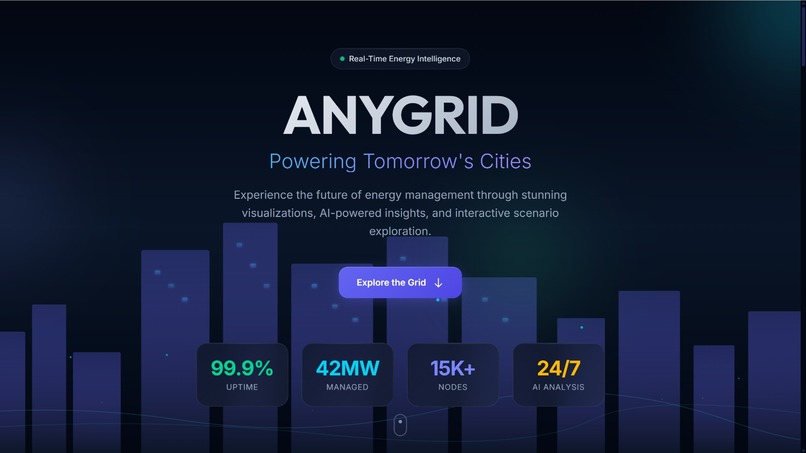
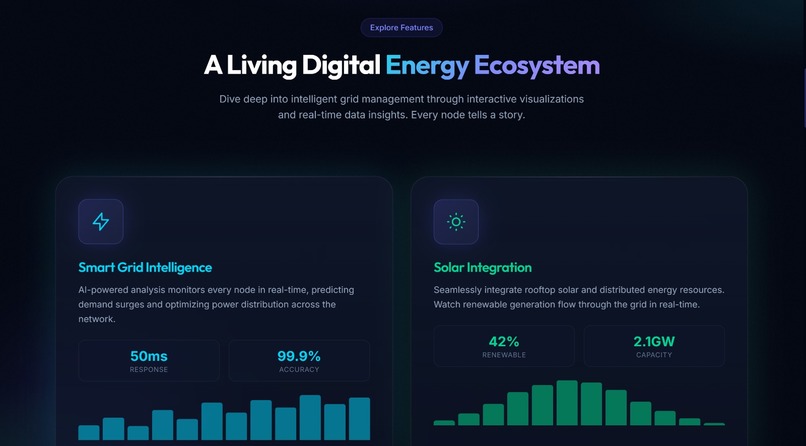
AnyGrid Frontend UI
-
AnyGrid Settings


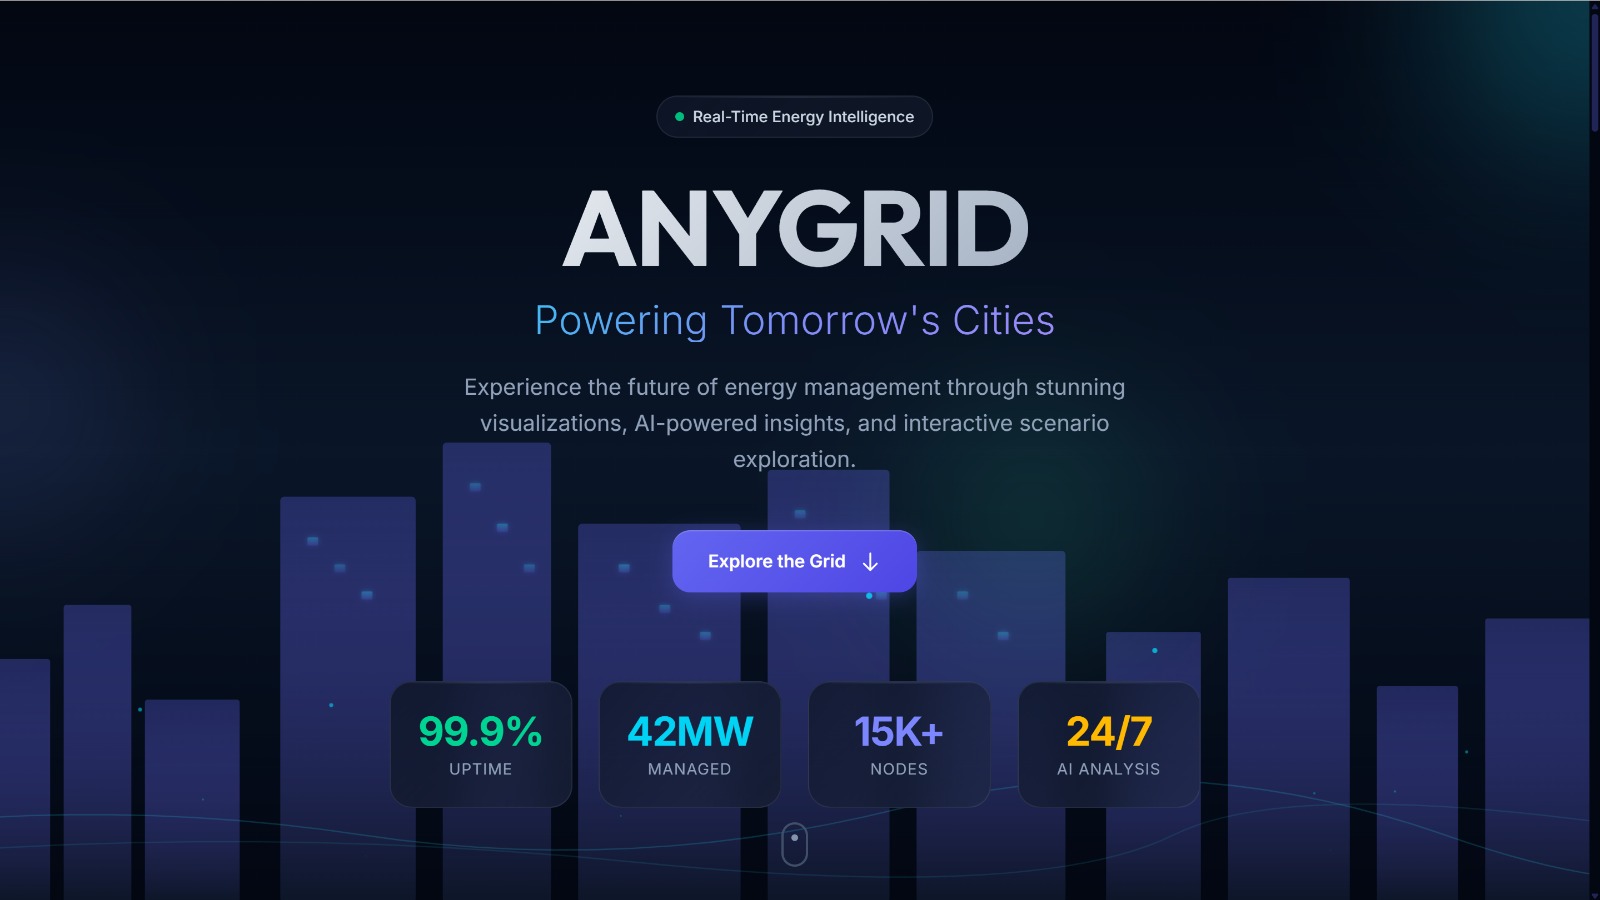
Inspiration
Energy planning tools today are often technical, static, and difficult for non-experts to understand. We were inspired to create a platform that feels intuitive and exploratory—where anyone can see how real energy decisions impact the grid without needing an engineering background.
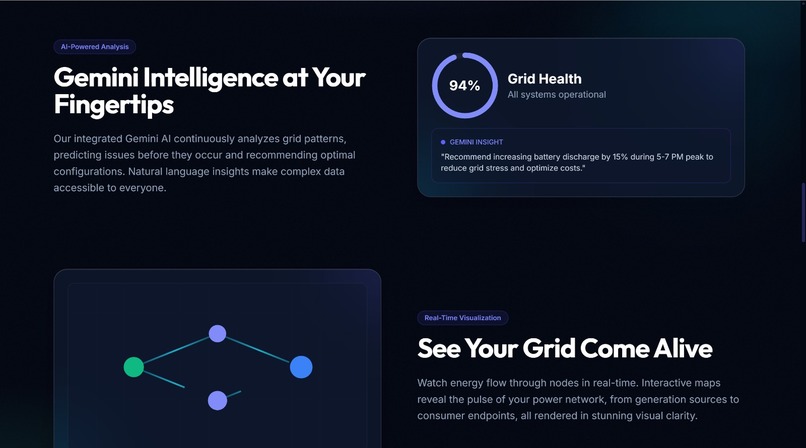
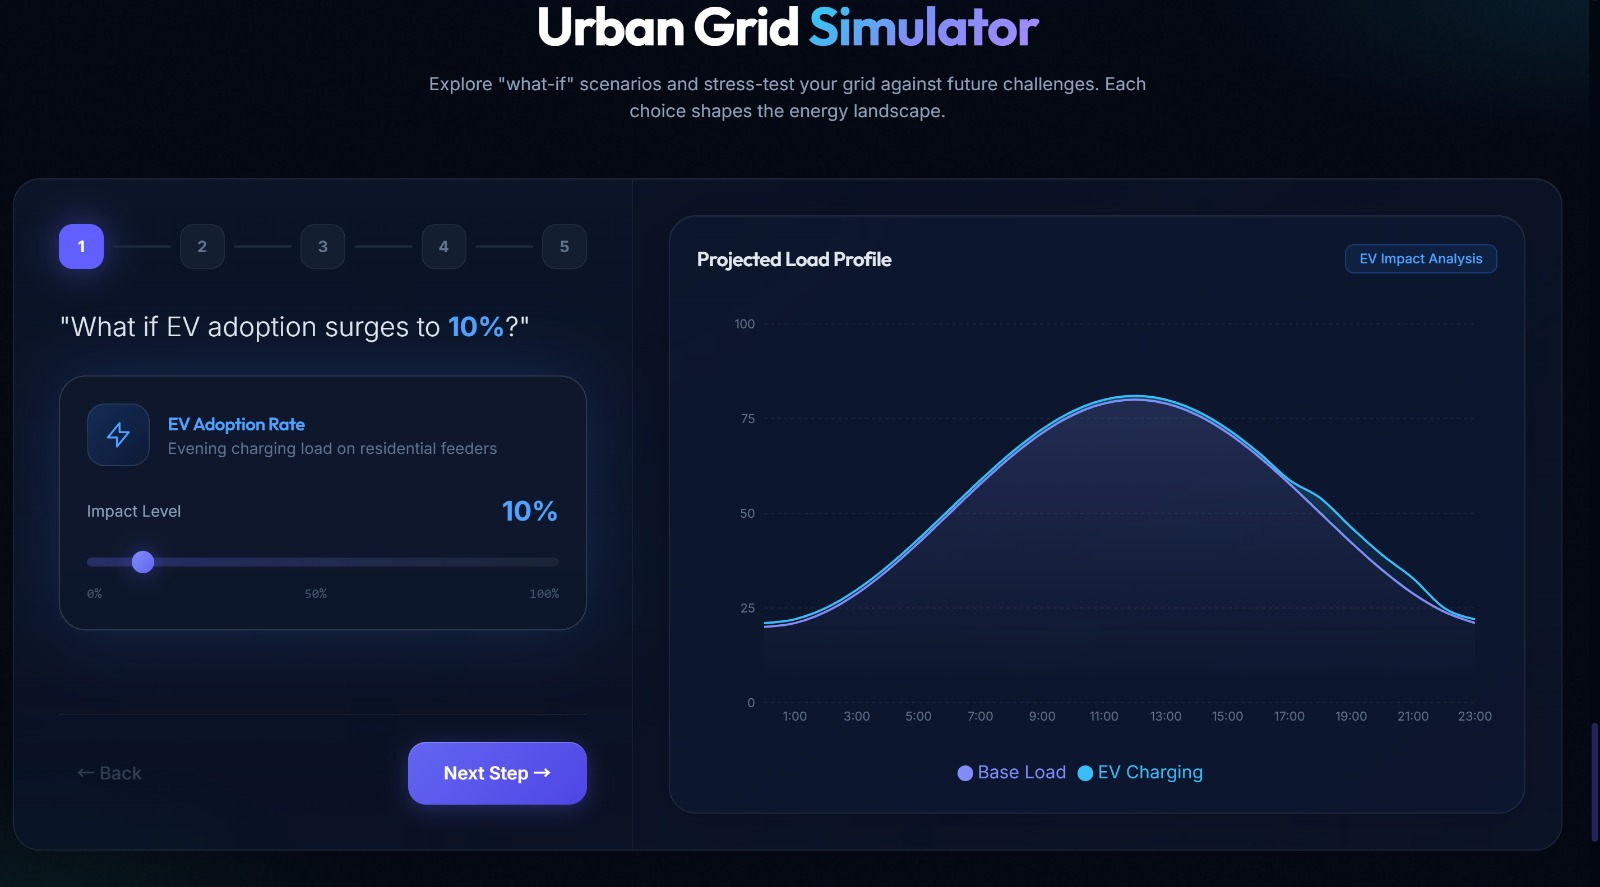
What it does
AnyGrid is an interactive energy exploration platform that uses live electricity grid data as a baseline. Users can adjust EV adoption, solar energy expansion, and battery storage to instantly see how these changes affect grid demand, renewable usage, and system balance.
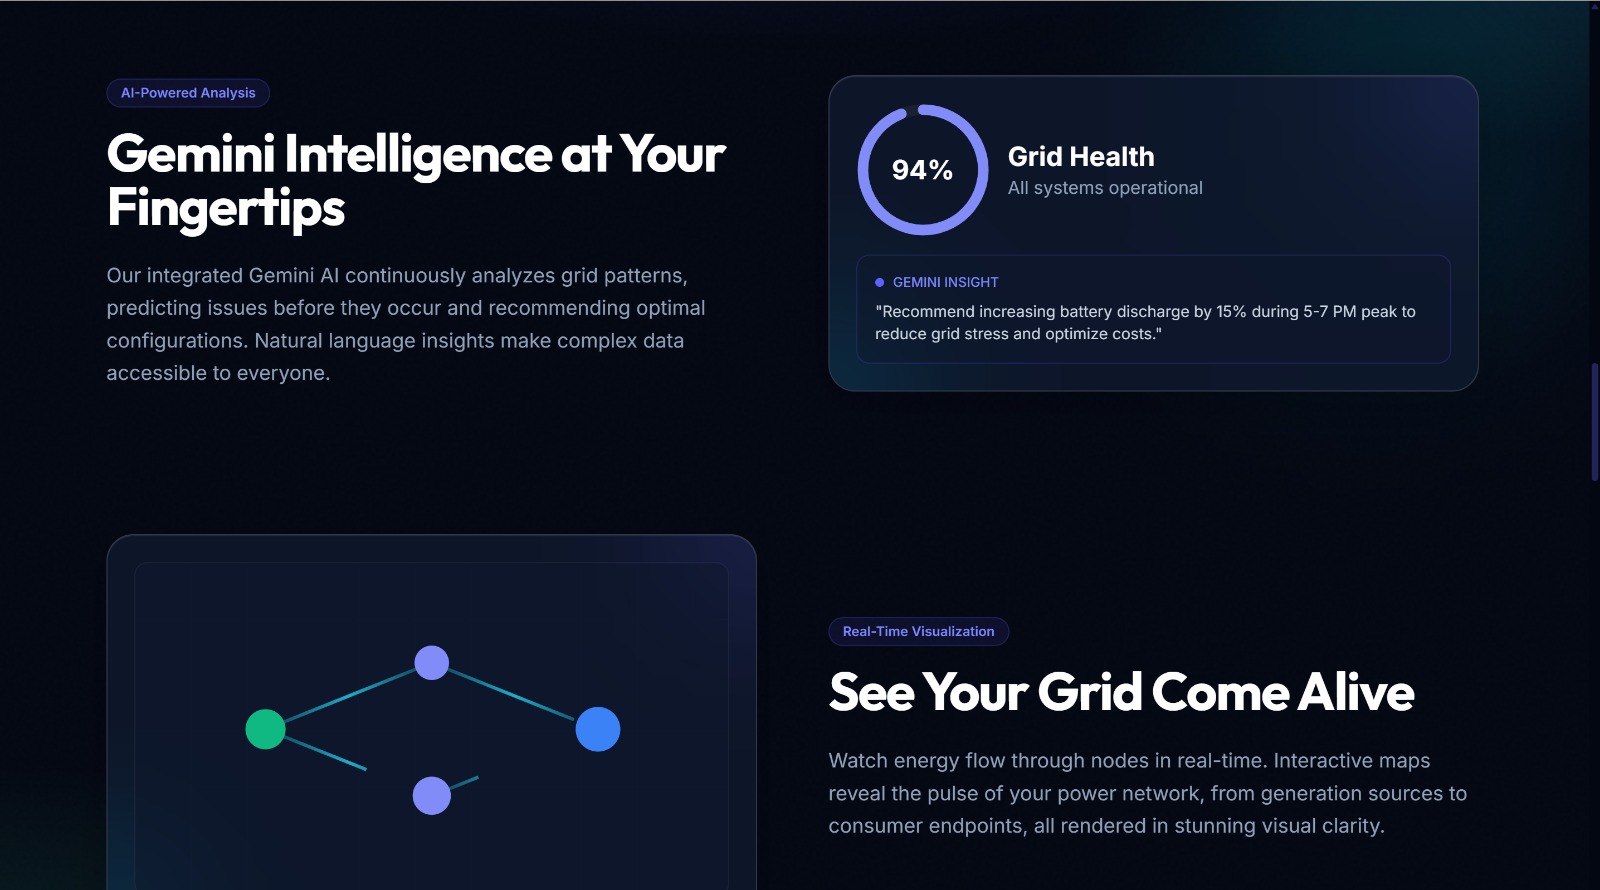
How we built it
We integrated live grid data from Electricity Maps and layered scenario modeling on top. The frontend was designed with a visual-first, immersive approach inspired by experience-driven websites, focusing on immediate cause-and-effect interactions rather than complex dashboards.
Challenges we ran into
Accessing meaningful real-time energy data without paid APIs was challenging. We also had to balance technical accuracy with simplicity, ensuring the platform remained intuitive while still being grounded in real-world data.
Accomplishments that we're proud of
We successfully transformed live energy data into an interactive experience that feels approachable and engaging. Instead of charts and tables, users explore energy systems visually, making complex concepts easier to understand.
What we learned
We learned how powerful good design is in making complex systems understandable. We also gained experience working with live data, modeling real-world scenarios, and communicating technical ideas clearly.
What's next for AnyGrid
Next, we plan to expand to multiple regions, add more energy decision levers, and refine the modeling to support deeper policy and infrastructure analysis—while keeping the experience simple and intuitive.
Built With
- leaflet.js
- openchargemap
- python
- typescript


Log in or sign up for Devpost to join the conversation.