About the Project
Inspiration
I have always been interested in quantitative trading and in understanding what is actually happening behind market prices.
While working with futures data, I noticed something interesting. A futures market is not just one price. It has a curve — the same asset priced for different future dates.
That curve contains information about the cost of holding an asset over time, such as financing, storage, dividends, or, in crypto, funding rates.
But I kept seeing simple trading signals based on these curves. For example, two futures prices look far apart, so the assumption is that they should come back together.
That made me ask a much harder question:
Is the curve actually mispriced, or is the price difference completely justified by carry, market conditions, and trading costs?
I wanted to build a system that does not assume every deviation is a trading opportunity.
Instead, I wanted it to be able to say "no trade" when the data does not support a trade.
That became the idea behind my Futures Curve Intelligence Engine.
What It Does
I built one pipeline that works across three markets:
- Gold on COMEX
- Bitcoin on Deribit
- Ethereum on Deribit
The system starts by reconstructing the futures curve from raw contract data.
Then it estimates what the curve should look like using a cost-of-carry model:
$$ F(T) = S \cdot e^{(r+s-y)T} $$
where $S$ is the spot price, $r$ is the financing rate, $s$ is storage cost, $y$ is convenience yield, and $T$ is the time to expiry.
I fit the curve again every day using:
$$ \ln F = a + cT $$
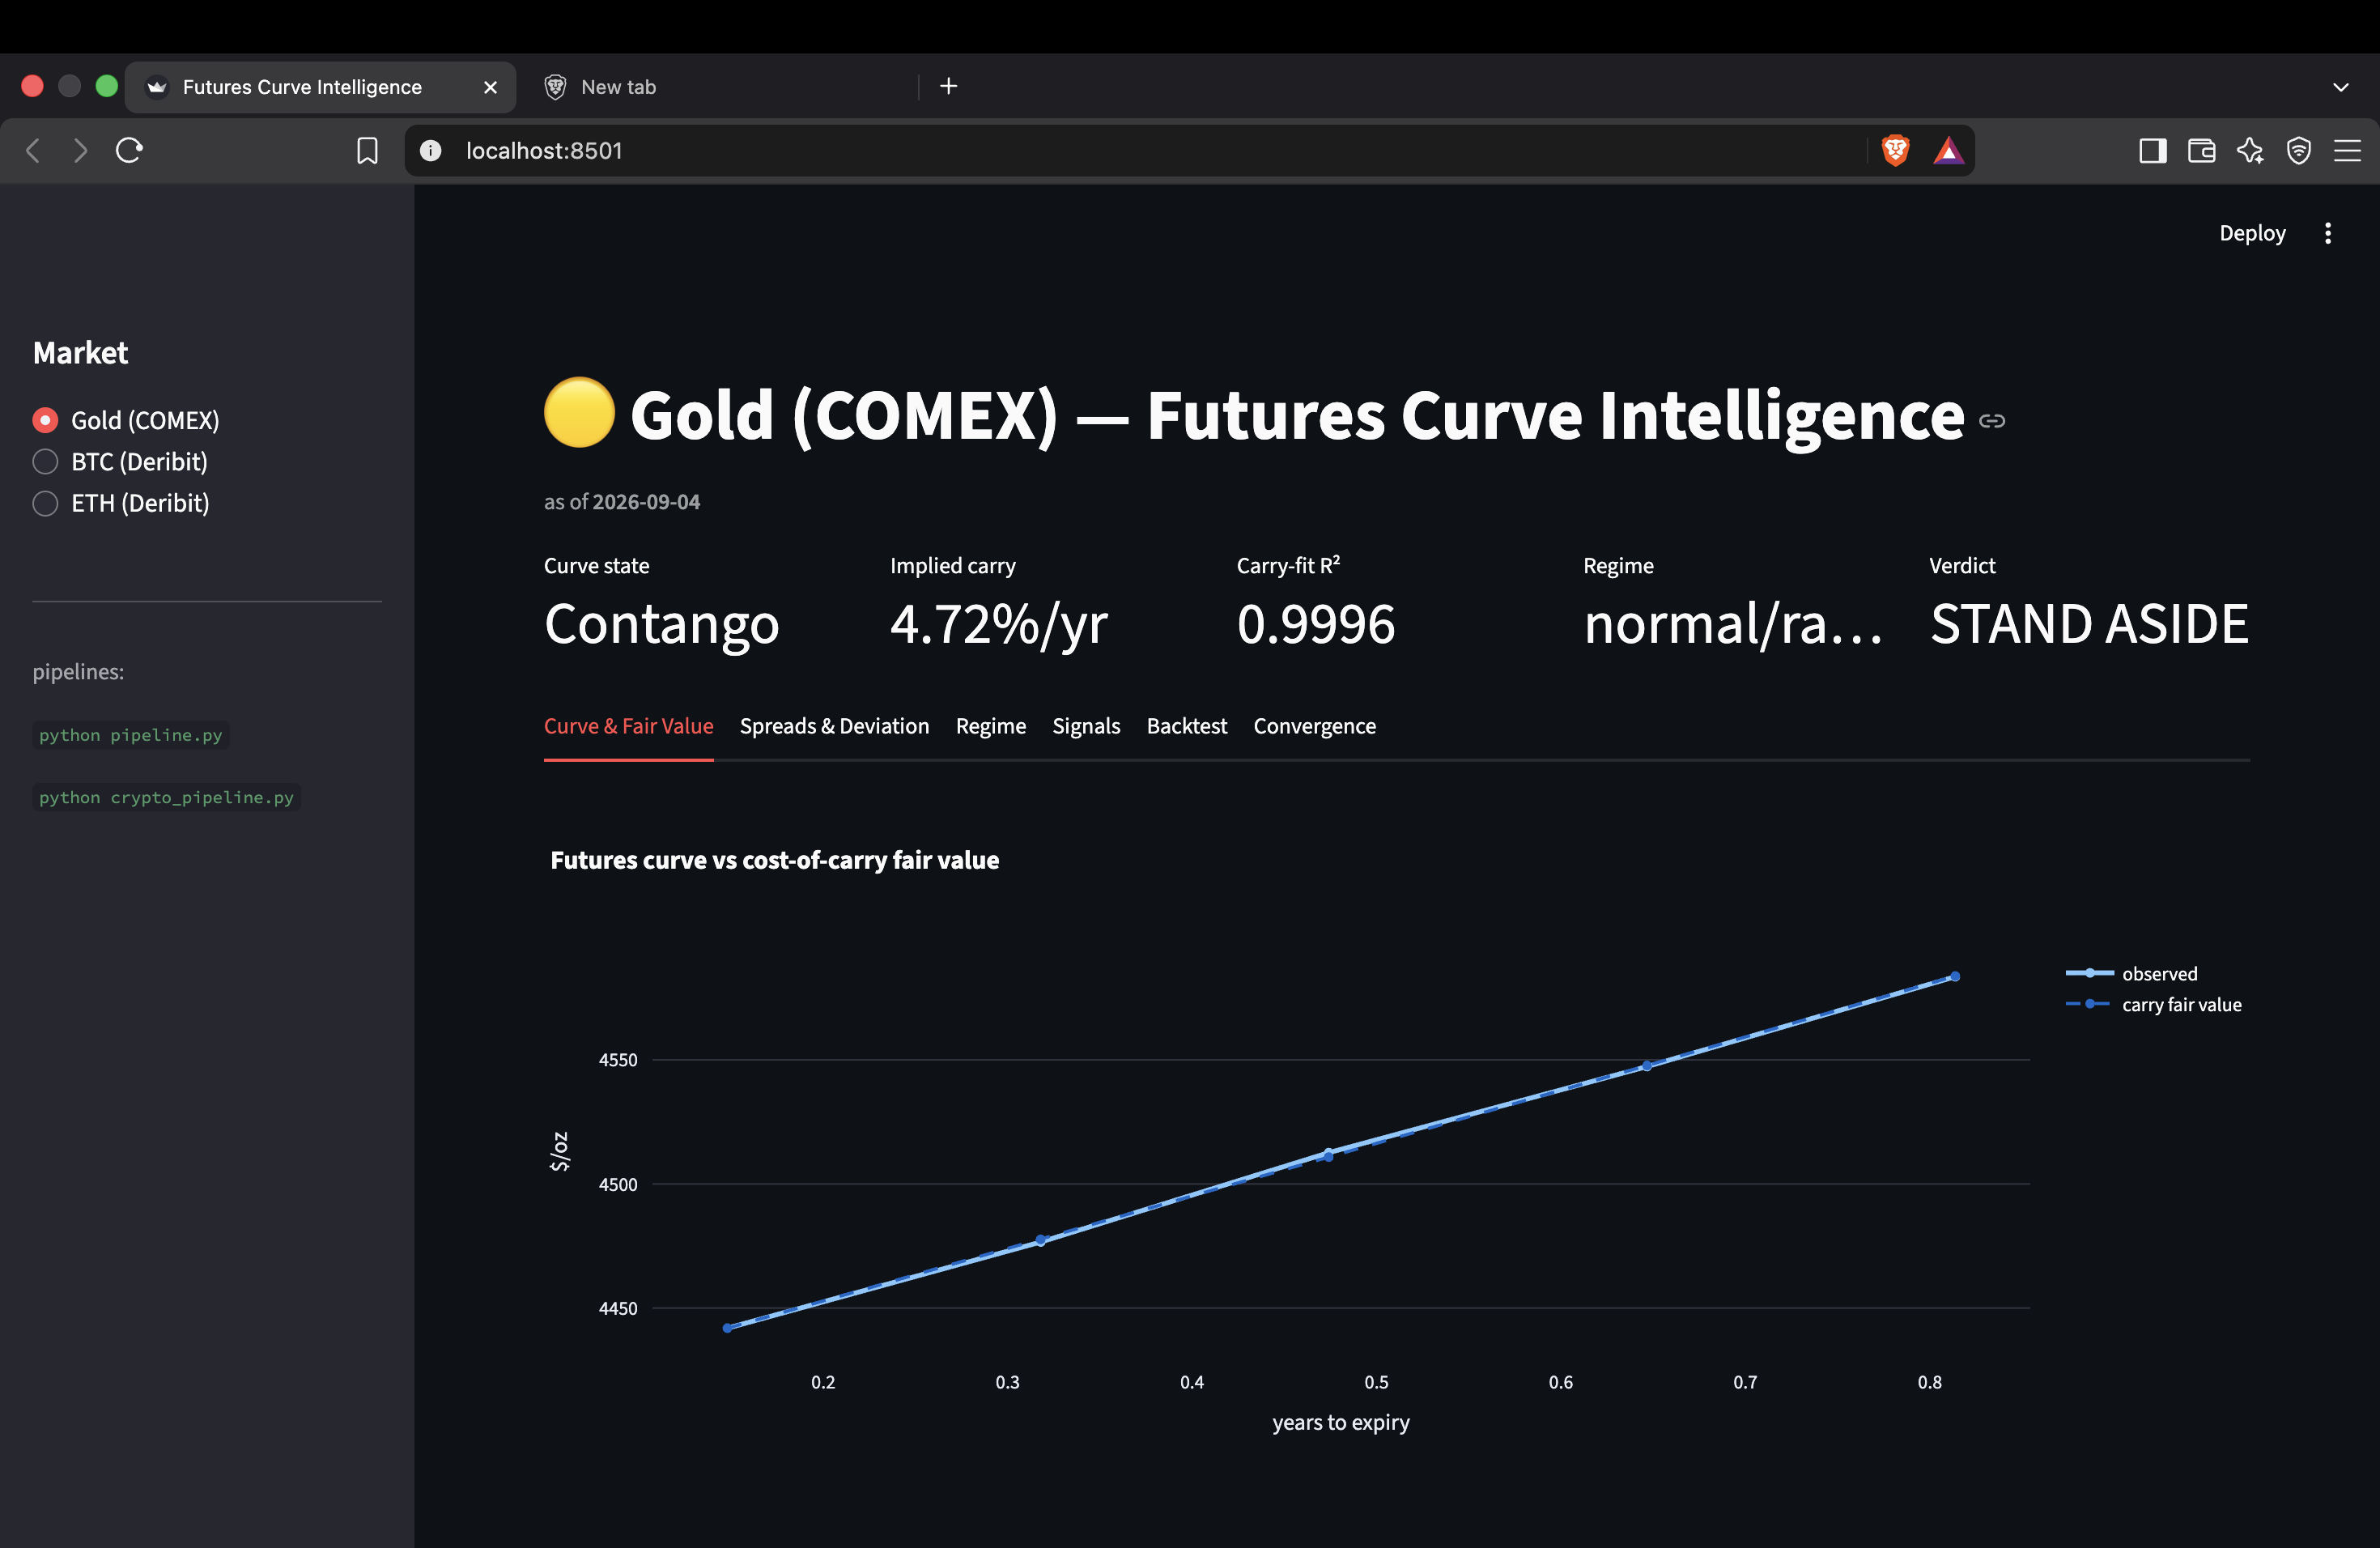
For gold, this gives an $R^2$ of approximately 0.999, meaning the fitted curve explains almost all of the observed variation in the data.
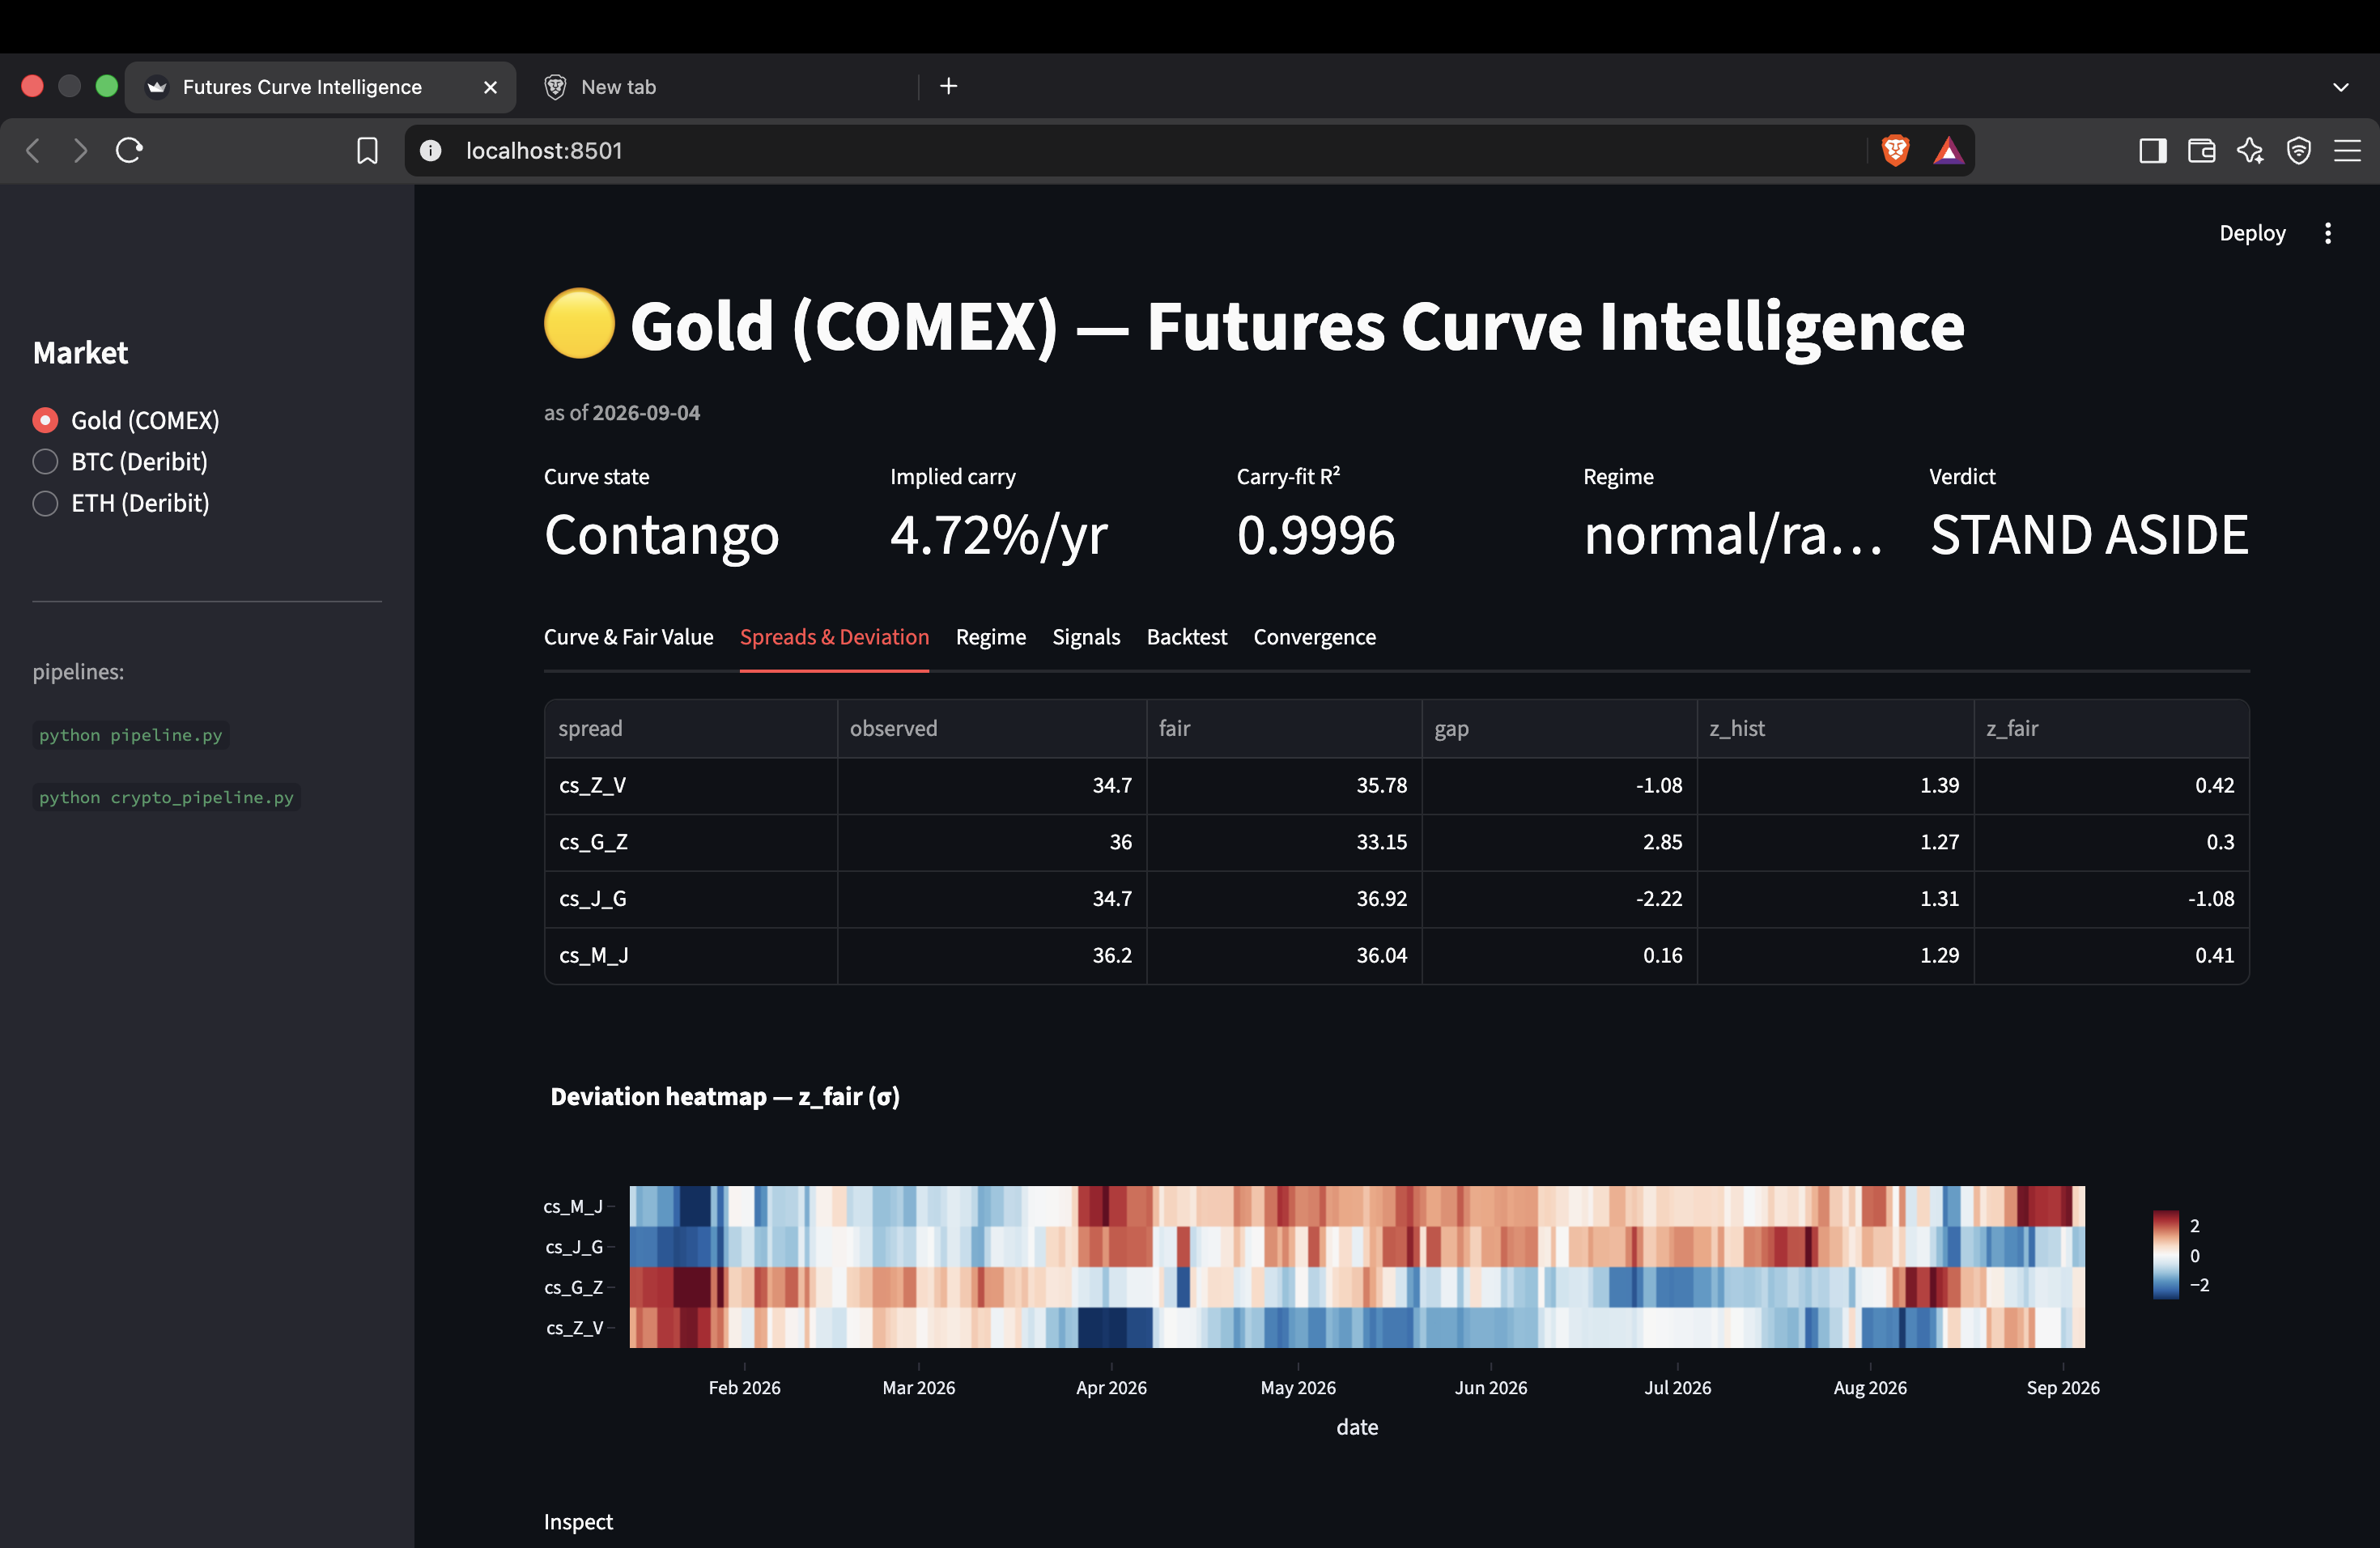
After that, the system measures how far the actual market is from its expected value.
One of the main measures is a rolling z-score:
$$ z = \frac{x-\mu_{\text{rolling}}}{\sigma_{\text{rolling}}} $$
Everything is calculated point-in-time, so the system does not use future information when making a decision.
The pipeline then:
- Builds the futures curve.
- Estimates fair value.
- Measures the deviation from fair value.
- Checks the market regime.
- Uses machine learning as an additional confirmation.
- Checks whether the expected edge is large enough after fees and slippage.
- Runs a walk-forward backtest.
The final goal is not simply to generate more trades.
It is to find situations where the data gives a good reason to trade — and avoid situations where it does not.
How I Built It
I built the project mainly in Python, using:
- pandas for data processing
- NumPy for numerical calculations
- scikit-learn for machine learning
- Streamlit for the dashboard
- Plotly for interactive charts
For data, I used Yahoo Finance for gold futures and Deribit's public API for Bitcoin and Ethereum futures, perpetuals, index prices, and funding-rate history.
I designed the gold and crypto engines around the same data structure and statistical components. This means that adding another market does not require rebuilding the entire system — it mainly requires a new data adapter and expiry rule.
I also focused heavily on avoiding look-ahead bias.
Every rolling statistic is lagged by one step, and the machine learning model is retrained using an expanding historical window.
I even added a unit test specifically to check that the system does not accidentally use future information.
Finally, I built a Streamlit dashboard where I can select a market and see the curve, fair value, deviations, signals, and backtest results.
The Role of AI
I did not want to use AI just because the project was supposed to have AI.
I wanted it to have a specific and limited job.
The first use is a Gradient Boosting model that tries to predict the next 10-day spread move.
Its out-of-sample accuracy was around 54%.
That is not strong enough for me to trust the model by itself.
So I use it only as a confirmation filter. The statistical system can identify a potential opportunity, and the machine learning model provides another signal.
The second use is clustering.
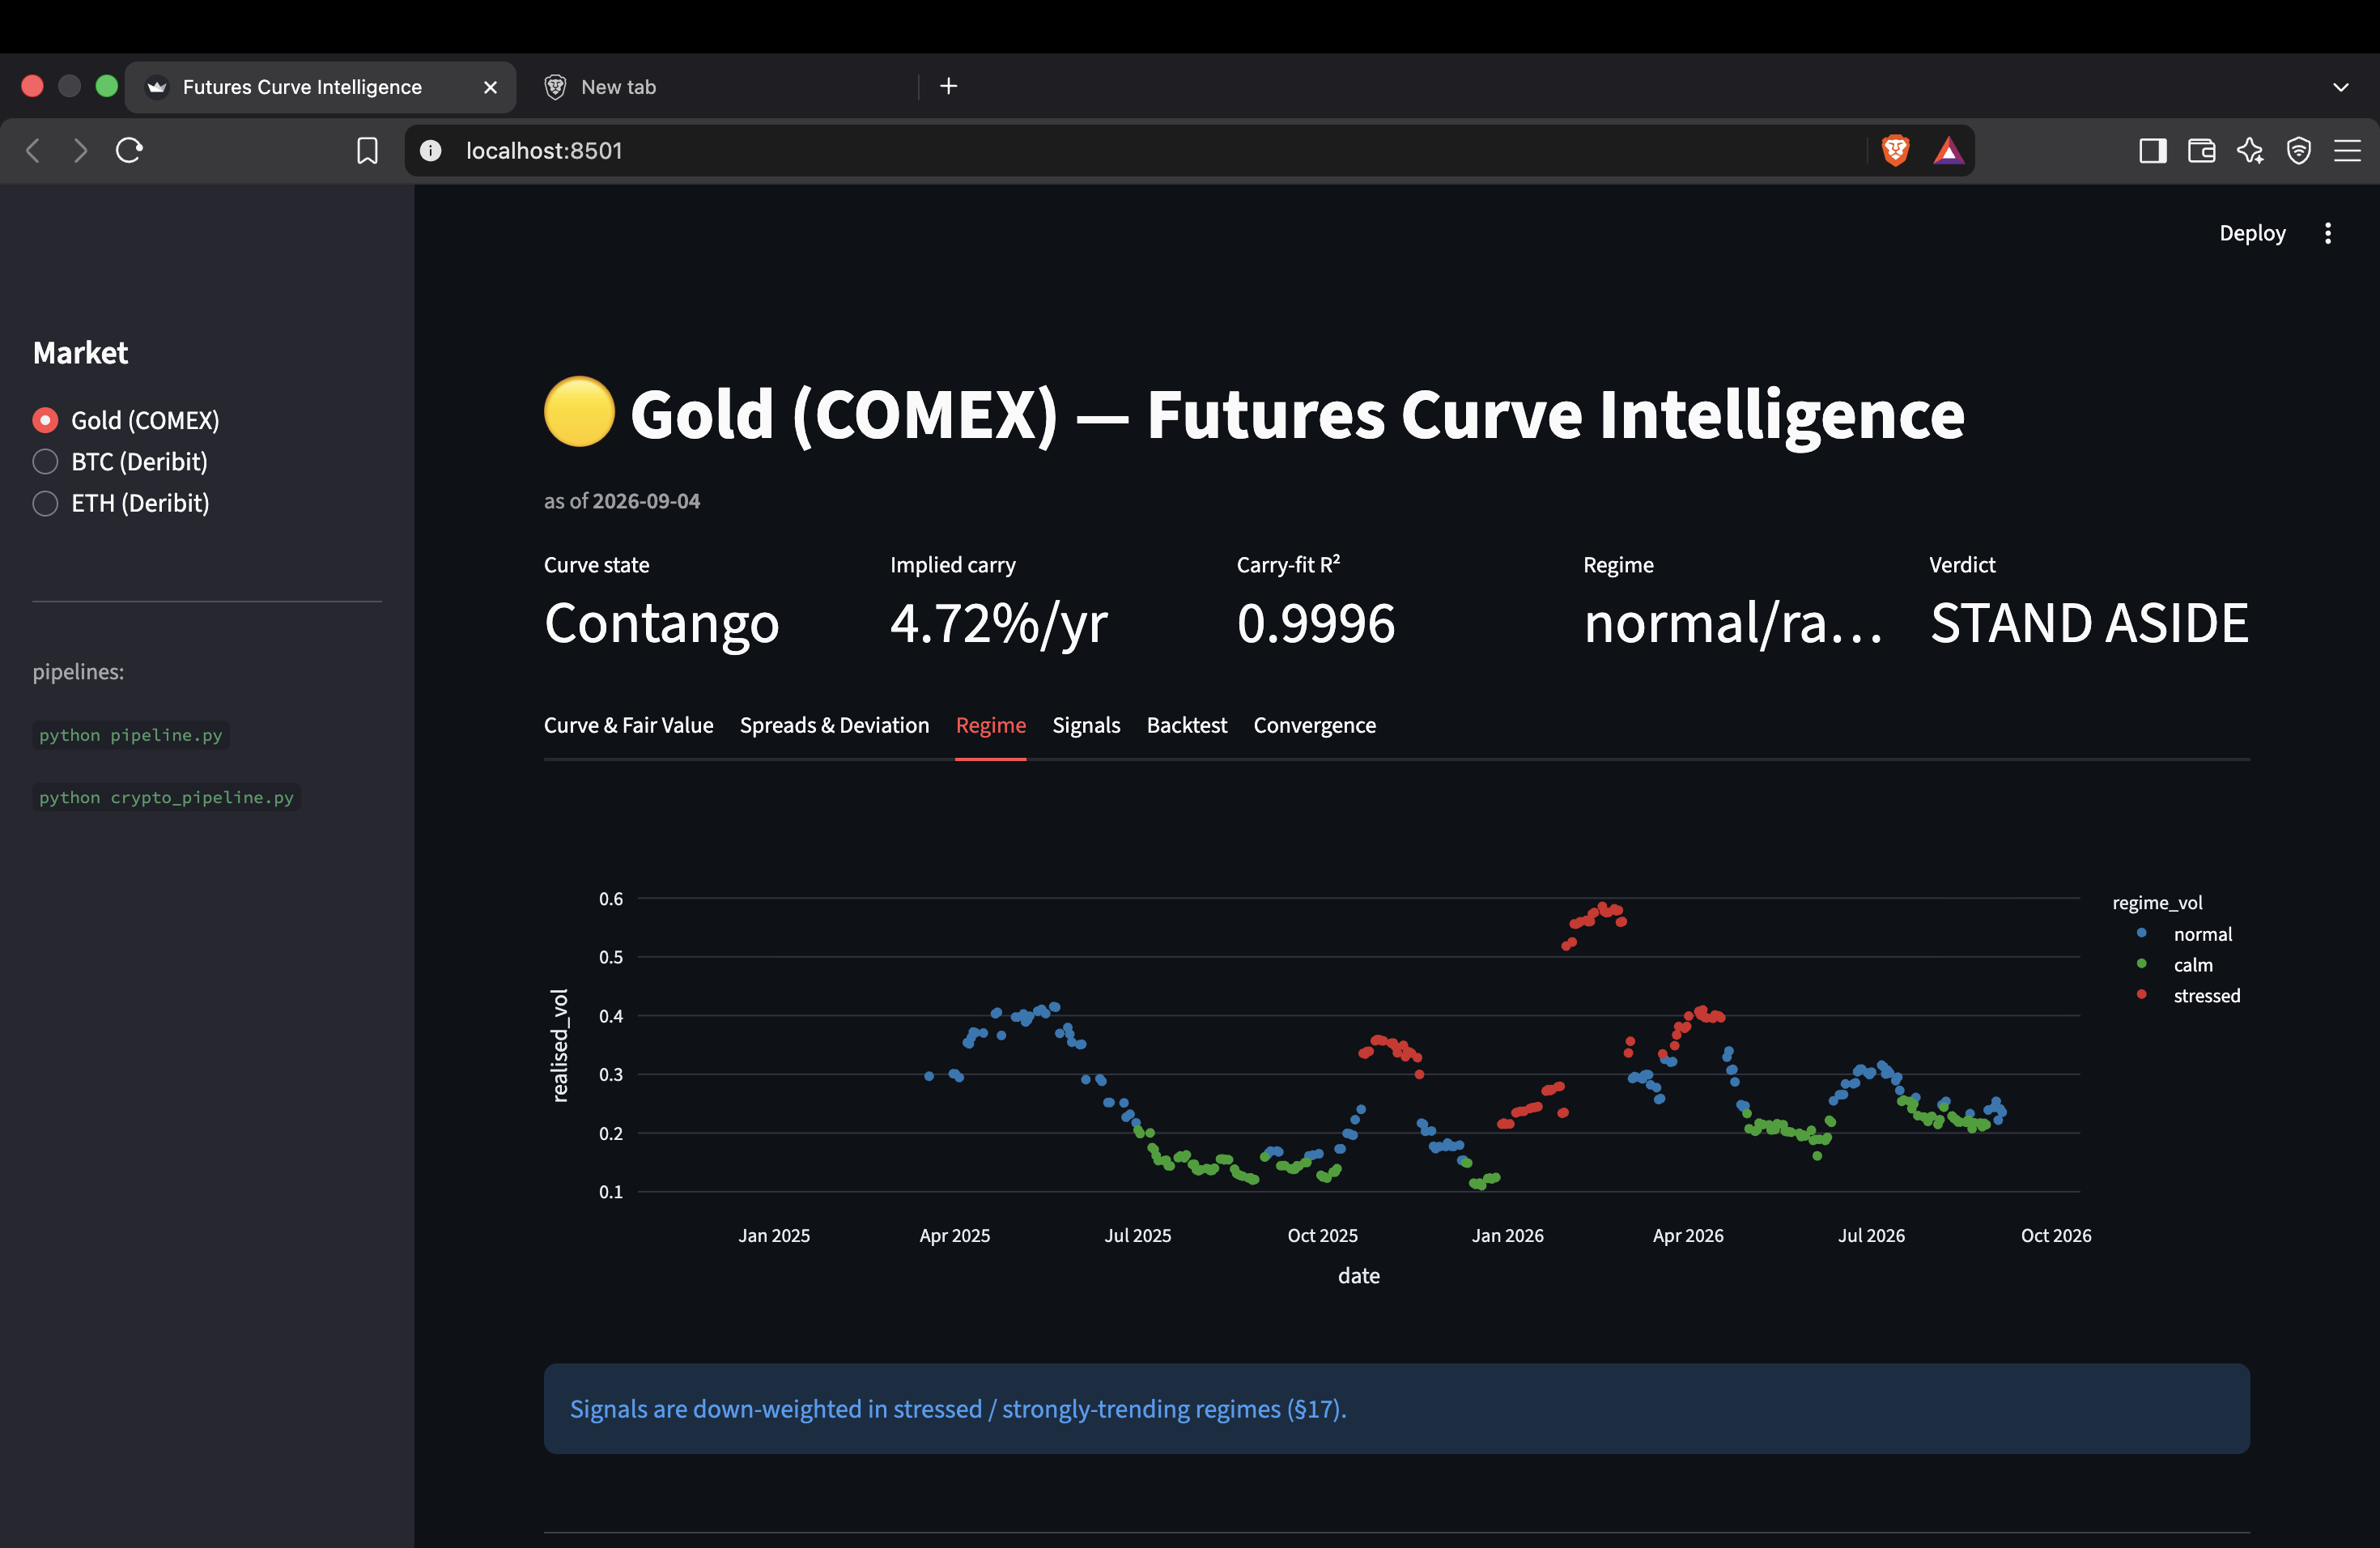
It helps identify different market conditions, such as calm, normal, or stressed regimes.
So AI does not replace the core quantitative model.
It helps the system understand when a signal is more or less reliable.
Results
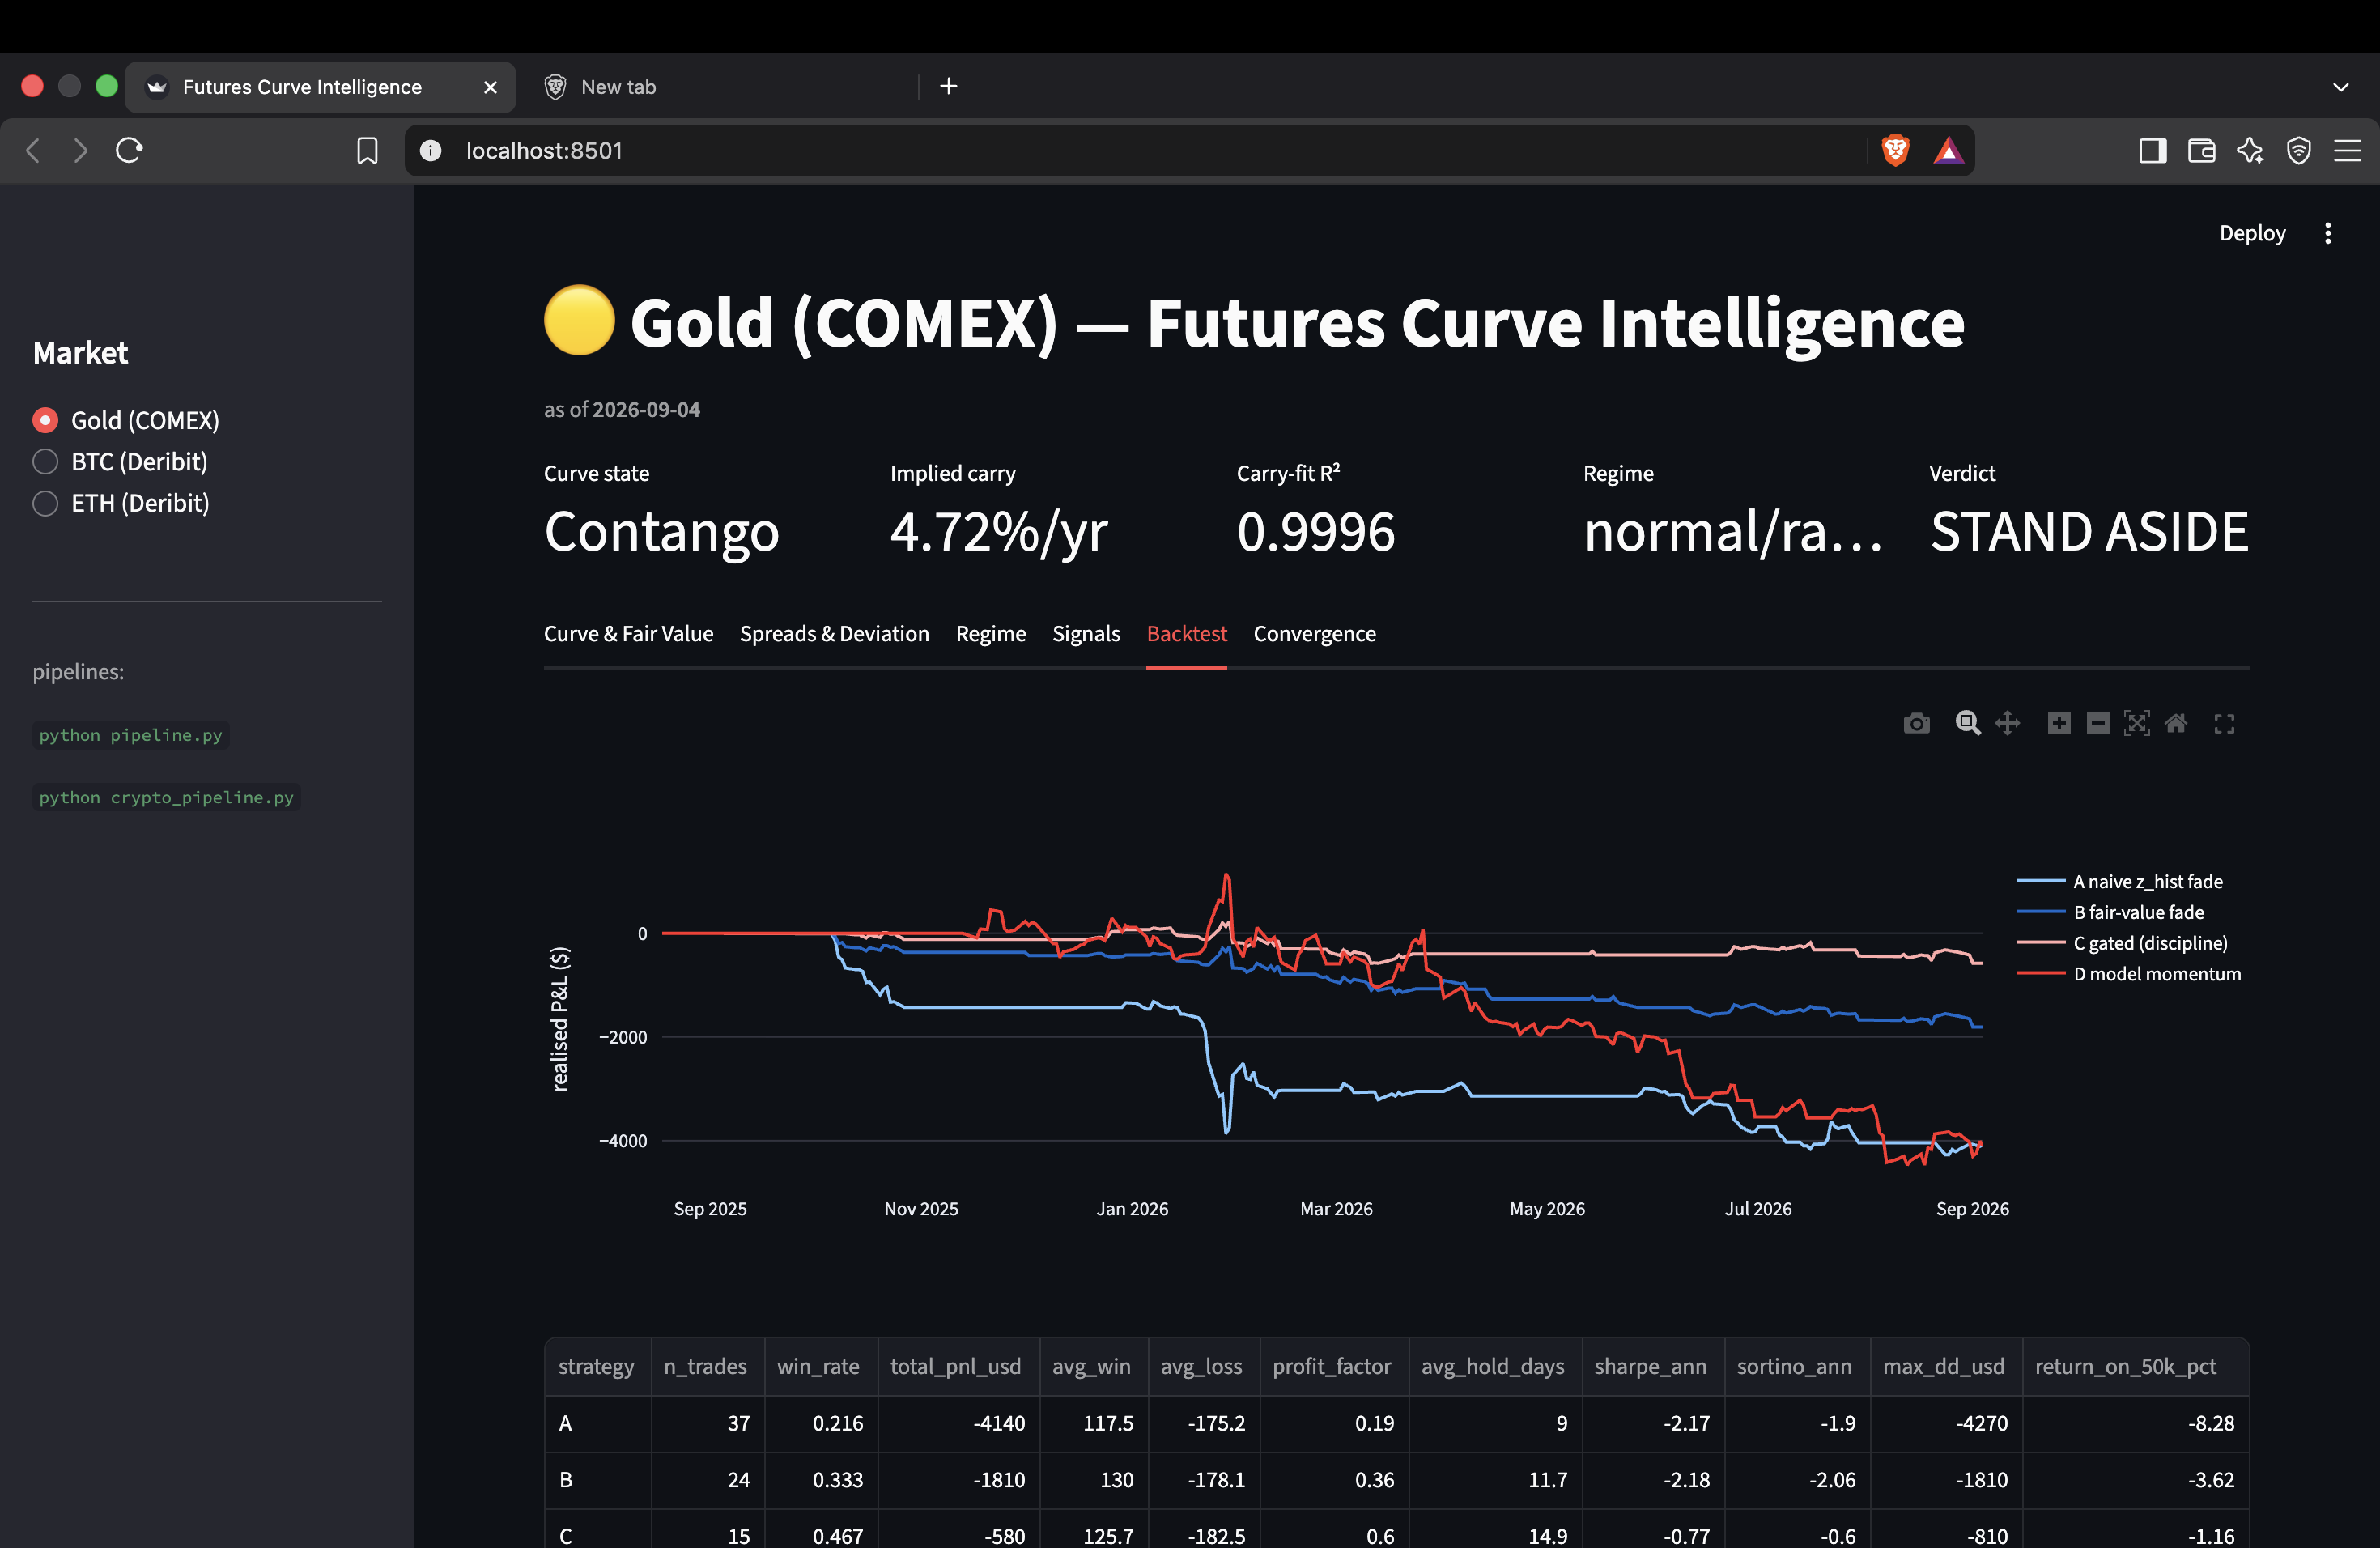
I tested the system using a $50,000 book over roughly one year.
Gold
The engine's current verdict is:
Stand aside.
The curve is efficiently priced, so the system does not find a strong reason to trade.
This was actually an important result for me.
A naive strategy that trades whenever it sees a statistical wobble loses about 8.3%, with a Sharpe ratio of -2.17.
My fully filtered version reduces this to about a 1.2% loss, with a Sharpe ratio of -0.77, while trading around 60% less.
The point is not that the strategy suddenly became profitable.
The point is that the system learned when not to trade.
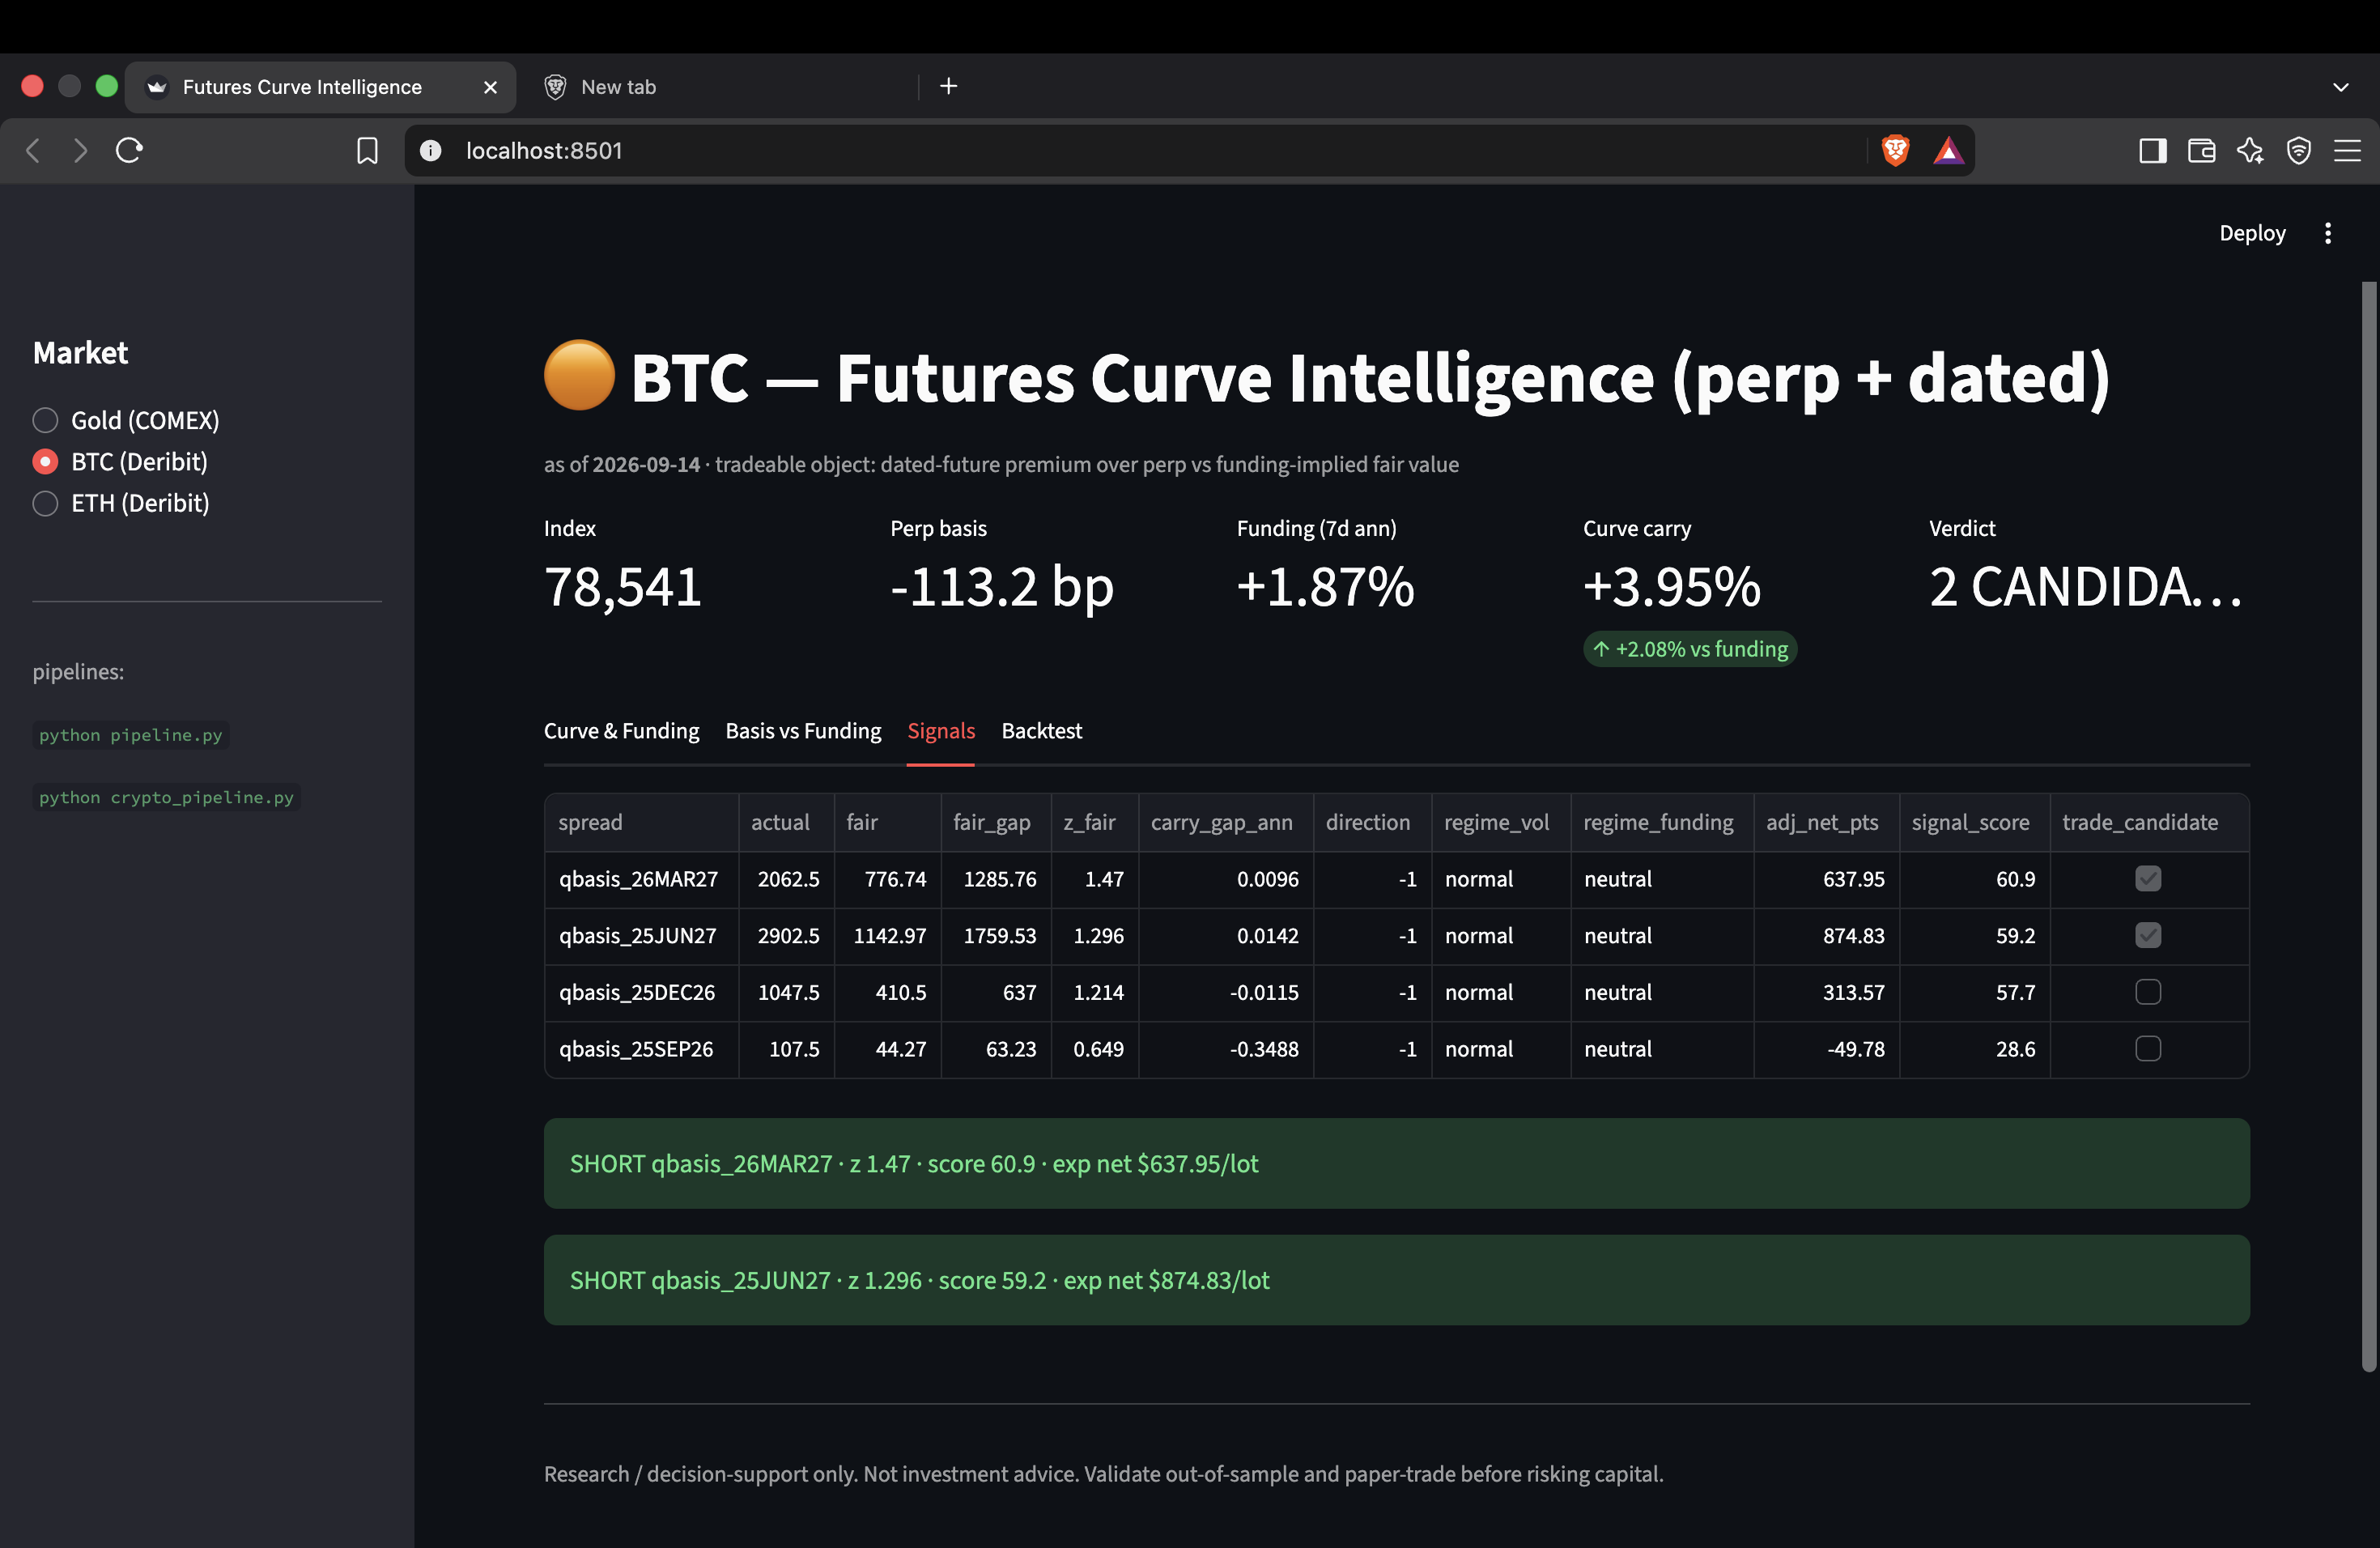
Bitcoin
Bitcoin was different.
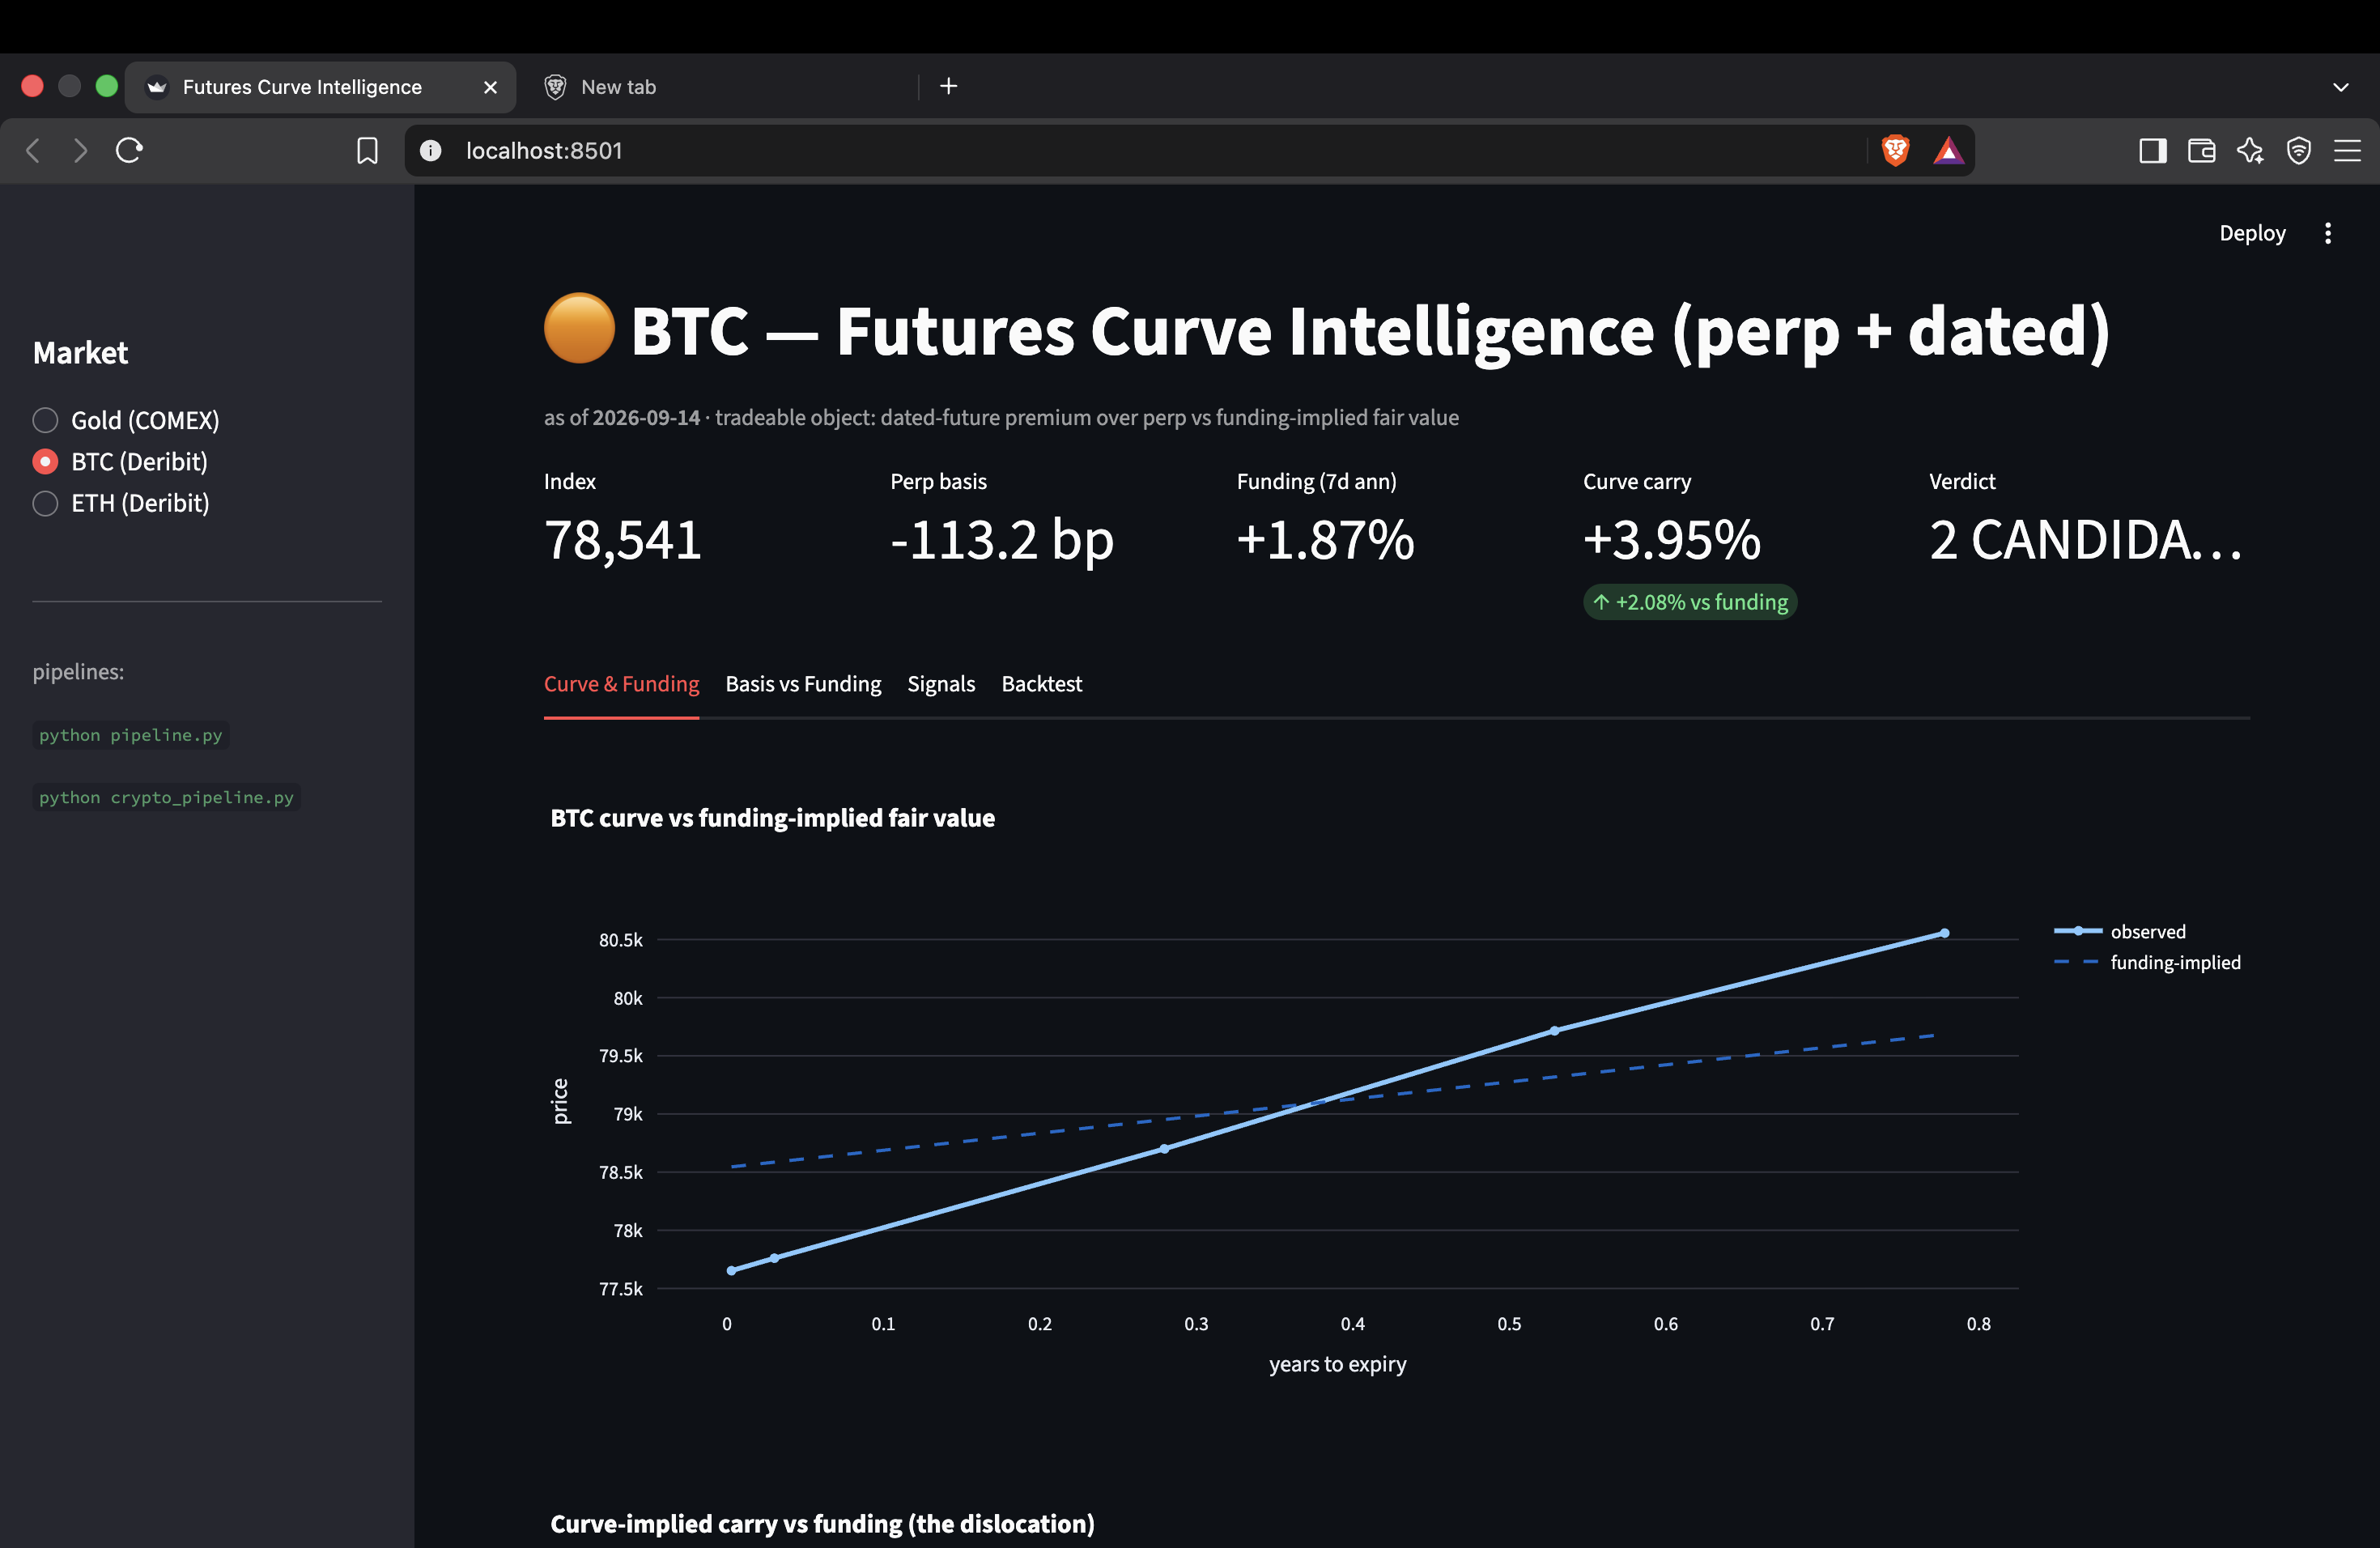
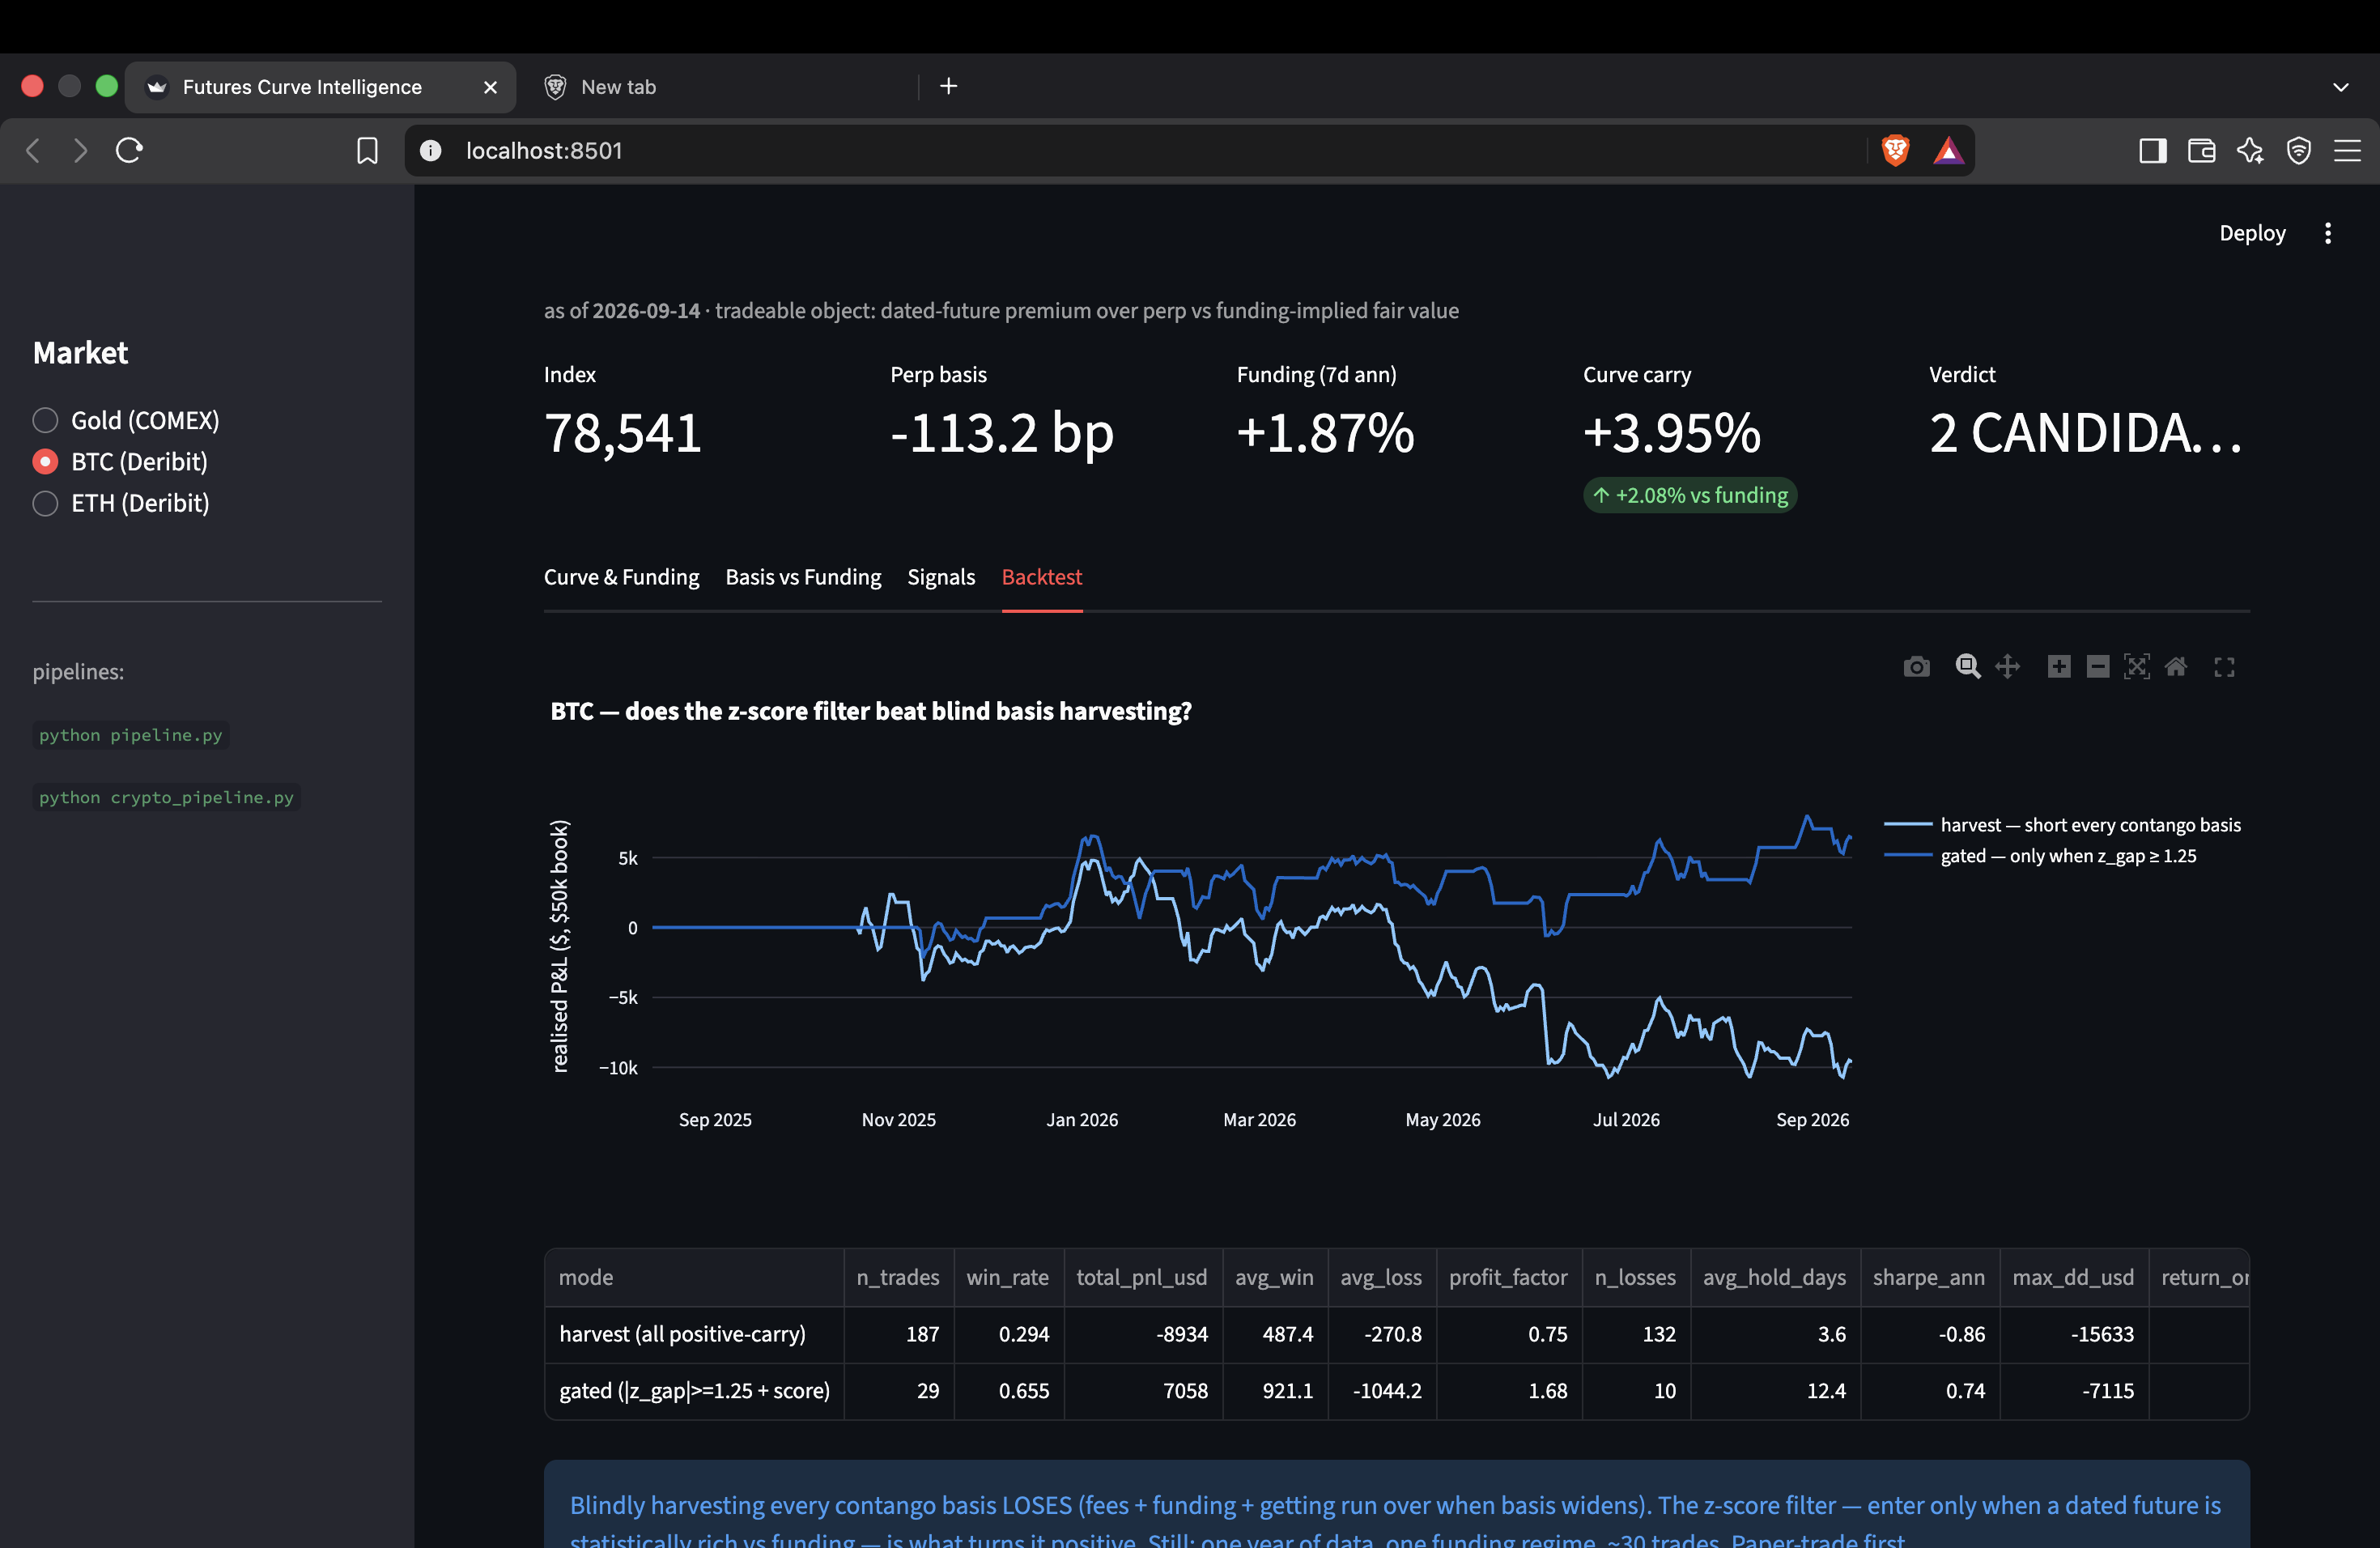
Here I looked at the premium of a dated future over the perpetual contract and compared it with what the funding rate suggested.
Blindly trading every rich basis produced a Sharpe ratio of -0.80, a drawdown of about $15,633, and roughly a 16% annual loss.
After filtering for statistically extreme cases using $|z| \geq 1.25$, the result was:
- 29 trades
- 65% win rate
- 0.84 Sharpe
- 1.68 profit factor
- Approximately 13% annual return
The market and trading costs were the same.
The main difference was the filter.
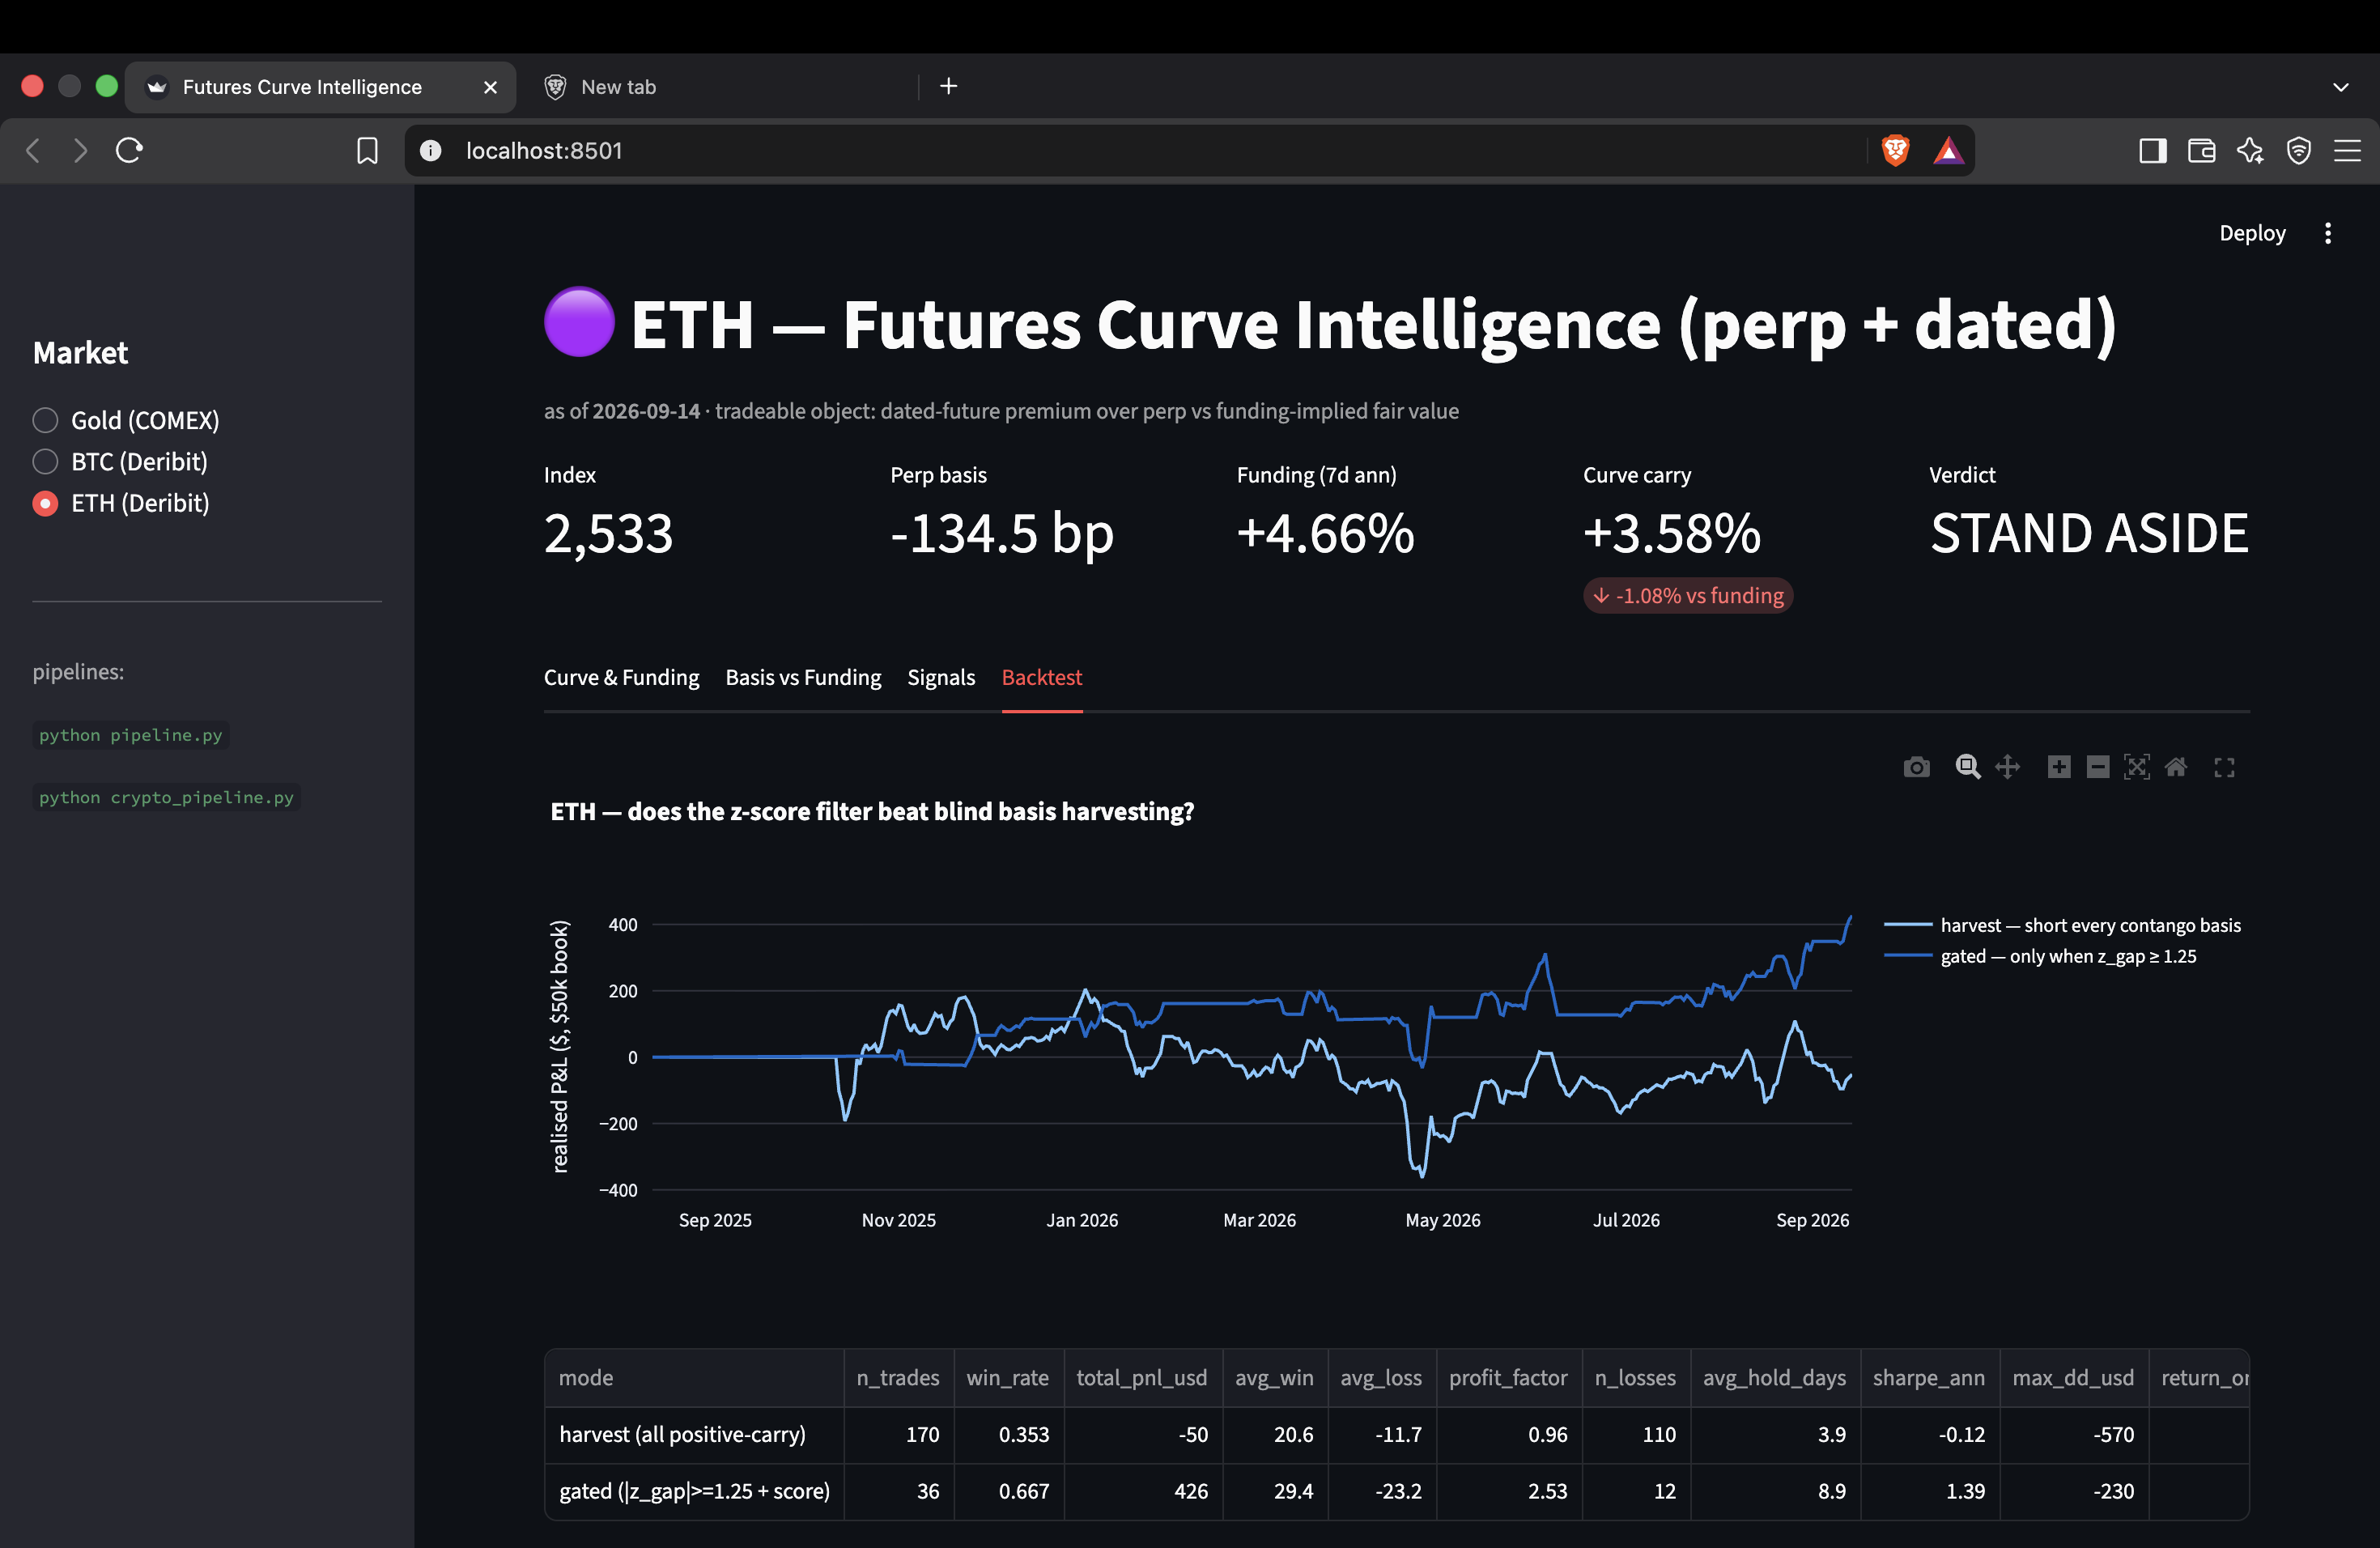
Ethereum
Ethereum was another useful result.
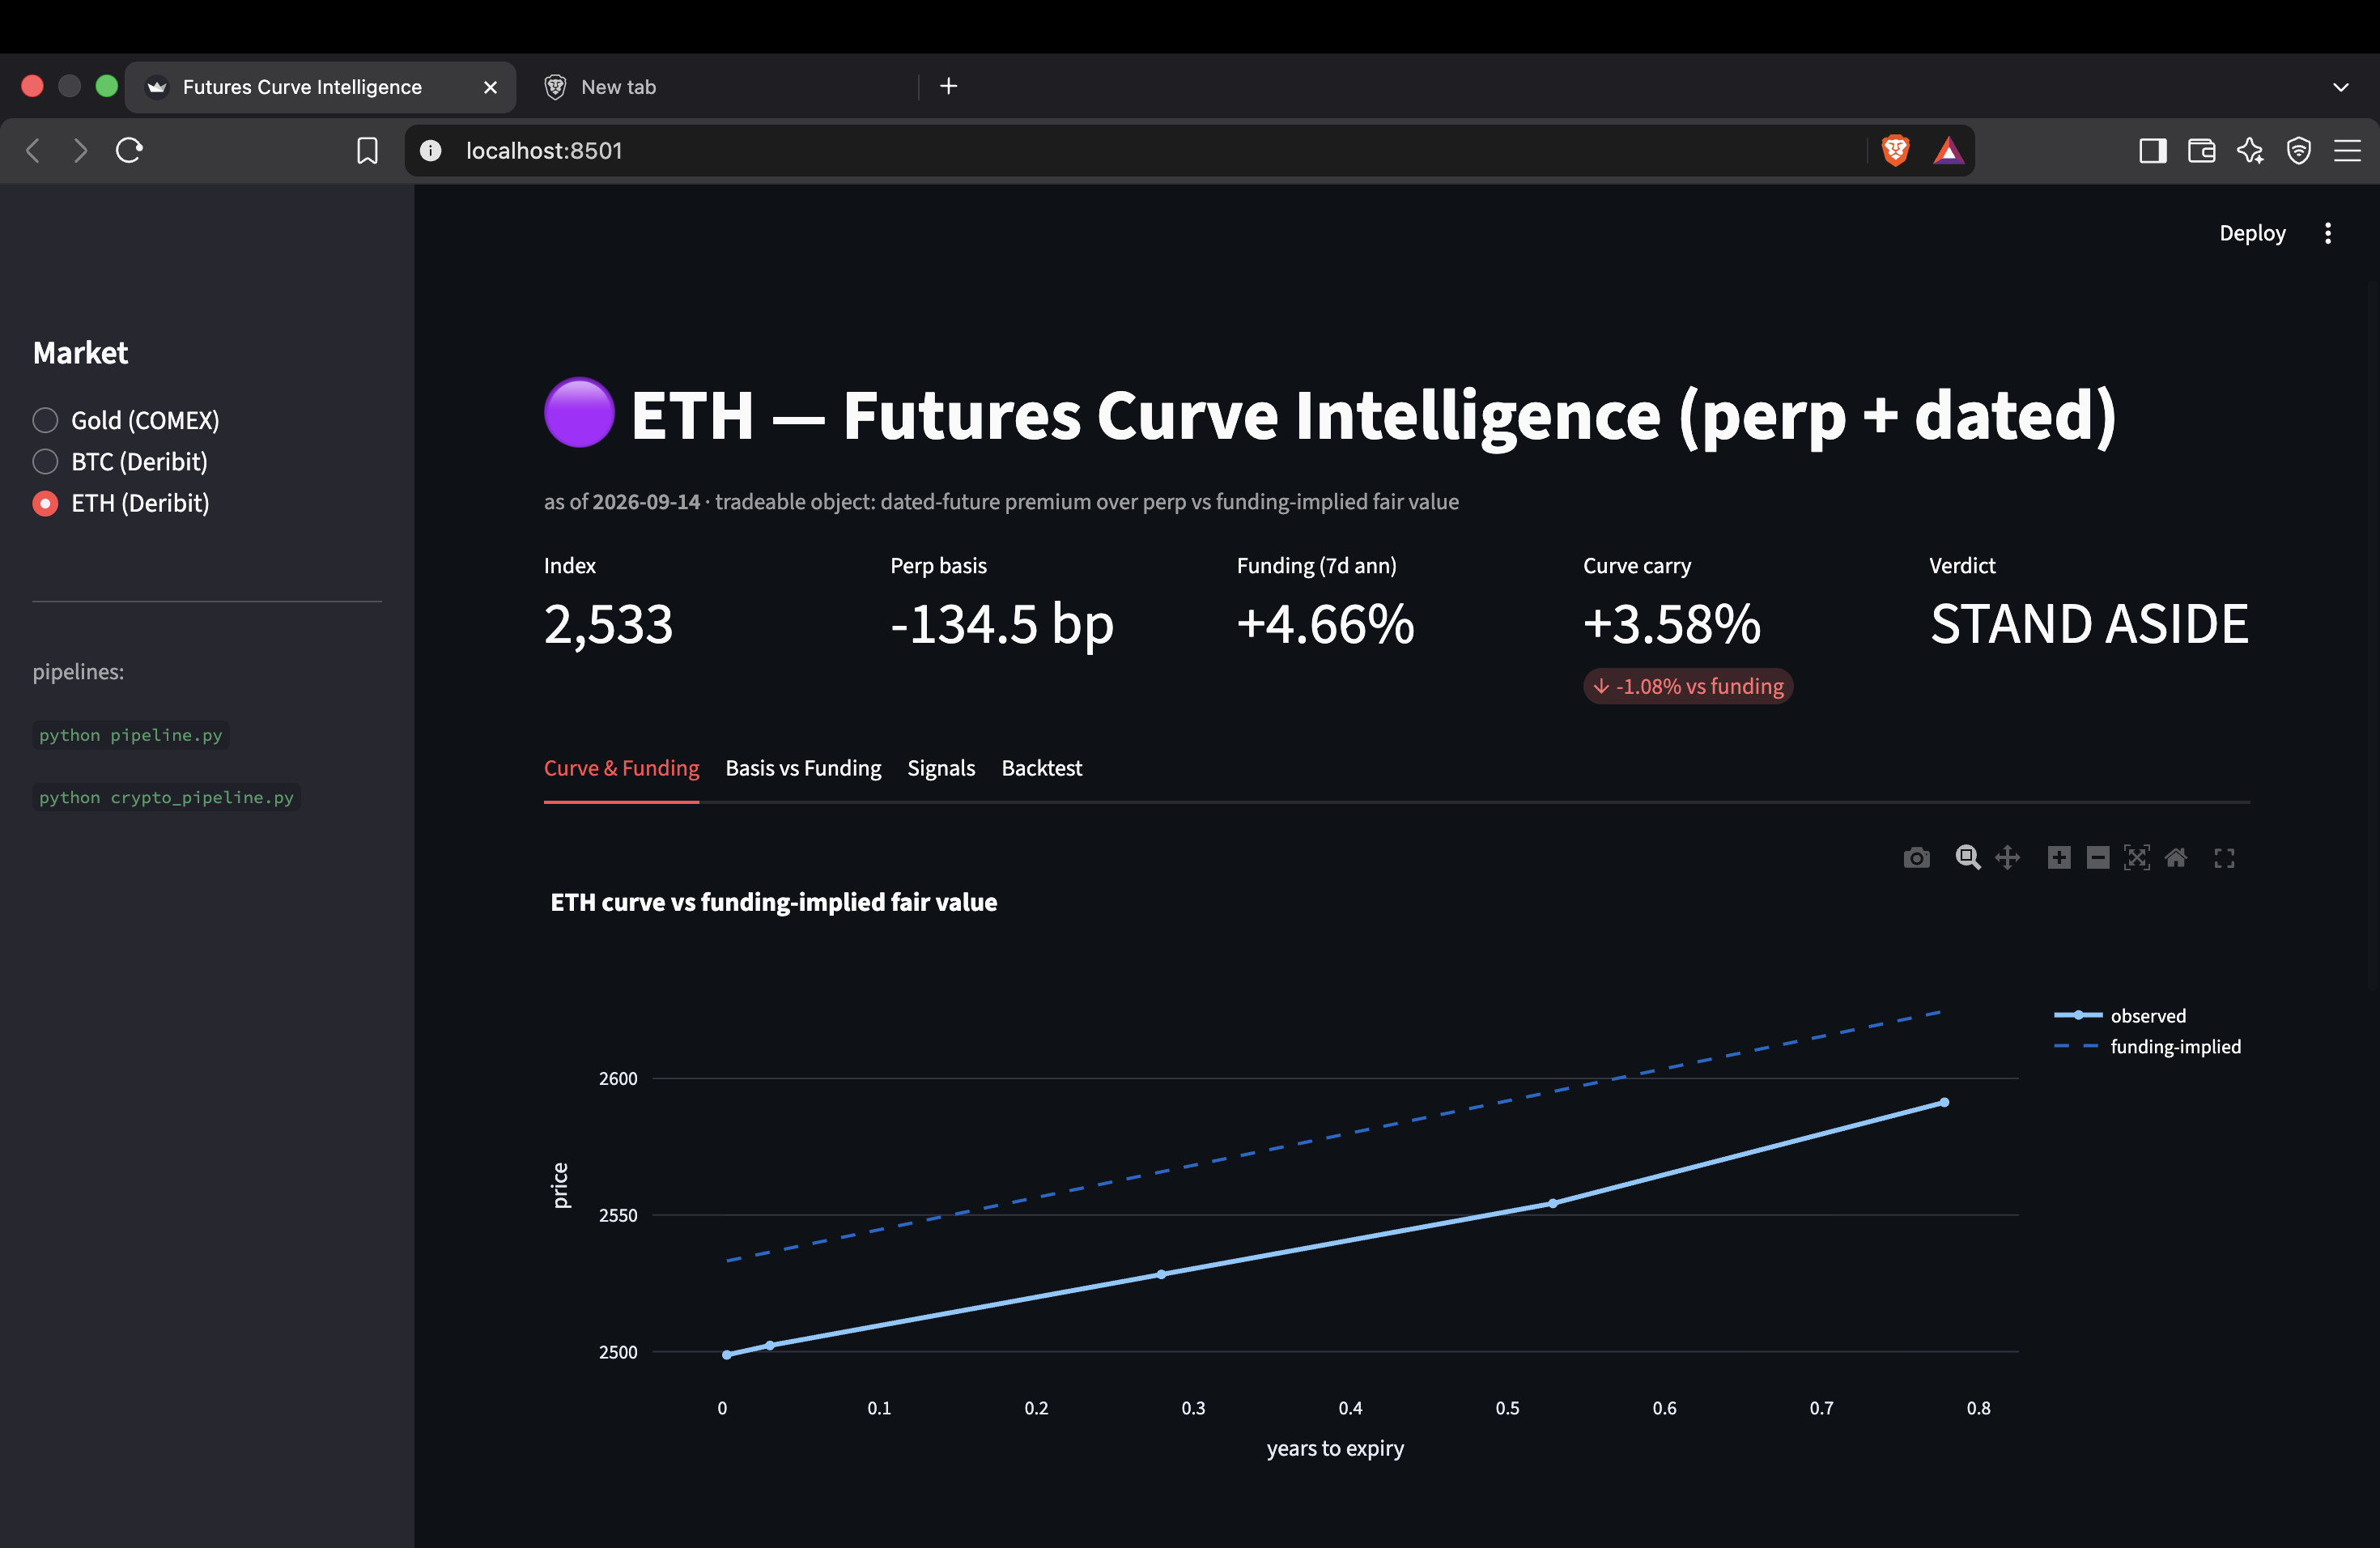
The curve stayed within roughly 0.5% of funding-fair value.
There was therefore very little opportunity, and the gated strategy was nearly flat.
Again, the system did not try to manufacture trades just to produce a better-looking result.
Challenges I Faced
One of the first challenges was finding a reliable free spot-gold data source.
Yahoo's XAUUSD=X was no longer available, while another source had a bot wall.
So instead of forcing a bad data source into the system, I used the nearest futures contract as the anchor and calculated the features between futures contracts.
Another major problem was a false-positive signal.
At one point, my z-score was telling me that gold calendar spreads were unusually wide.
But the market was not actually mispriced.
Financing rates had genuinely increased, and my rolling-average benchmark was simply too slow to adapt.
That failure led me to add z_fair, which measures the deviation against the fitted cost-of-carry curve instead of only comparing it with the historical average.
I also had a problem with overtrading in crypto.
My first backtest looked very good because it traded almost every positive basis.
But when I extended the test and included fees and funding costs properly, I found that the strategy could actually lose money.
That taught me that a strategy can look profitable before realistic costs are included.
The filter, rather than simply harvesting the basis, was what made the Bitcoin results much more meaningful.
Finally, the datasets are still relatively small — around 241 trading days for gold and about 400 days for crypto.
So I deliberately kept the models simple and regularised.
I also make it clear in the project that these results are in-sample and not statistically significant yet.
What I Learned
The biggest thing I learned is that a statistical deviation is not automatically a trading signal.
A z-score can tell me that something is unusual.
It cannot tell me by itself that something is mispriced.
For example, gold calendar spreads had a reversion probability below 50% in every z-score bucket I tested.
They tended to continue moving instead of reverting.
That was a good reminder that assumptions have to be tested rather than believed.
I also learned that "no trade" can be a valuable result.
A system that avoids a bad trade can be more useful than a system that constantly produces signals.
Another important lesson was the importance of realistic costs.
Fees, slippage, and funding are not something that should be added at the very end.
They can completely change whether a strategy actually works.
What's Next
There are several things I want to improve next.
I want to add more markets such as Silver, NIFTY, and BANKNIFTY using the same adapter system.
I also want to add a PCA factor model because the current data suggests that one dominant factor is driving many of the gold calendar spreads together.
For Bitcoin and Ethereum, I want to collect longer histories covering more funding-rate regimes.
That would allow me to calculate proper confidence intervals instead of relying on a single period.
Finally, I want to connect the monitor to paper trading and send alerts through platforms such as Slack or Telegram.
Final Note
This project is a research and decision-support system, not investment advice.
The current results are based on approximately one year of in-sample data and have not been validated as a live trading track record.
The main thing I wanted to build was not a machine that always says "buy" or "sell."
I wanted to build a system that looks at the data carefully and is willing to say:
"There is no trade here."
And I think that is one of the most important parts of quantitative research.
Built With
- backtesting
- btc
- clustering
- costofcarry
- datavisualization
- derivative
- eth
- financialai
- fintech
- gold
- gradientboosting
- machine-learning
- python
- quantitativefinance
- streamlit

Log in or sign up for Devpost to join the conversation.