-
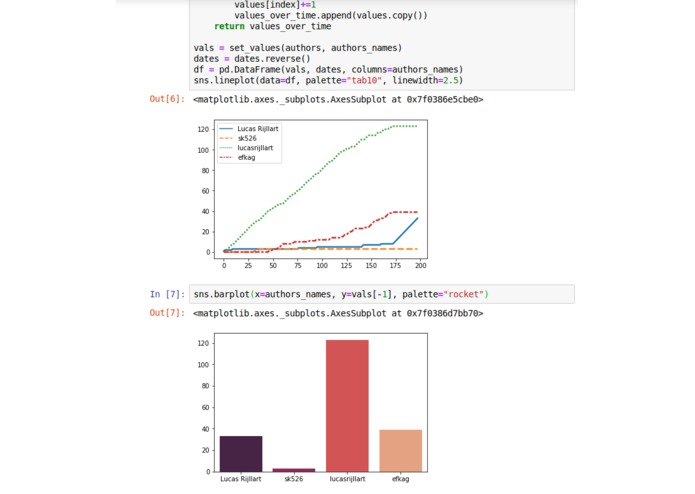
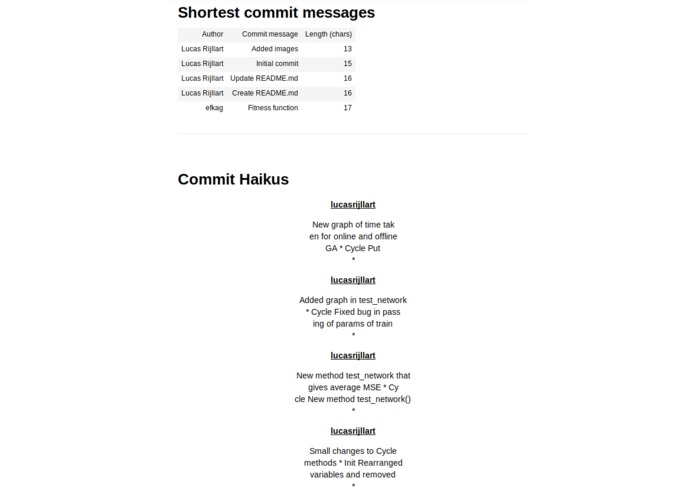
Graphs
-
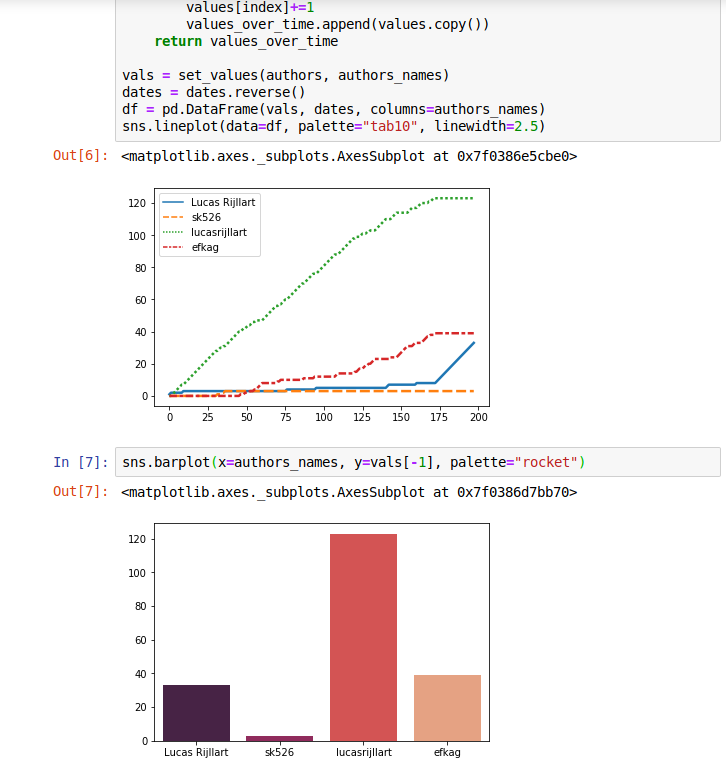
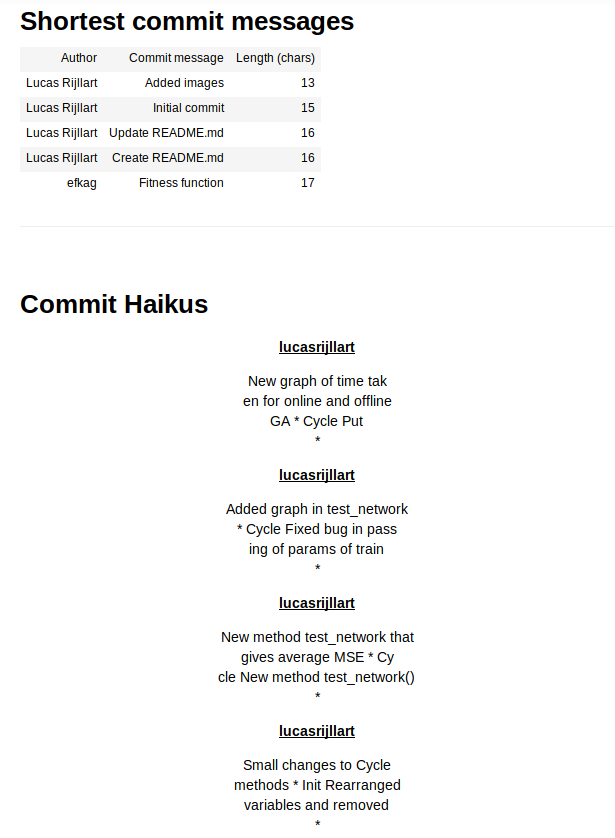
Stats
Inspiration
We wanted to display fun github-usage related statistics with weekly awards such as "shortest commit message of the week", "largest commit diff of the week", and more... As a fun little look-back on how the week has gone.
How we built it
Using python jupyter notebooks and a few libraries to extract github statistics from a repository.
Challenges we ran into
- Understanding how the github data was structured
- Formatting this data into graphs
- Extracting syllables from words
- Creating sentences with a select number of syllables, which breaks words apart
Accomplishments that we're proud of
- Nice looking graphs of github usage in a repo
- Funny stats based on commits
Built With
- jupyter
- python


Log in or sign up for Devpost to join the conversation.