-
-
One-pager Explanation
-
Time Series Analysis + Visualizations
-
API

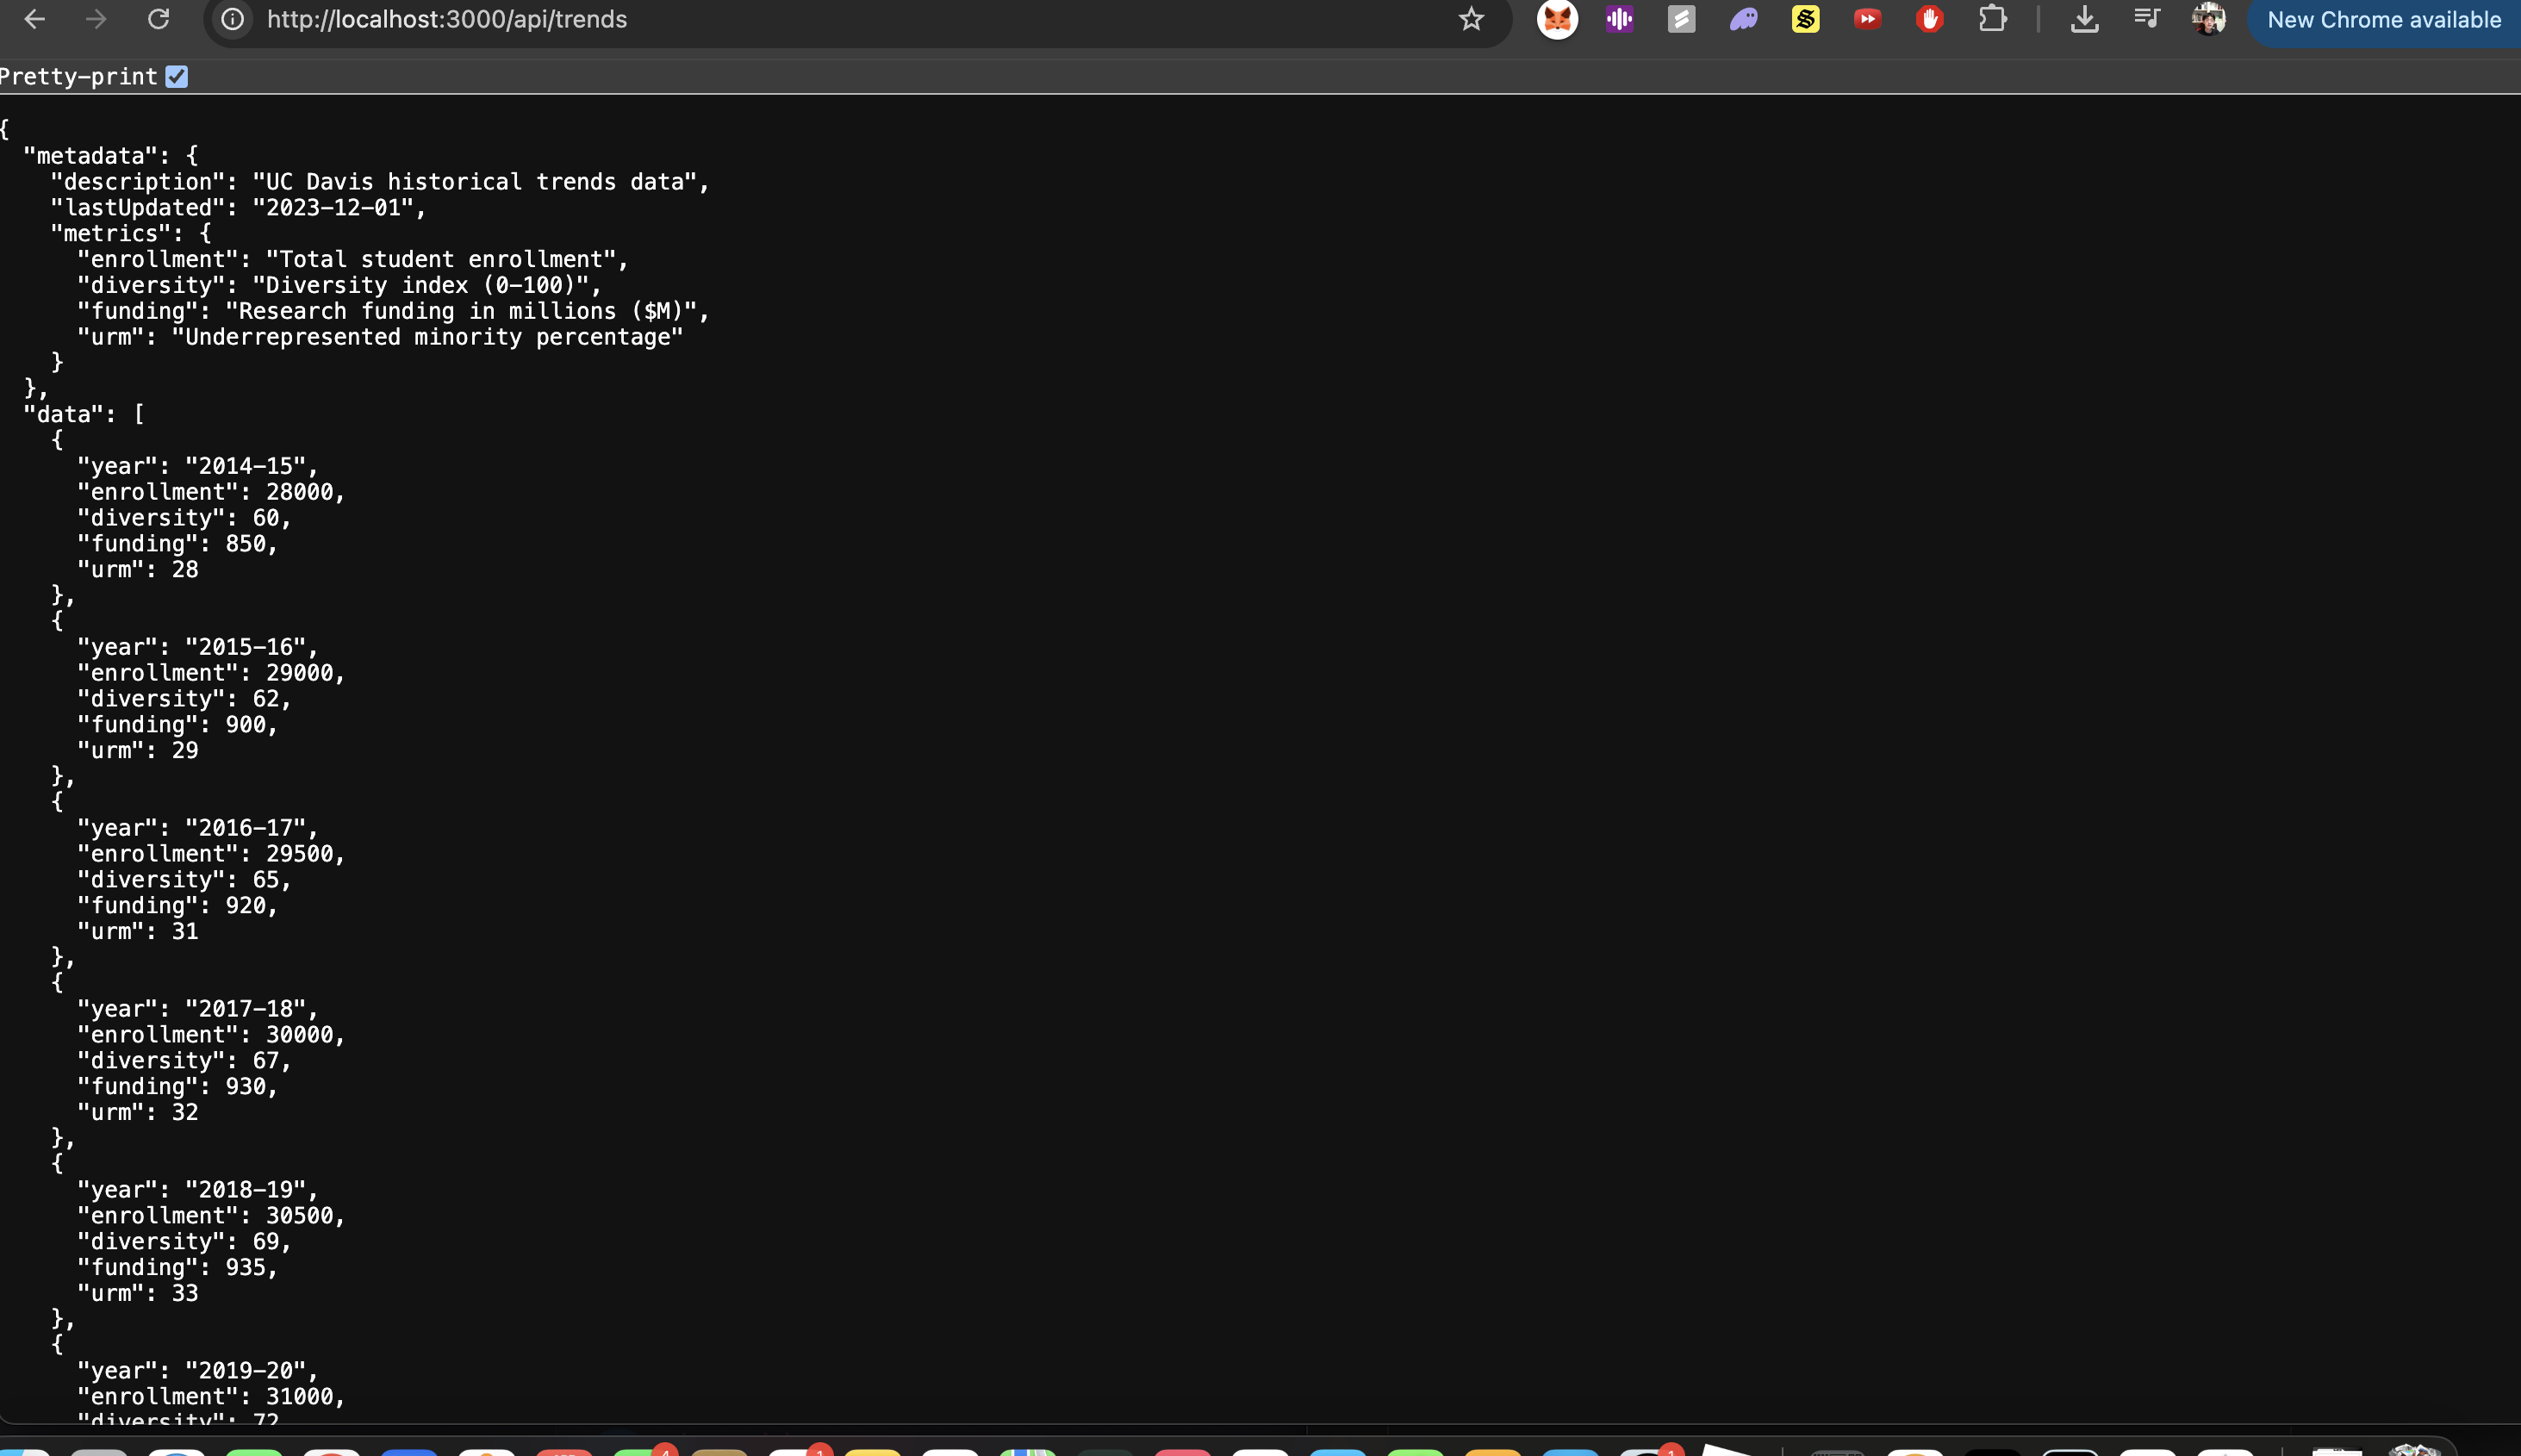
Inspiration
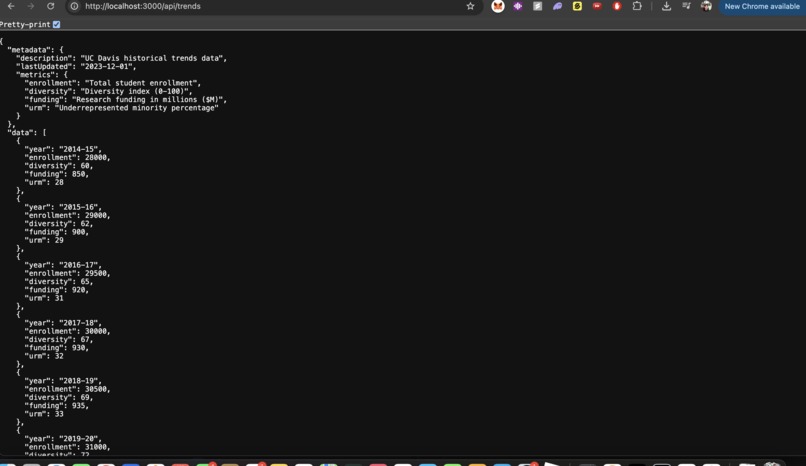
I got the inspiration after seeing how some of the datasets of UC Davis demographics were hard to access, read and interpret. I decided to make a central platform that provides both intuitive visualizations, insights and also created a public API around the data -- allowing other researchers and developers to easily query the data they want and eliminate the need to parse the original data manually.
What it does
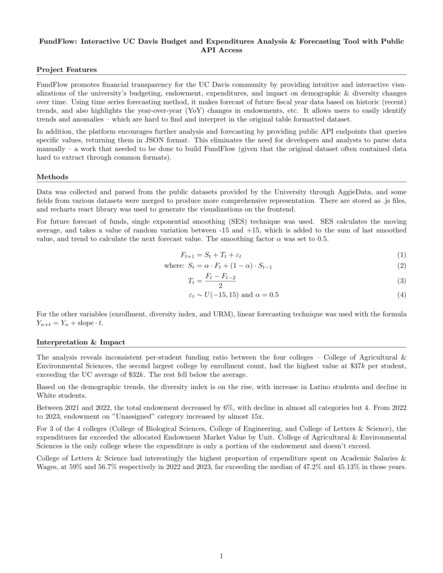
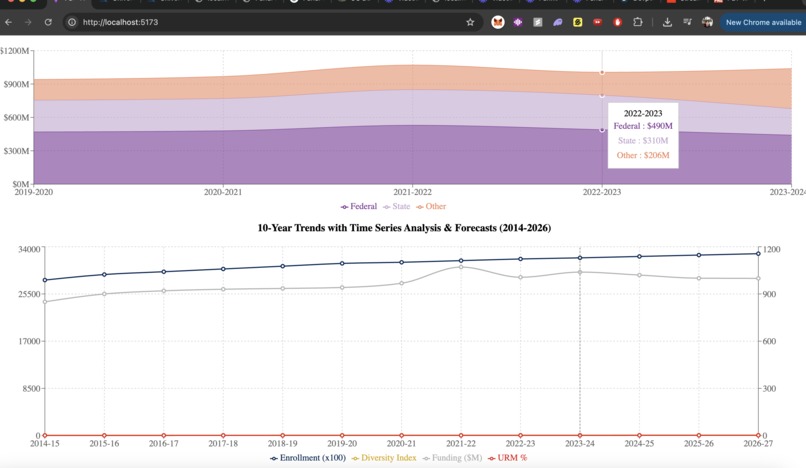
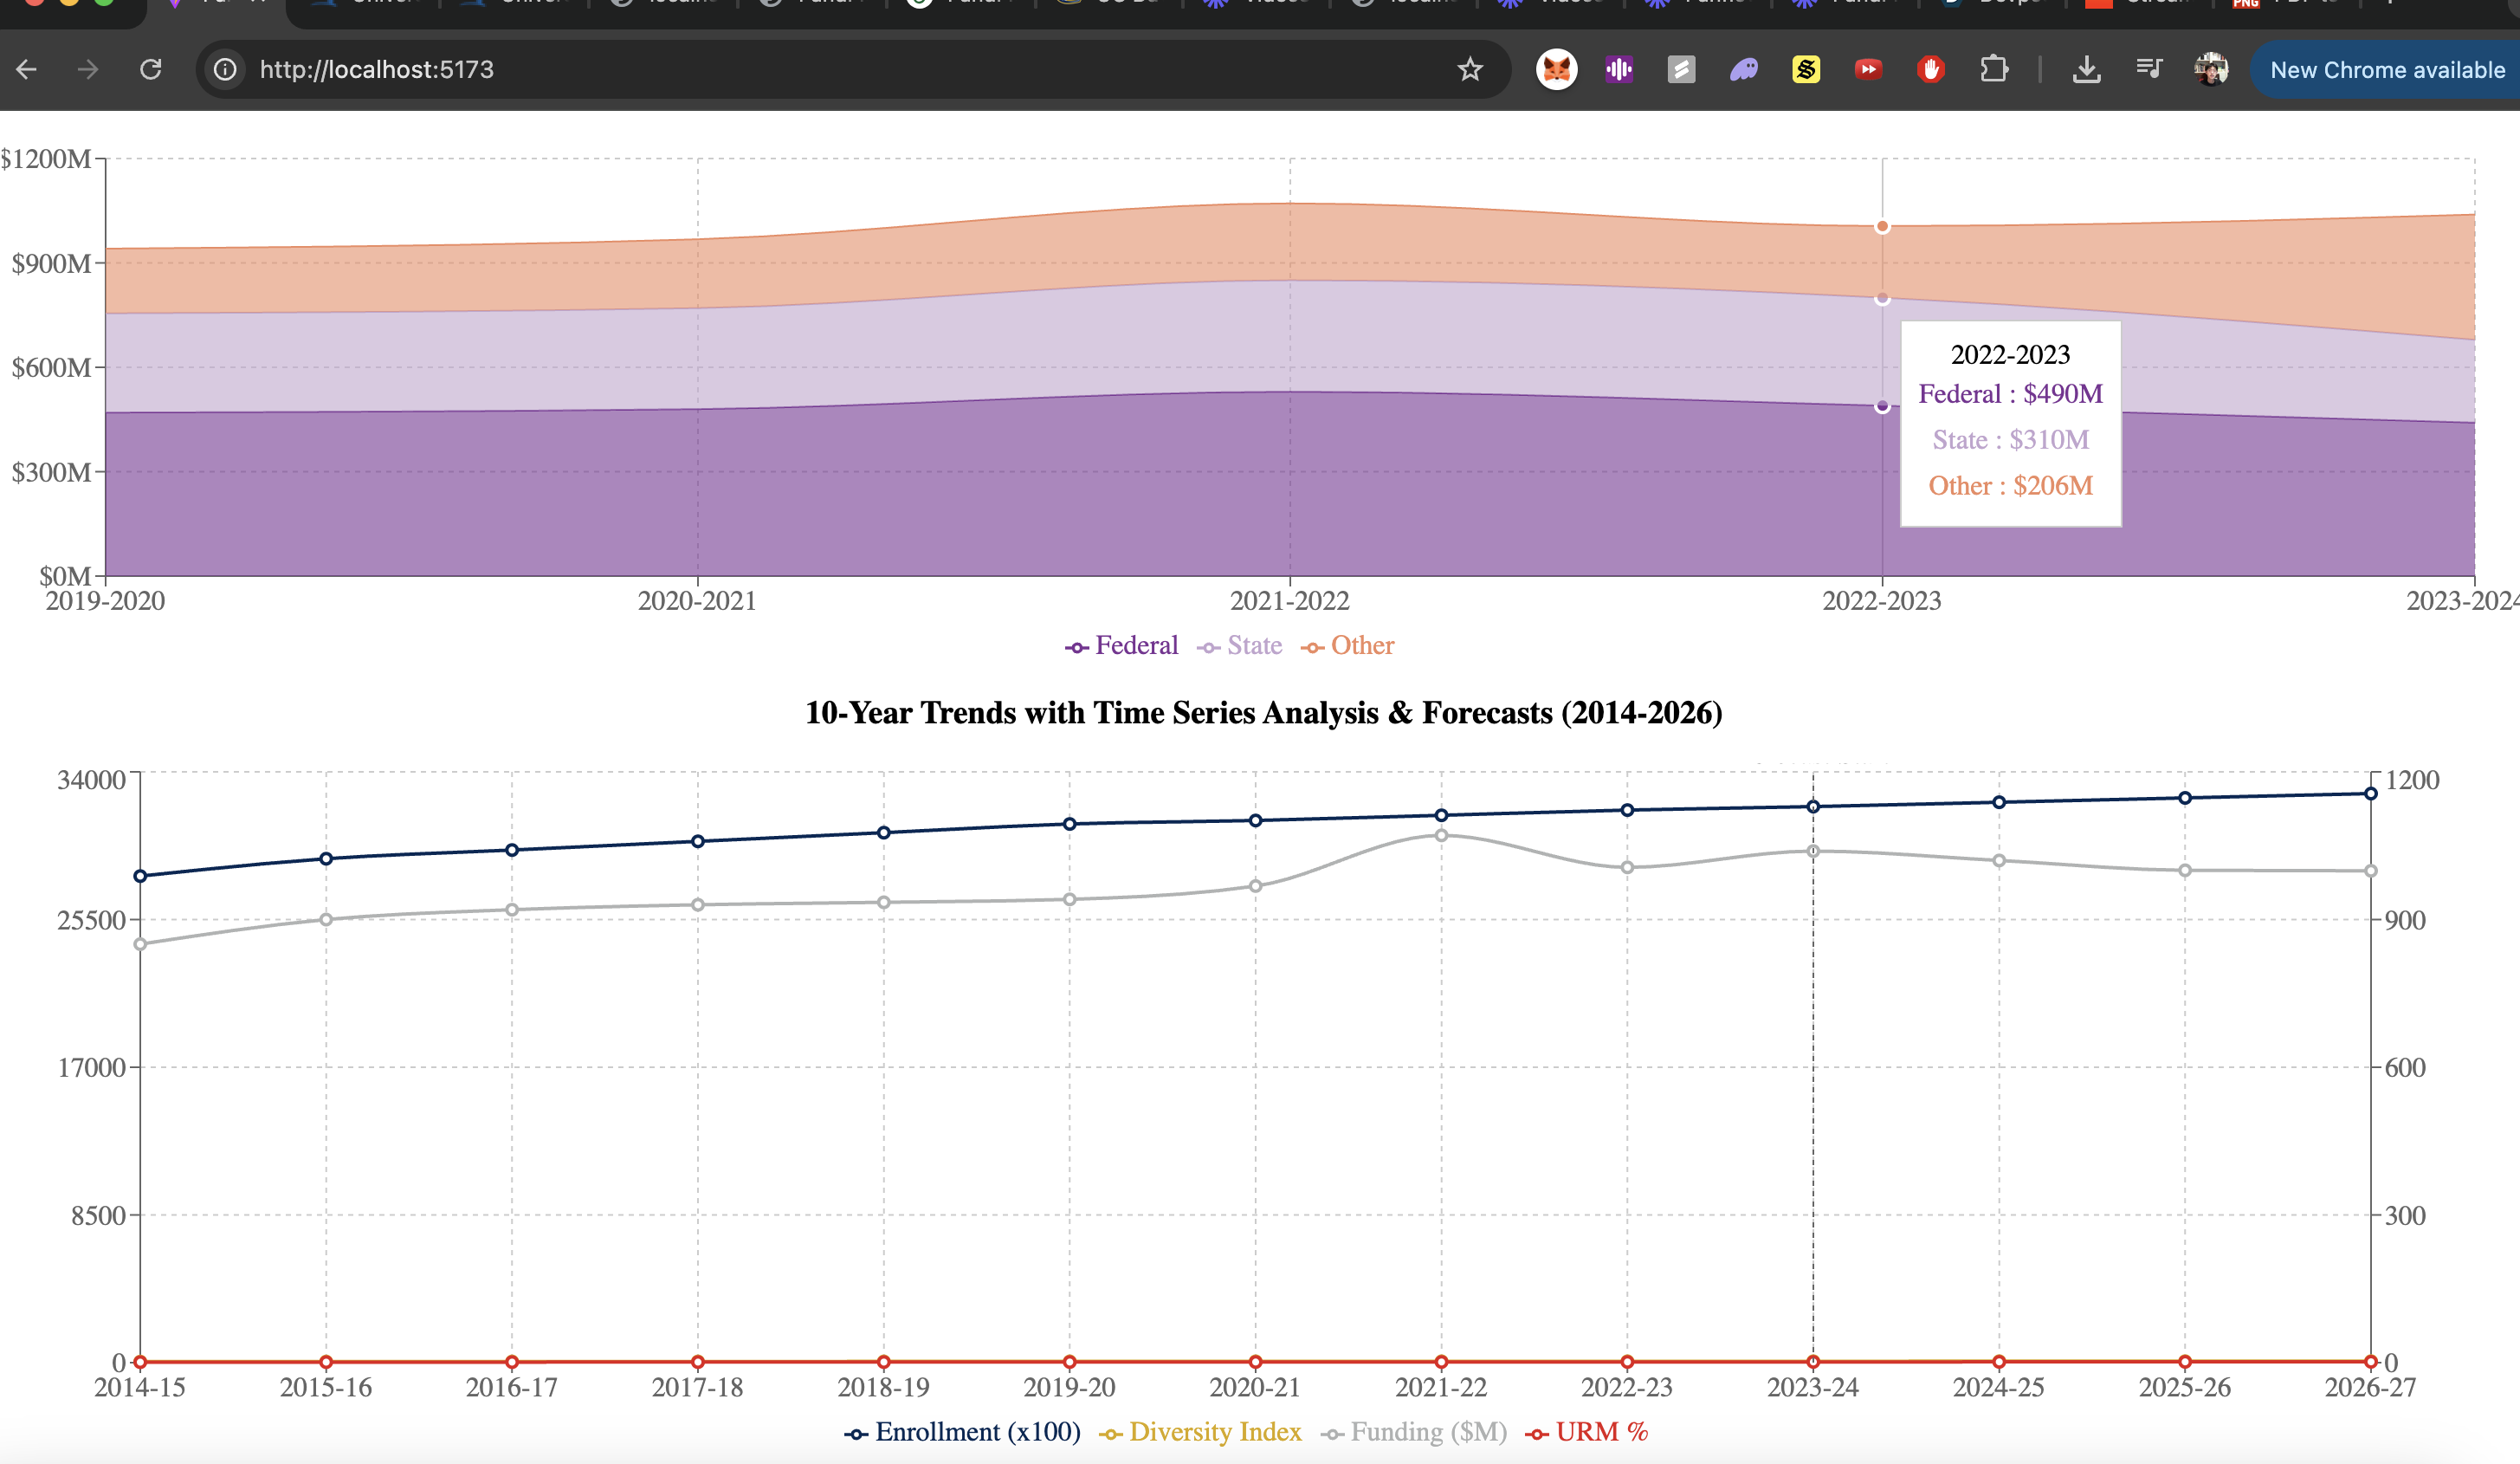
FundFlow is an interactive platform that shows analytical insights on UC Davis budgets, expenditures and YoY changes in these values, as well as impact on demographic /diversity and other variables. It pulls data from various sources to compare the endowment breakdown within each of the 4 colleges, how the per-student funding different and compares to UC average, and makes time-series analysis with forecast to give projections on average rate of fund increase and etc.
How we built it
I built this platform by first collecting the data from the dataset and parsing them into a readable format. Then, I merged some of the data that makes the representation logical and ran a time series analysis with Simple Exponential Smoothing technique, as well as regression model. I also created meaningful charts and graphs that show change in values over time and also show breakdown of fund allocation. I also wrote down insights which the user may find helpful. I added another page called "voting", where users are able to vote on ideas/questions surrounding fund use by the school.
Challenges we ran into
I found it challenging at first to set up recharts correctly to be able to render the visualizations on screen from the javascript data source.
Accomplishments that we're proud of
I am proud of the meaningful insights that I was able to make from the data and how I was able to communicate my findings in my demo video. I am proud of being able to use the techniques learned in economics class and apply them in a technical manner to combine skills in both Computer Science and Economics.
Built With
- javascript
- react
- recharts

Log in or sign up for Devpost to join the conversation.