-
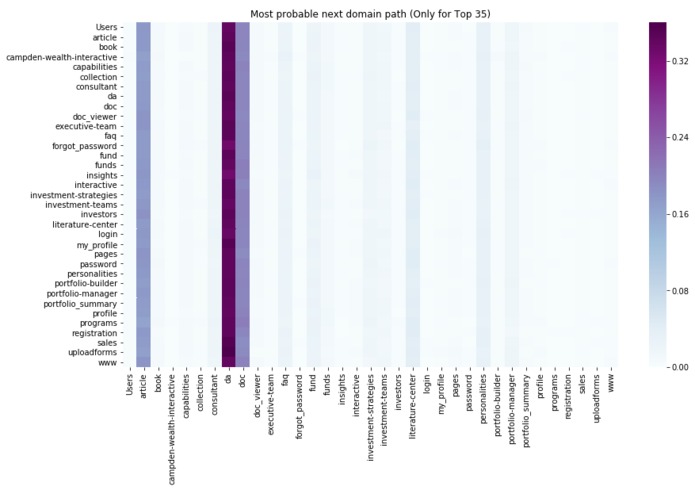
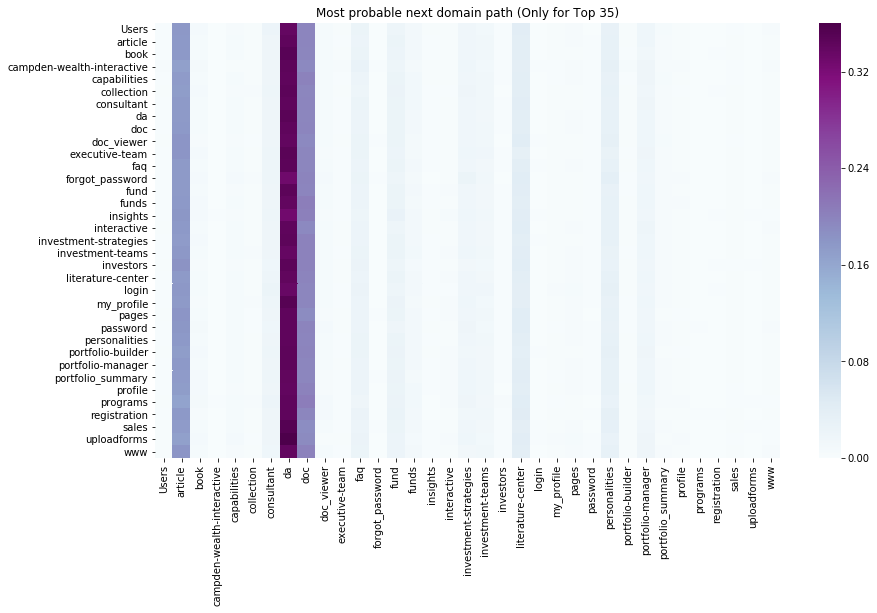
Most probable next domain path (heatmap clustering)
-
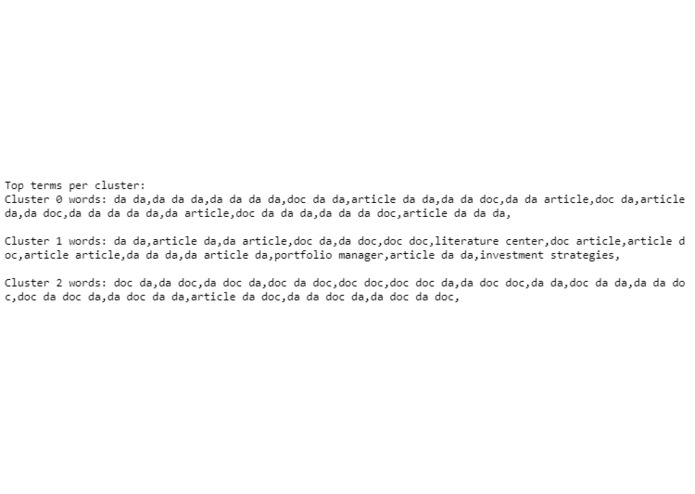
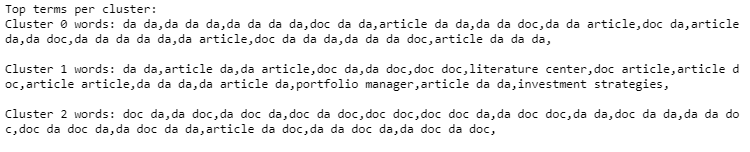
Top terms per cluster
-
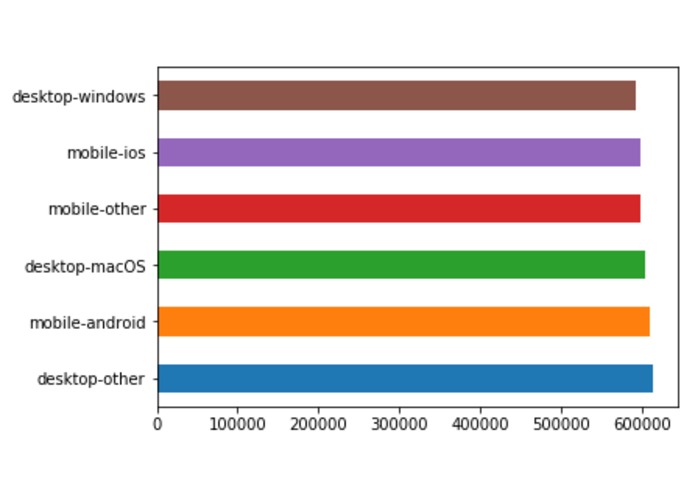
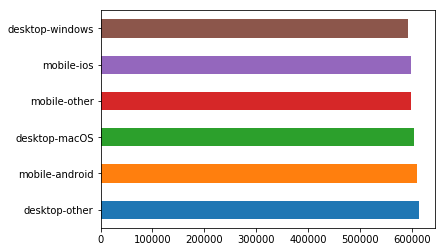
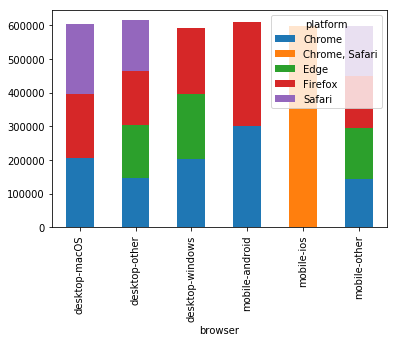
Statistics for Platform Usage
-
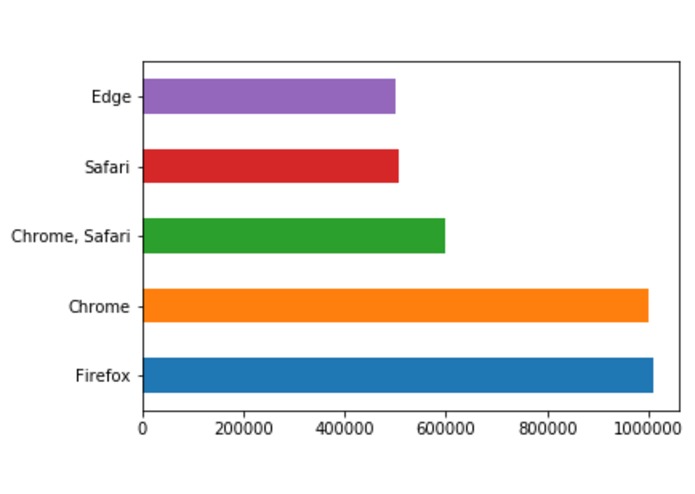
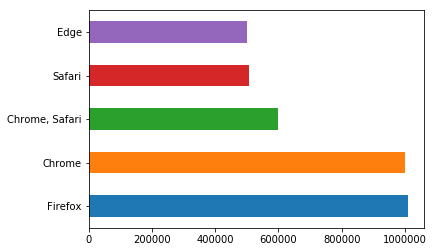
Statistics for Browser Usage
-
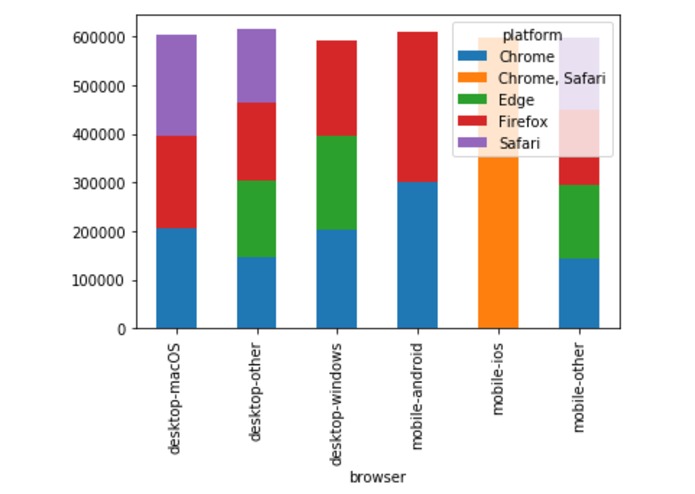
Users and Browsers based on Visitor IDs
-
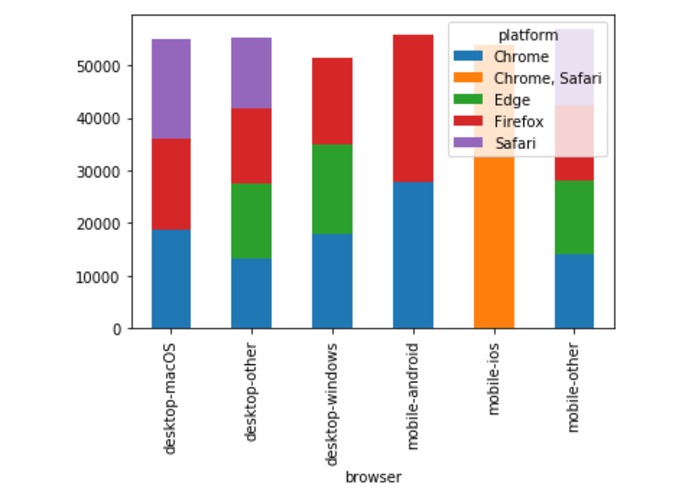
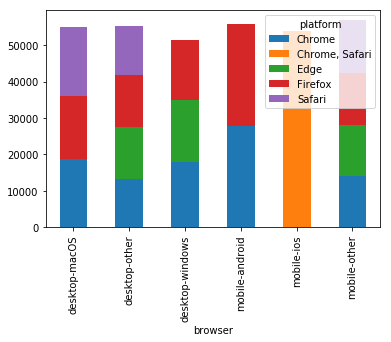
Users and Browsers based on User IDs (Registered Users)
-
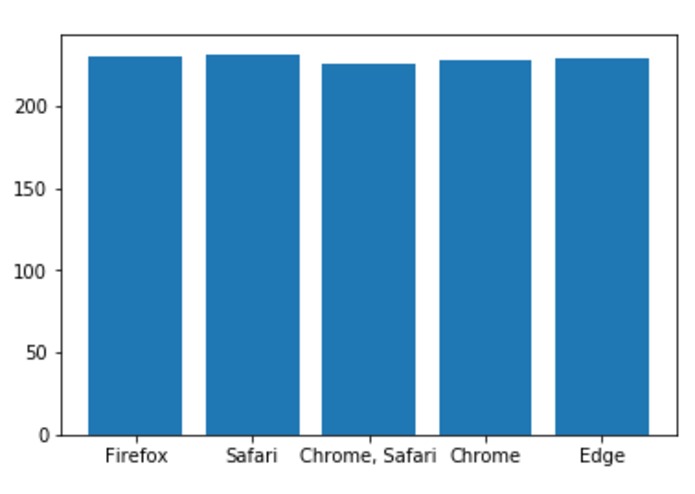
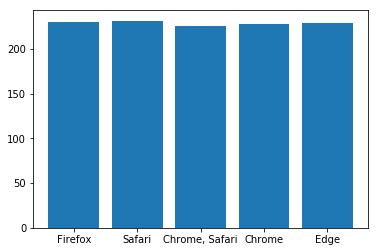
Average time spent per browser per user (in s)
-
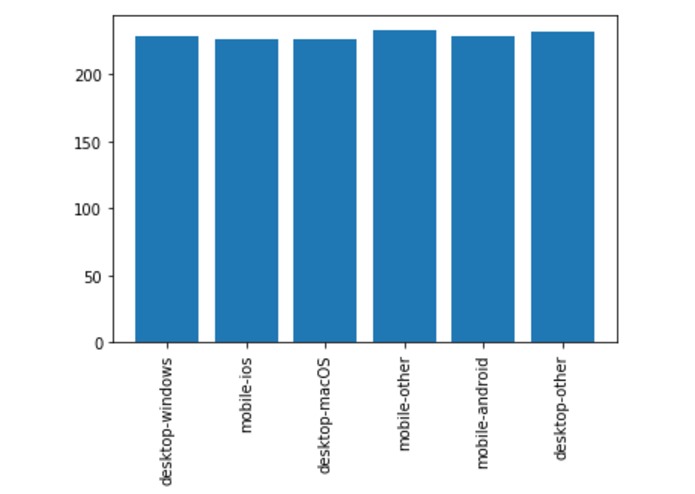
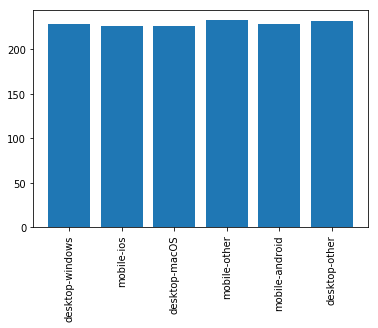
Average time spent per platform per visitor (in s)
Inspiration
Big Data!!! The prospect of dealing with anonymous user behavioral data and having to make sense of it, find a pattern/insights and develop cluster(s).
What it does
Tracking of user behavior across various paths of the website and subsequent determination of the most probable next domain path, behavioral statistics like usage of and average time spent across platforms and browsers.
How we built it
We used Jupyter notebook distribution and various Python libraries to load up and work on the data, after which clustering was done using Heatmap and K-means of n-grams of all sequences.After sorting each user's behavior across the webpage by the given timestamp values, we tried to deduce most common sequence of webpage access for each visitor., i.e., each visitor is mapped to his own sequence of webpage access.
Challenges we ran into
Making sense of and getting the usable timestamps, data cleaning (webpage column).
Accomplishments that we're proud of
Deducing that the integer values given in the webpage column were, in fact, an optimization method (reduction in dataset size) and were repetitions of previously listed webpage links! Also, analysing data, finding out patterns and explaining behavior.
What we learned
Various clustering methods, user behaviour patterns, webpage creation and design
What's next for Fun(d) Chronicles!
With ~3 million rows of data and more time, we would love to be able to analyze them more, find out more and deduce more detailed behavioral patterns!


Log in or sign up for Devpost to join the conversation.