-
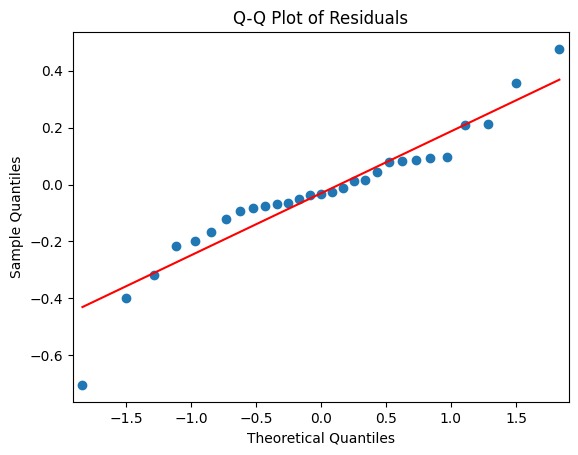
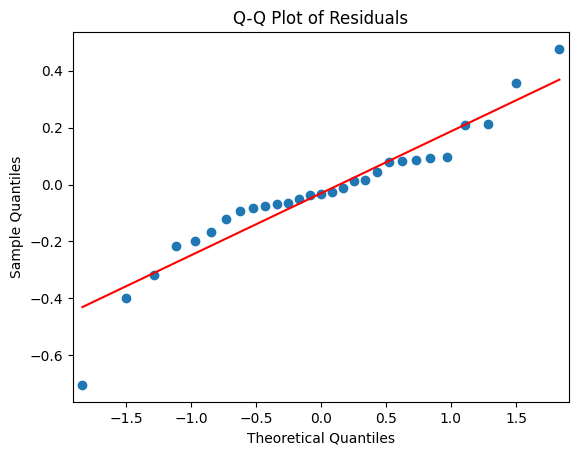
Checking for Normality for Linear Regression Machine Learning Model of the Residuals for Development of Relationship Between Variables
-

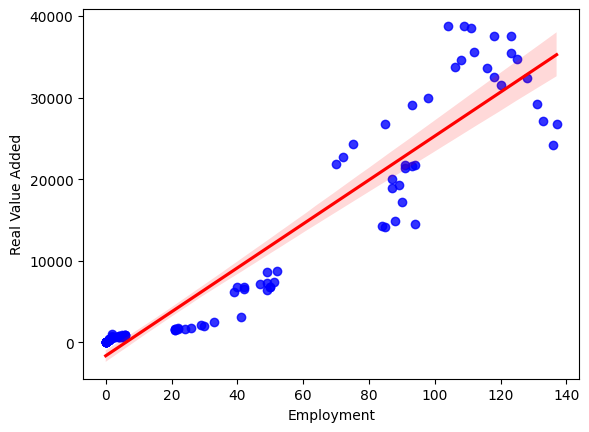
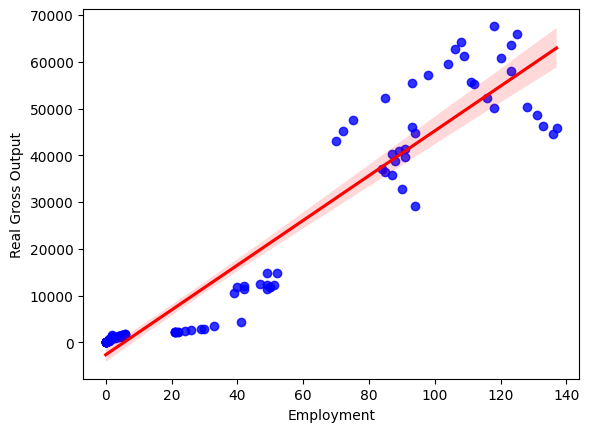
Real Value Added (in millions of dollars) vs Employment (in thousands) to Determine Linear Relationship for Machine Learning Predictions
-
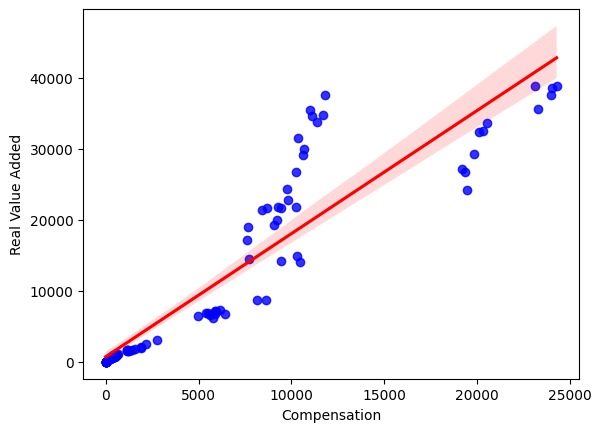
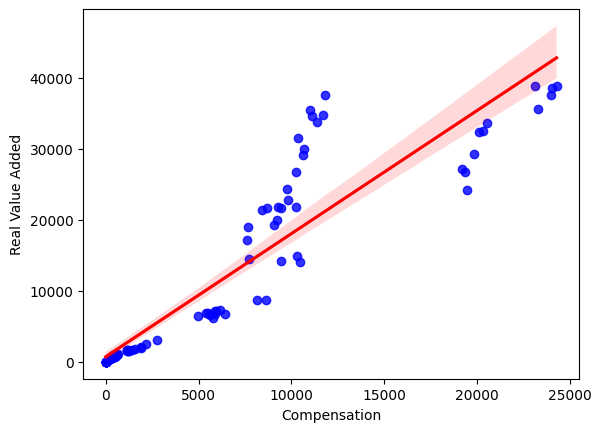
Real Value Added (in millions of dollars) vs Compensation (in thousands) to Determine Linear Relationship for Machine Learning Predictions
-

Real Gross Output (in millions of dollars) vs Compensation (in thousands) to Determine Linear Relationship for Machine Learning Predictions
This project examines the output that workers produce given a certain compensation. What inspired us was quantifying areas of growth opportunity within private sectors of the space economy to help both workers and output. Certain workers within the space economy are well known – astronauts and rocket engineers – but there are many members of different industries that are just as important. Understanding how compensation directly impacts real gross output by industry helps to support the continued investment and contribution space workers provide.
We built our project mainly through Python and Tableau, where the largest chunk of our analysis consisted of a predictive regression model that measured log total gross output given compensation, alongside year to account for timeseries data. We conducted exploratory data analysis to confirm outcome potential and confirm certain regression assumptions (for example linearity). We also examined through visualizations more assumptions that must be met (normality, heteroskedasticity, and mean zero residuals) and trends in output.
Some of the challenges that we faced included cleaning and processing data, interpreting results, and ensuring reasonable scope. We learned how to formally take an idea and transform it into a larger analysis through varied approaches within a limited time frame.

Log in or sign up for Devpost to join the conversation.