Inspiration
I have use data tools before and attempted data science langauge however I alway found them a bit to complex or tedious, I designed this application to reduce the barrier of knoledge require to get readily useable data
What it does
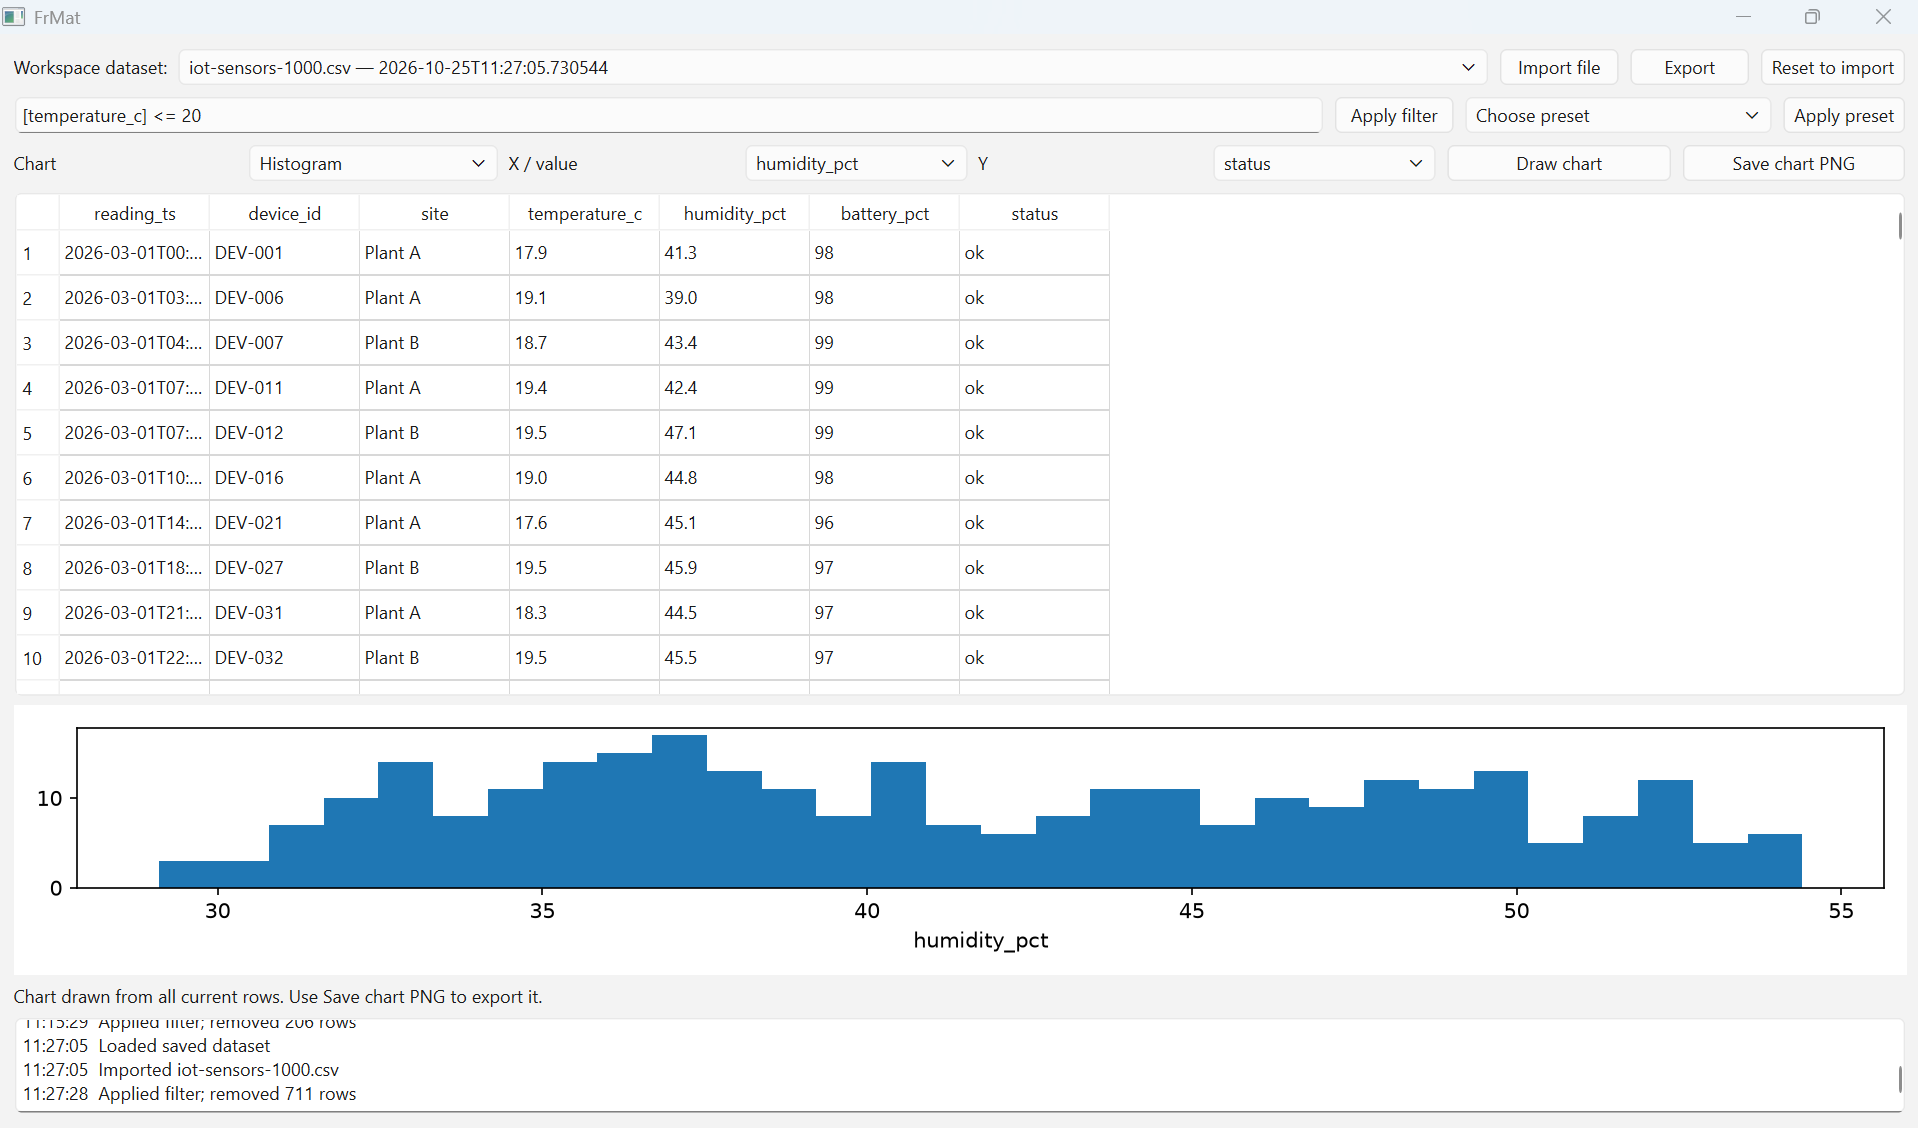
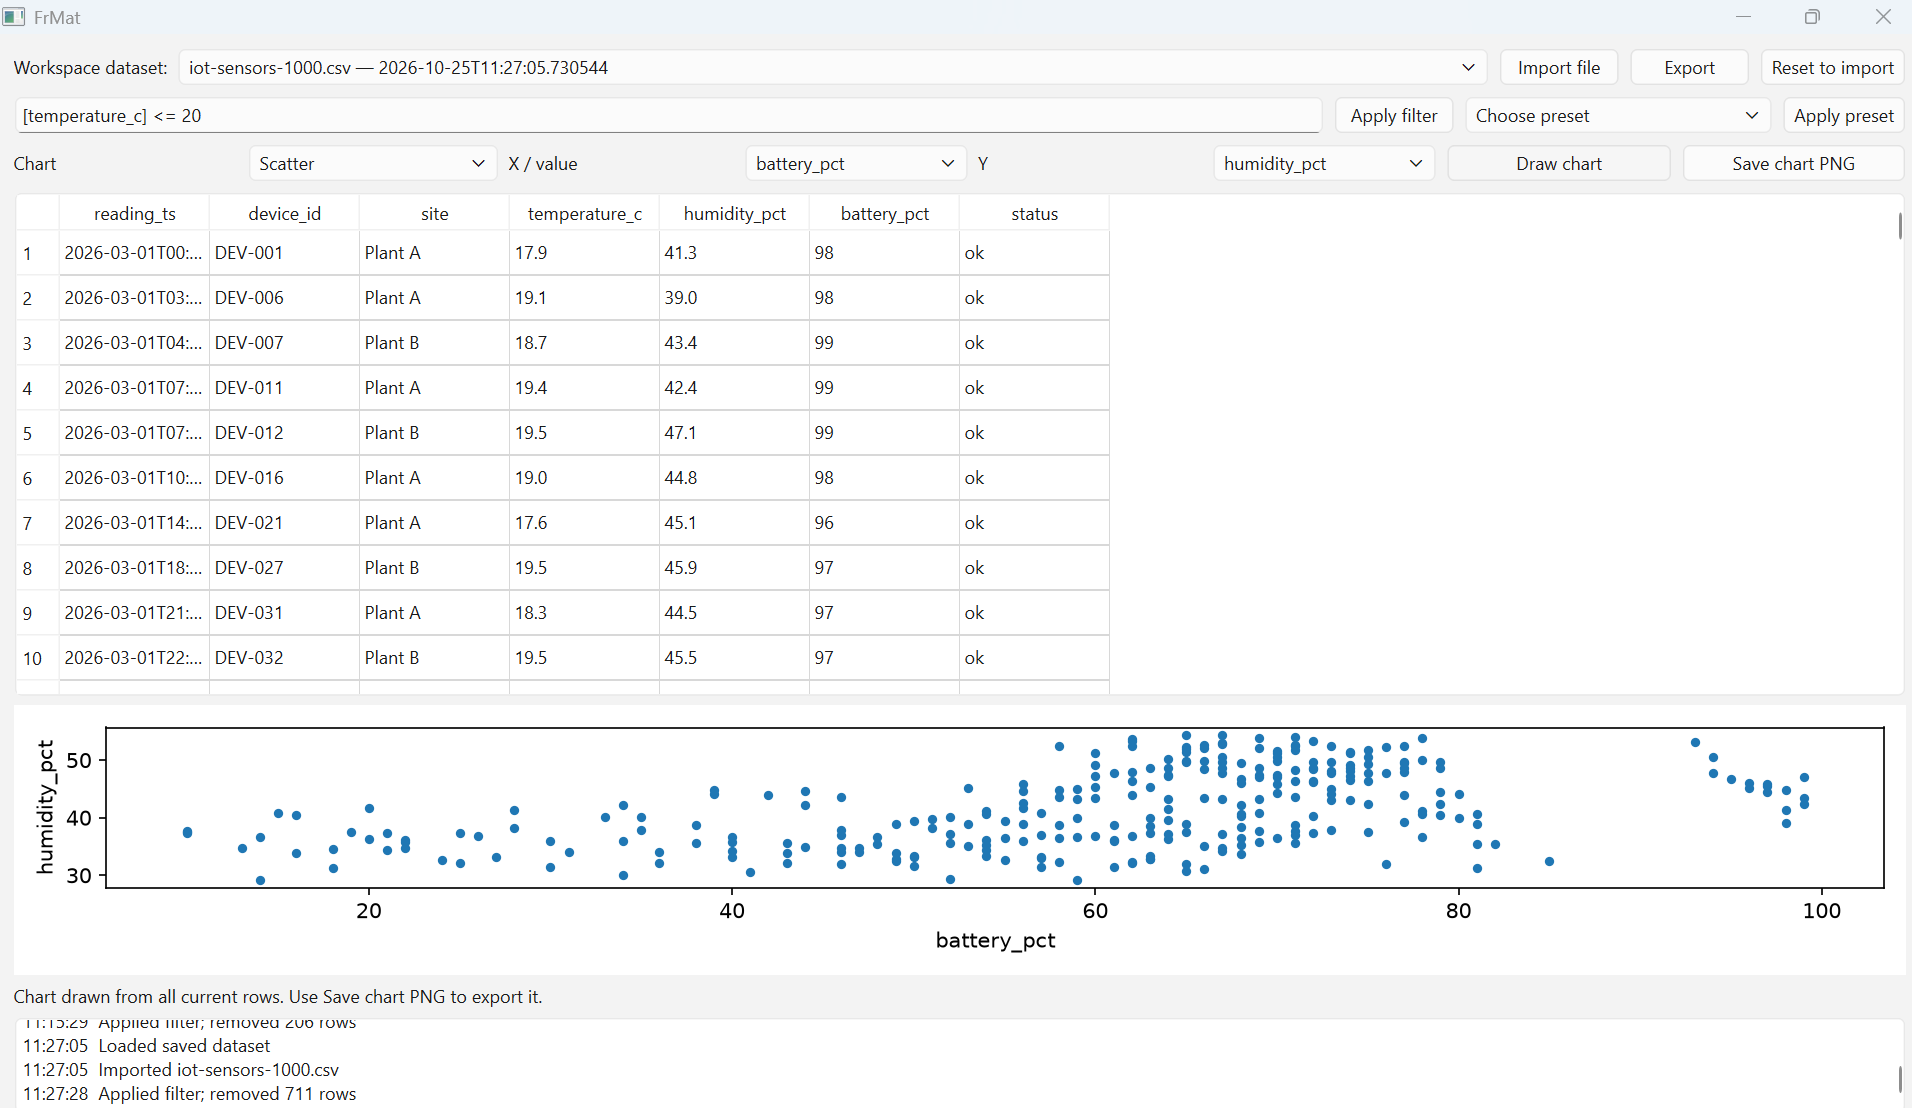
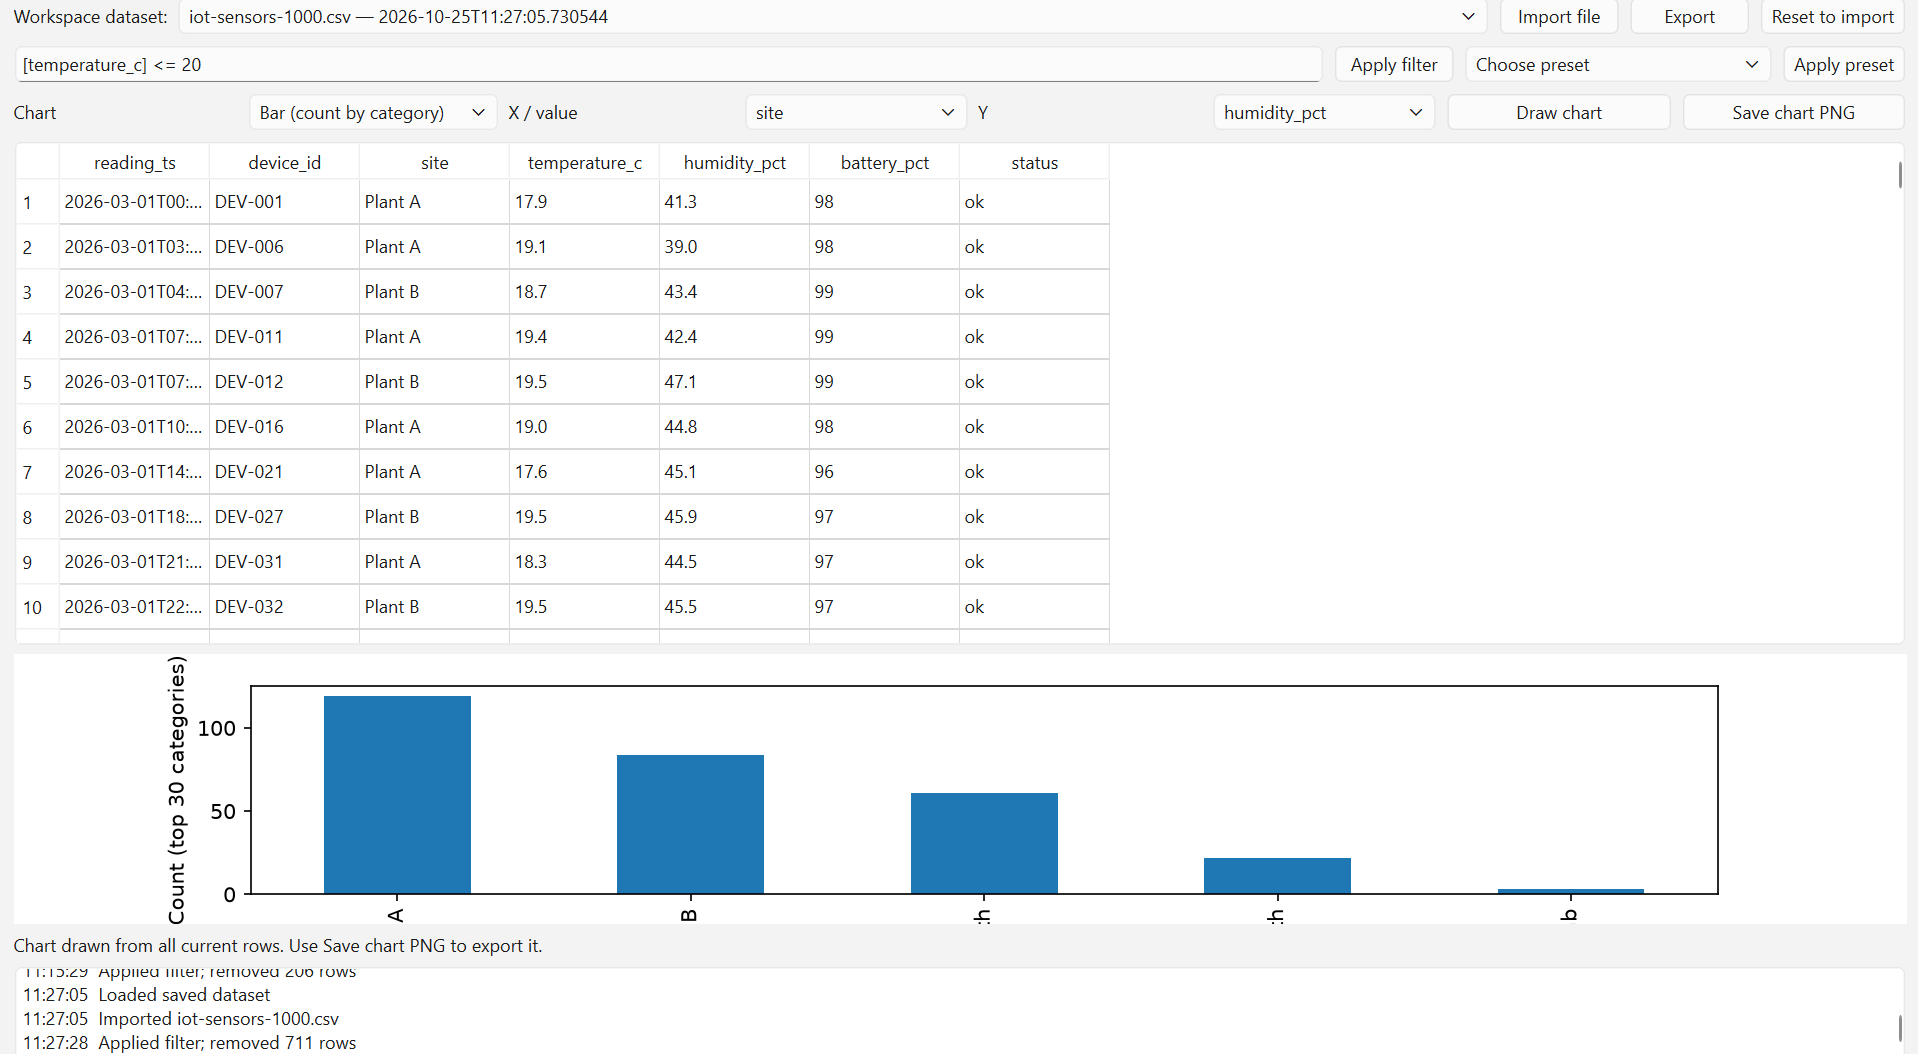
It works in two diffrent directions based on choosen direction. Direction one - data proccesing, analysis, formating and filtering. Direction two - data presentation and imporving readability.
How we built it
Using cluade to build the base code and working with github to make the applicaton usable
Challenges we ran into
A problem that can up was restrictions on the values that could be used to make the graph.
Accomplishments that we're proud of
Creating a UI that is relativly simplistic to use not needing large amounts of experties The ability to import and export data in various formats
What we learned
Learned how to use AI to build a application Learned how to create a github release
What's next for FrMat
Implement the ability to hide certain columns or rows make pre-made filters rather than users needing to devise their own. Imporve and fix problems with line graphs

Log in or sign up for Devpost to join the conversation.