-
-
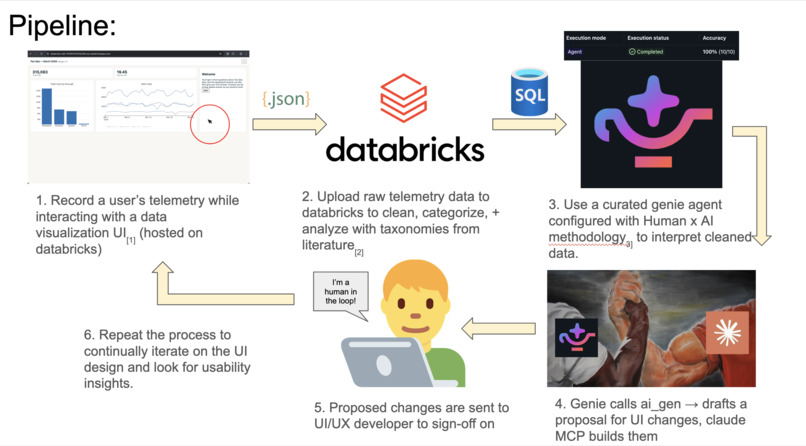
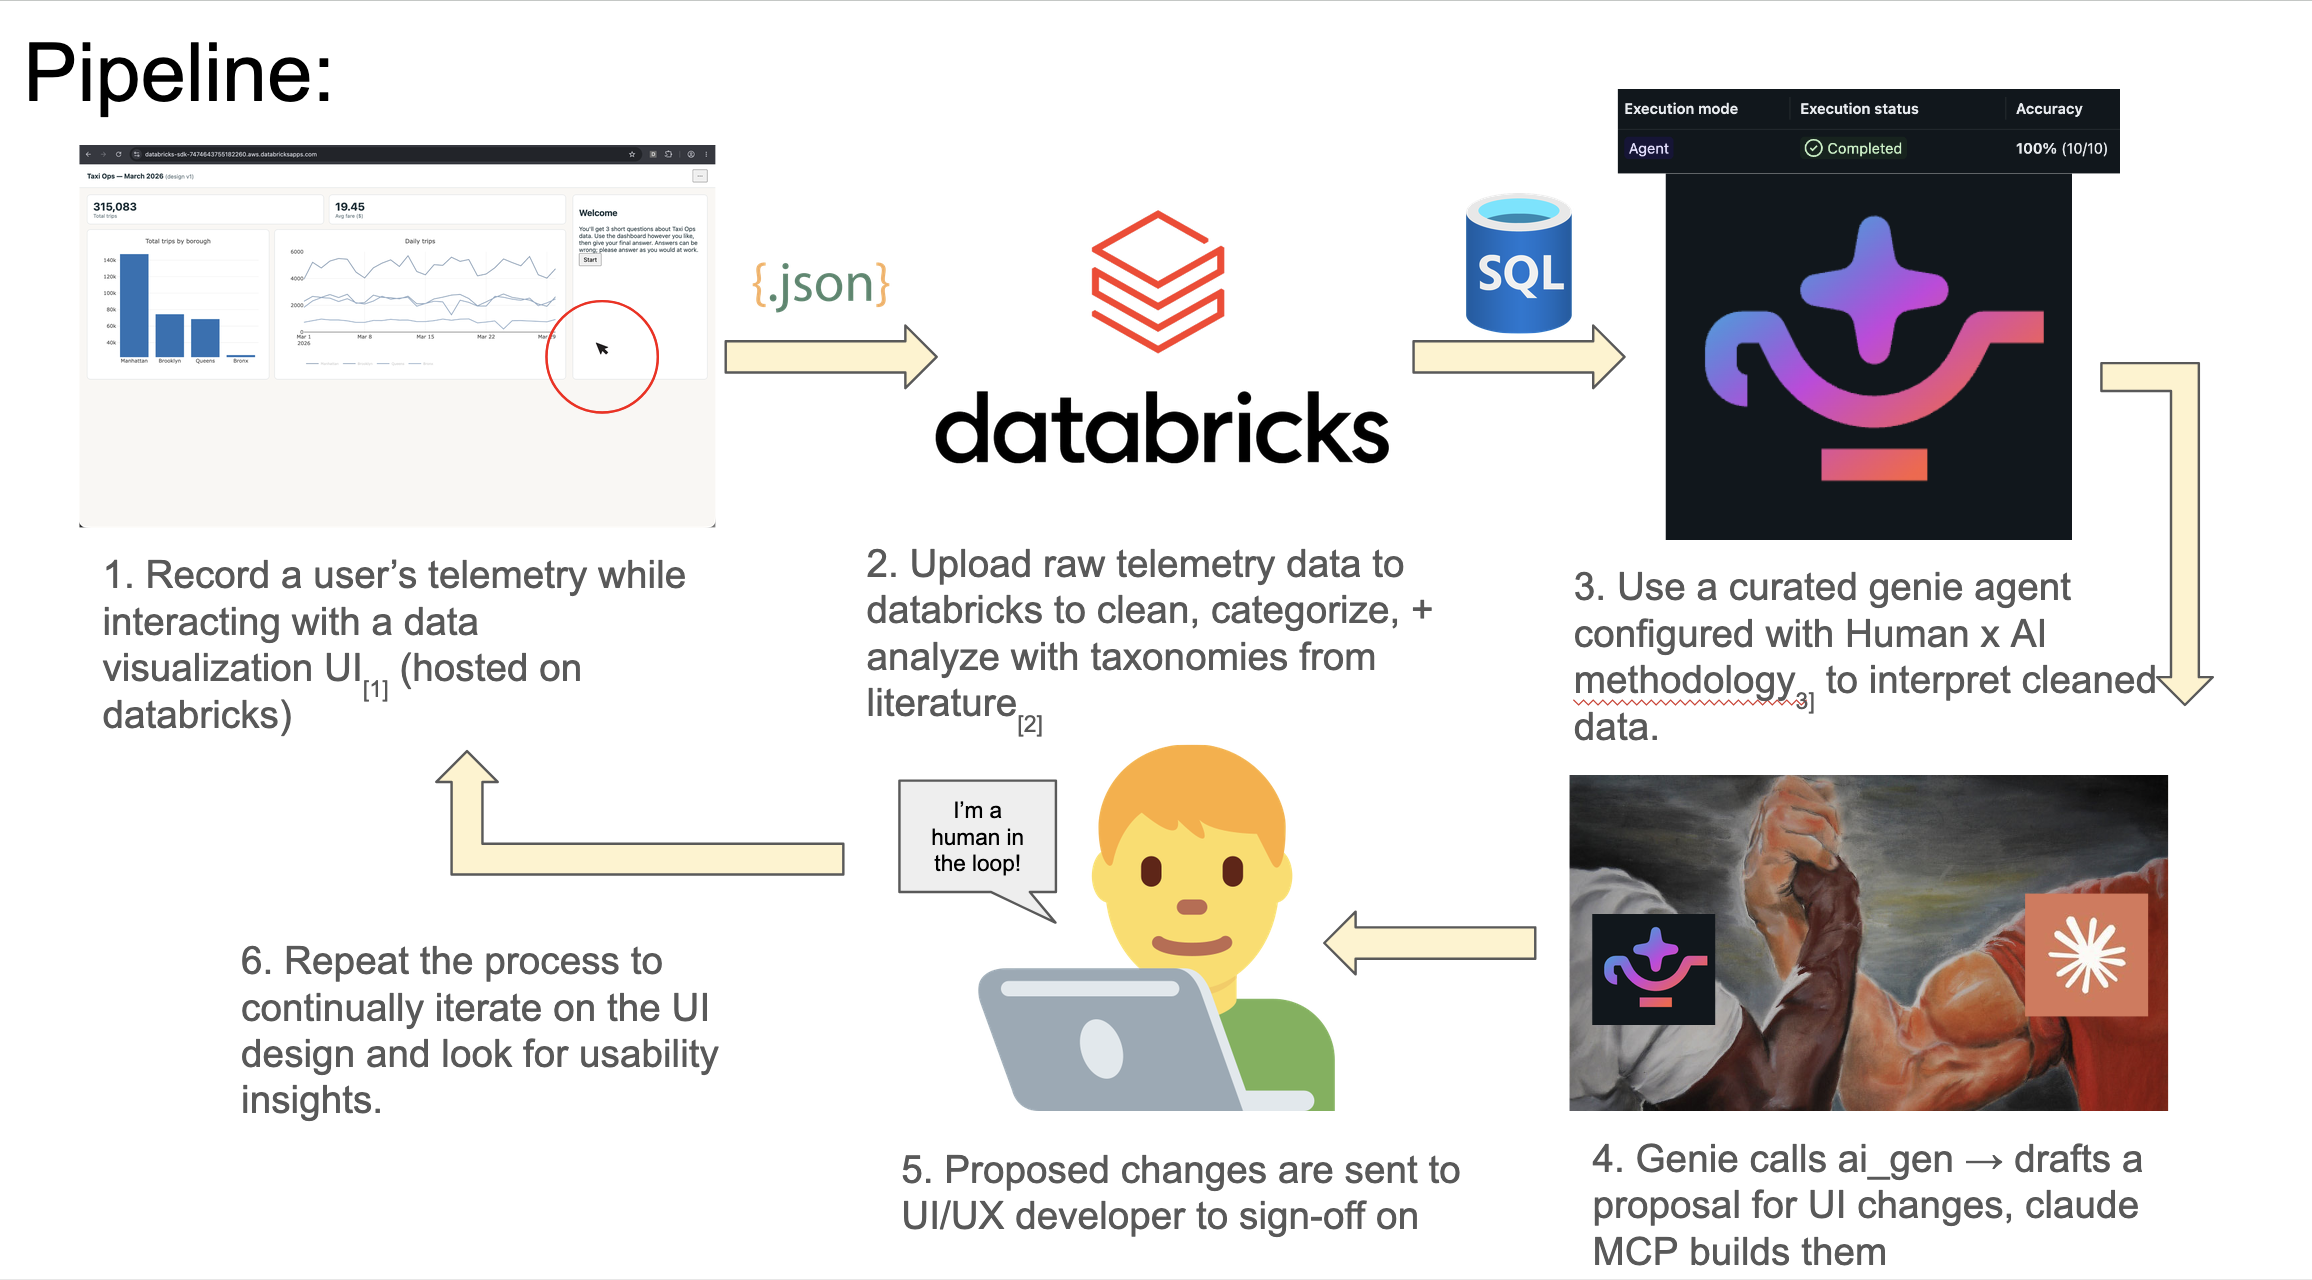
pipeline
-
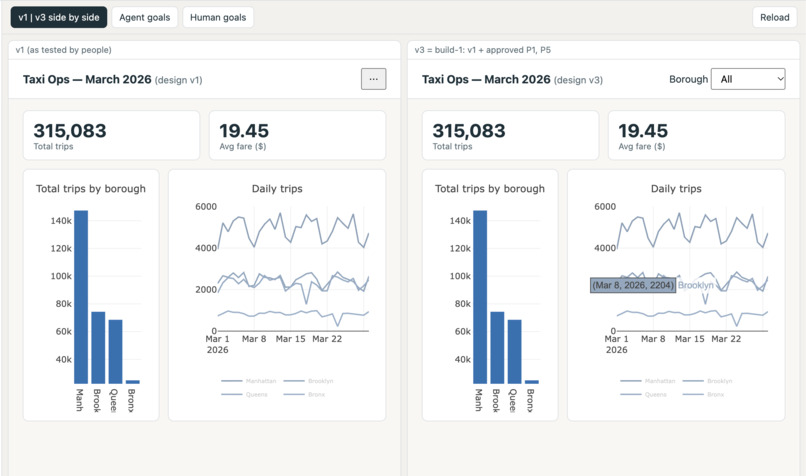
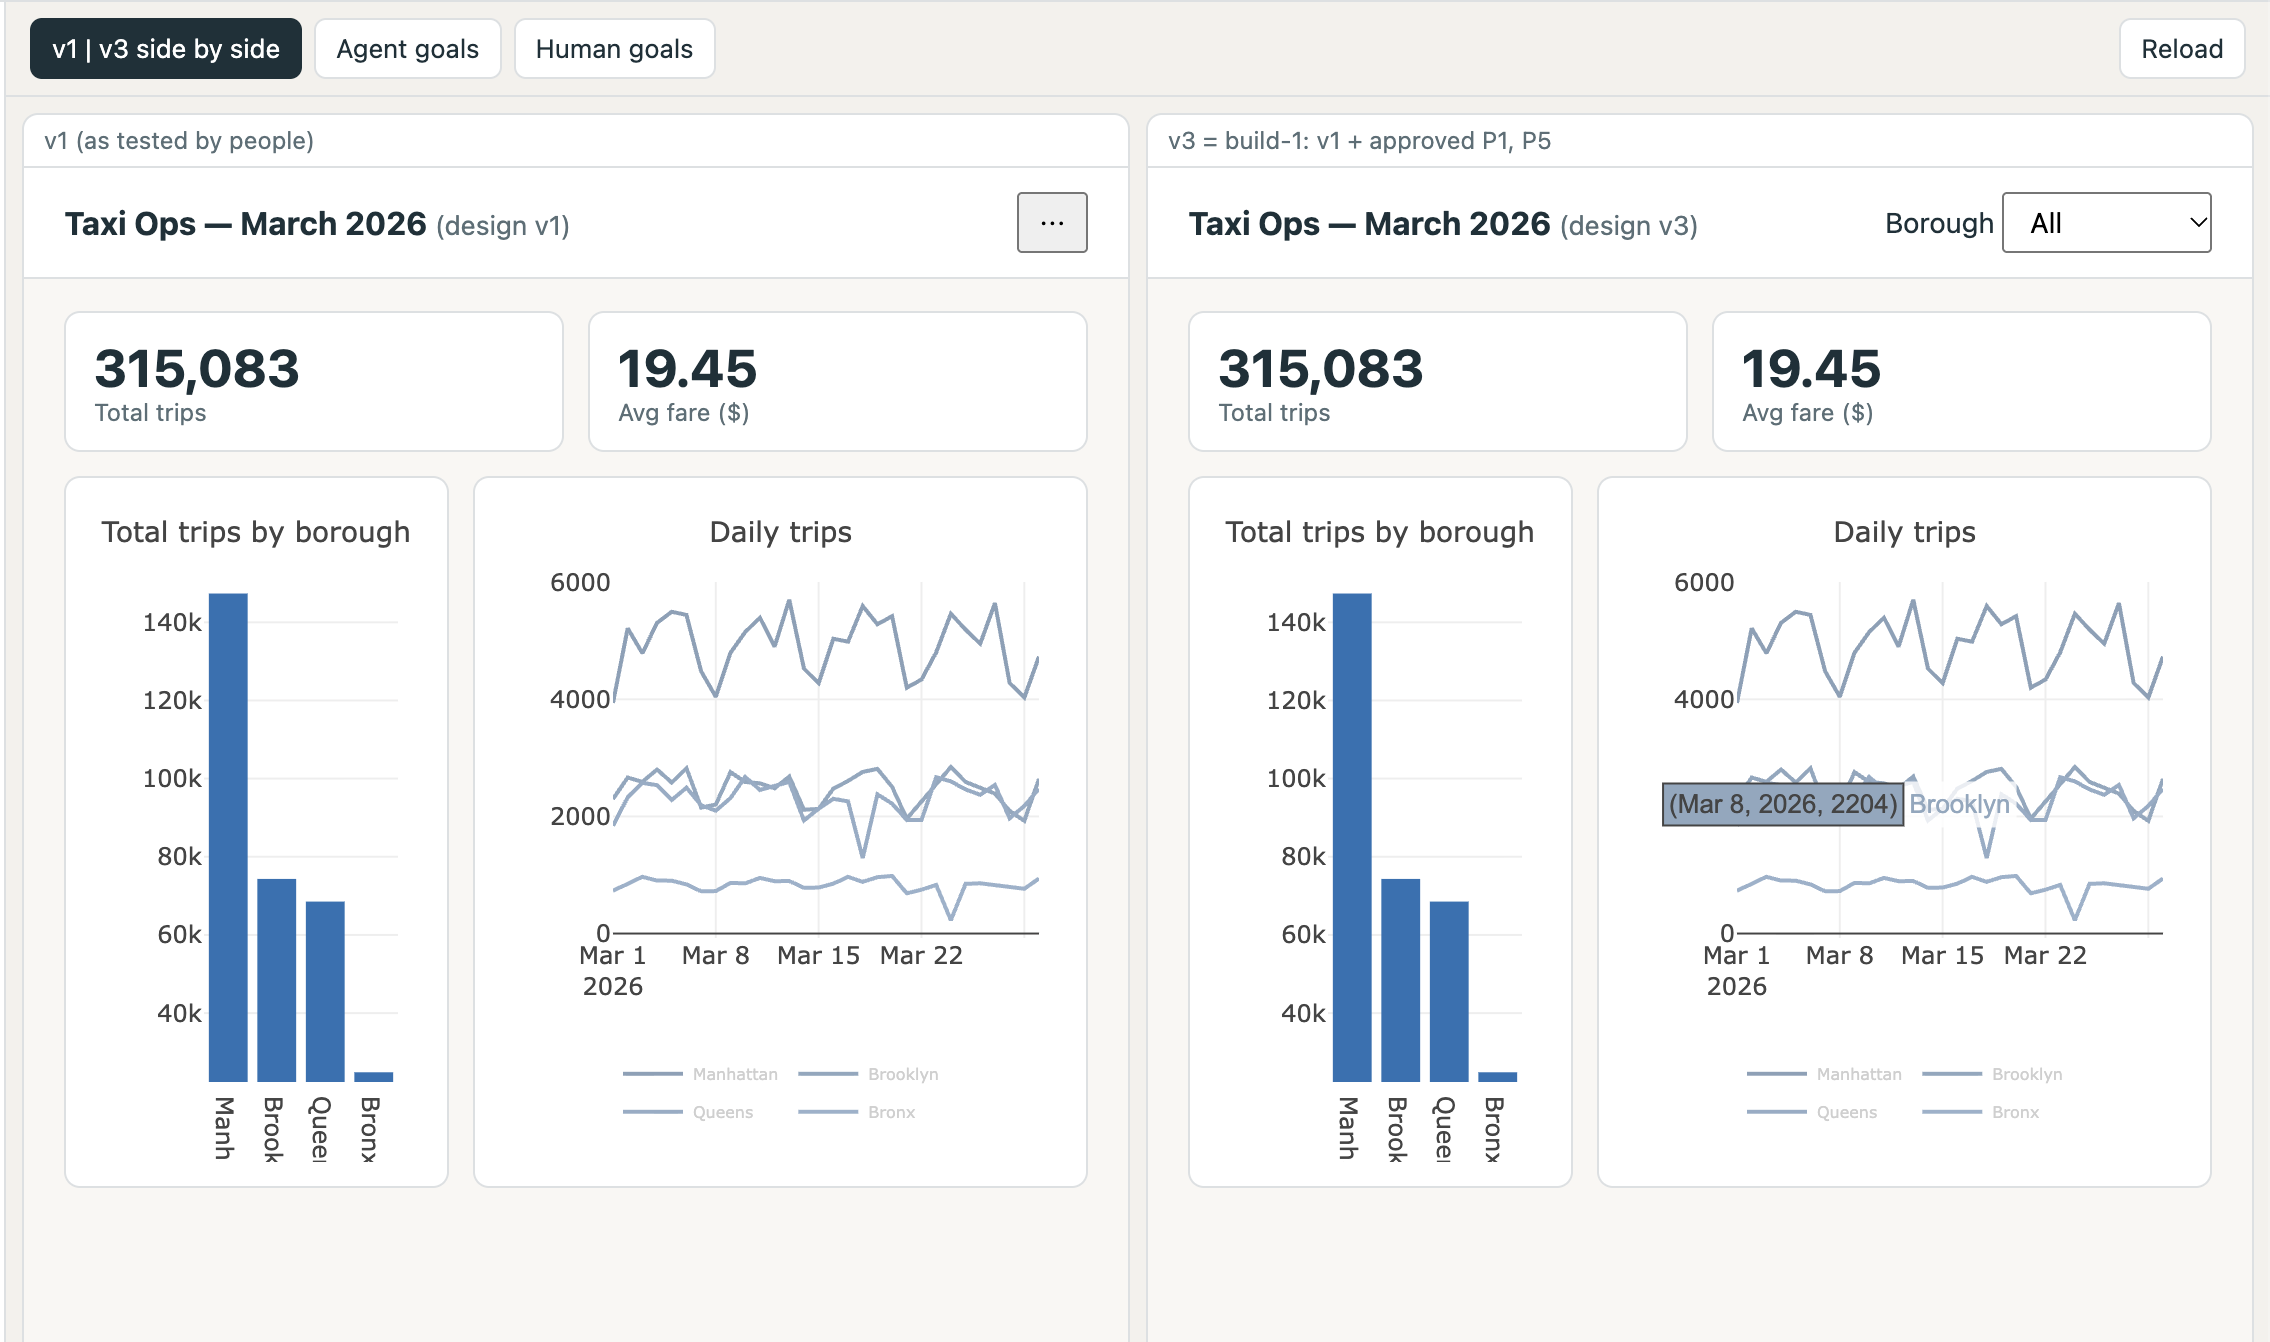
v1, v3 iterations of a visualization UI passed through pipeline
-
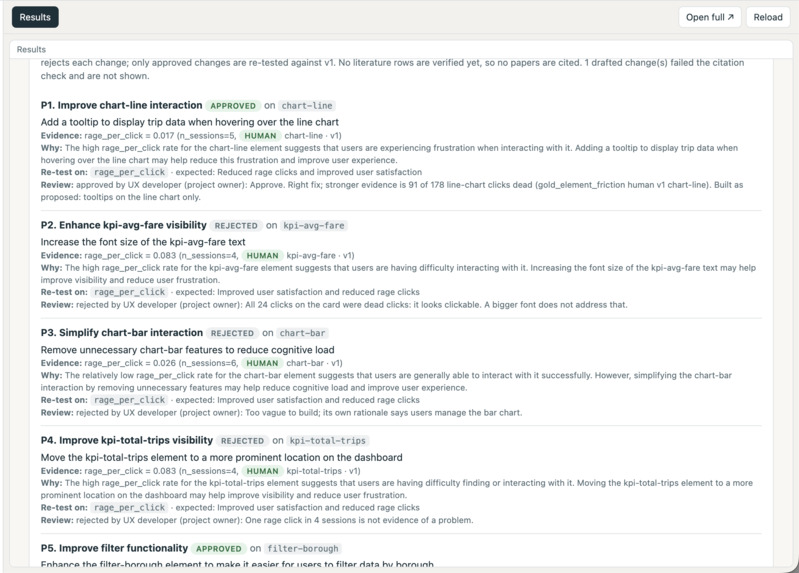
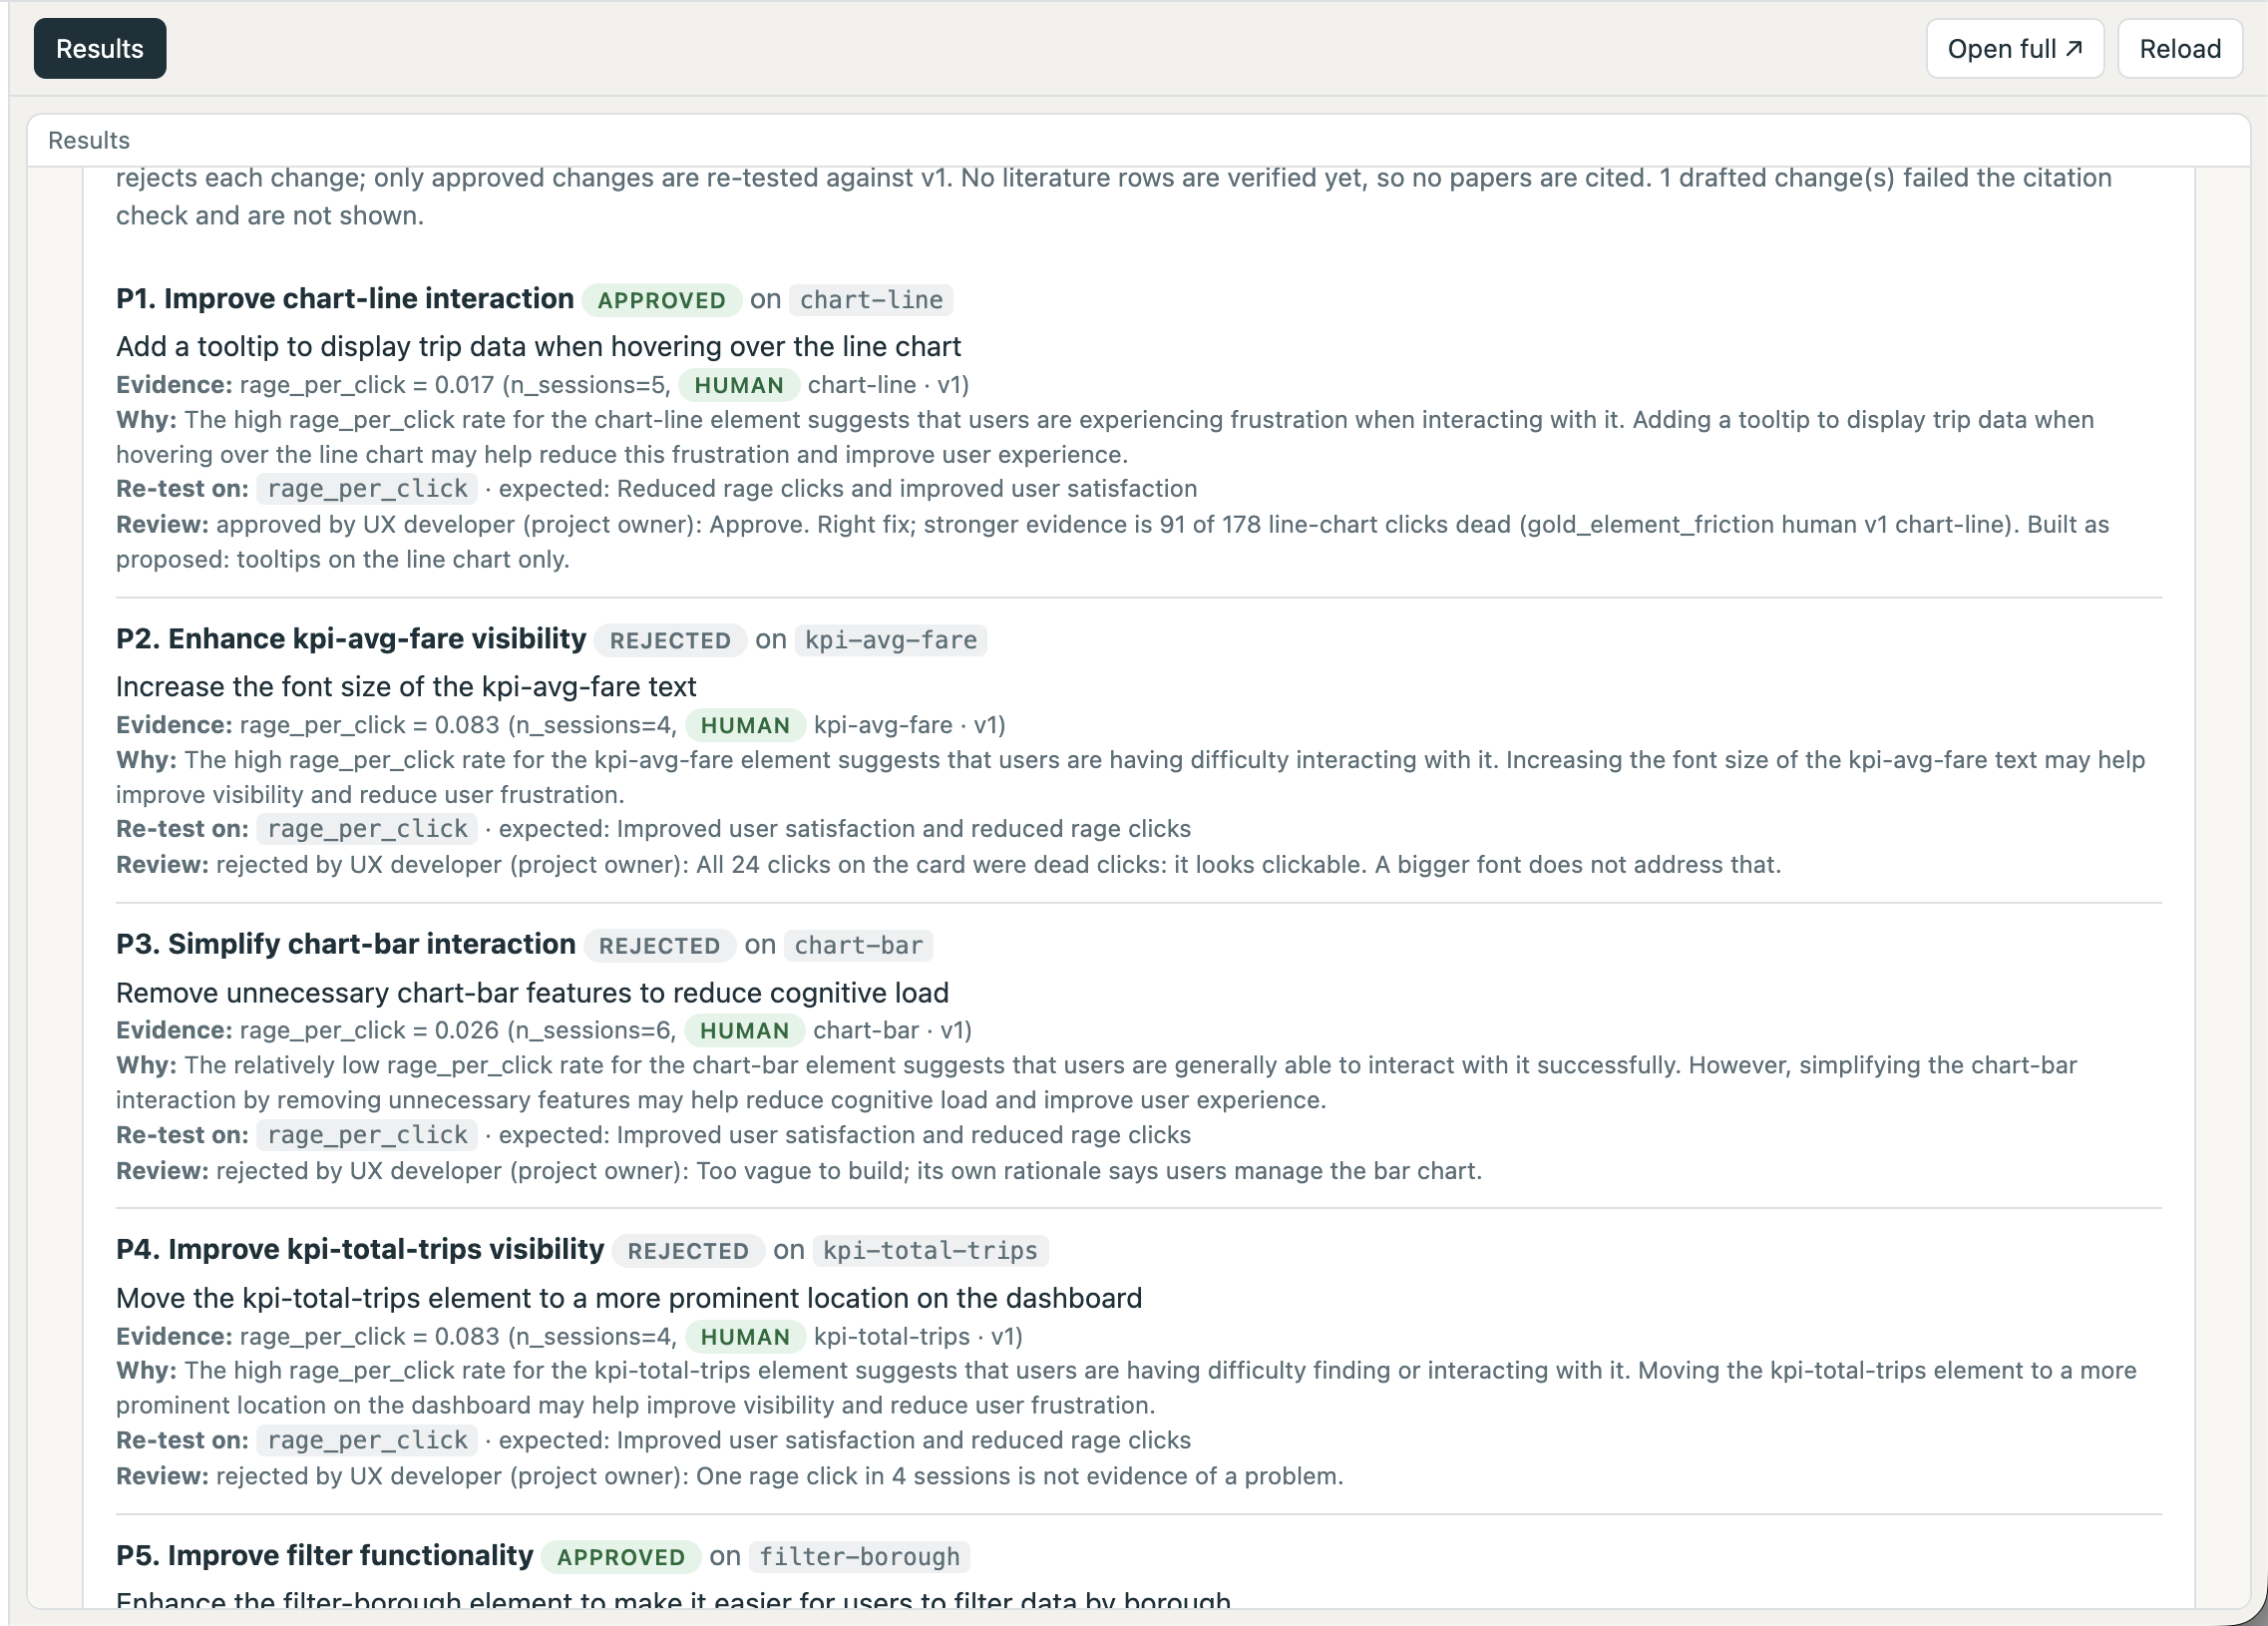
Approved / rejected UI improvement proposals
-
awesome cat picture
Friction Atlas
Find where users struggle. Prove the fix worked.
My background
I do Human x AI / HCI research on visualization-reading agents. I'm especially interested in investigating the gap between what a human user intends and what an agent can actually output. Seeing how Databricks is used made me want to study how people experience these new data tools.
The issue
Databricks representatives told me that teams building data tools and dashboards struggle to work out why users drop off. Analytics show when people leave a page, and telemetry is usually collected, but rarely at a level of detail that identifies why someone struggled with a service.
Solution
An iterative pipeline that takes in user telemetry, finds specific points of friction, drafts fixes, and hands them to a UI/UX developer to sign off on. Approved changes are re-tested through the same pipeline.
Target audience: UX designers and corporate or academic HCI researchers who want to optimize interfaces or run usability studies.
How it works (the pipeline in detail)
1. Record telemetry while a person uses a data-visualization UI
The study interface ("Taxi Ops"). A mock analytics dashboard (HTML, JavaScript and Plotly) with a bar chart of trips by borough, a line chart of daily trips, KPI cards and a borough filter. It exists in two versions: v1 has deliberately planted usability flaws and v2 fixes them. The flaws give us ground truth to check the pipeline against:
- F1: the bar-chart axis is truncated, so a small gap looks large.
- F2: four near-identical line colors and a tiny legend.
- F3: the borough filter is hidden behind a "..." menu.
- F4: the average-fare KPI card looks clickable but does nothing.
- F5: no hover tooltips in v1.
The study tasks. Participants work three goals per session on the charts. Examples are "how many percent more trips did Brooklyn have than Queens?", the average Bronx fare, and the day Queens had the fewest trips. Each goal has a known correct answer and is tagged with the Amar, Eagan and Stasko (2005) low-level task categories it exercises (for example compute_derived_value, filter, find_extremum). An optional chat assistant (?chat=1) is a deterministic Python stub, not an LLM, so we always know when it is wrong. It has planted behaviors: for example a confidently wrong percentage computed from a truncated axis, a borough filter ignored the first time, a slow reply with no progress indicator, and a selected chart point ignored. Every reply is logged with whether it was correct.
The telemetry SDK. One dependency-free JavaScript file (about 560 lines), also the core of a Chrome extension for UIs we do not own. It records:
- clicks with the element hit, rage clicks (3 or more within 700 ms and 30 px) and dead clicks (looks clickable, does nothing)
- mouse movement (sampled every 100 ms), scrolling, hover dwell (300 ms or more), chart hover, click and legend-click events
- idle gaps (30 s or more), window focus and visibility, paste events, and goal start, outcome and satisfaction rating
- on every event: participant, app version (v1 or v2), session type, and the active goal and turn
How it identifies things. data-ux-id, data-ux-region and data-ux-action attributes give each element a stable name (the uxid), so later proposals can cite a specific element, not "somewhere on the page".
Privacy by default. Nothing is recorded until enabled. No keystroke content, editor text, password fields or URL query strings. Prompt text is only captured with explicit consent, and a salted hash is stored otherwise.
Chrome extension (Manifest V3). The same core, opt-in and local-first: nothing is recorded until the user ticks a consent box, data stays in the browser until exported as JSONL, and it labels pages such as notebook, dashboard, Genie and SQL editor.
2. Upload raw JSON to Databricks, then clean, categorize and analyze
Hosting and collecting: a Databricks App. The study site itself runs as a Databricks App (a Python standard-library server). It serves the dashboard to participants and receives the SDK's batches on POST /events. A buffered collector writes one new JSONL file per flush (every 3 seconds) into a Unity Catalog Volume using the databricks-sdk Files API, with overwrite disabled so concurrent uploads never clobber each other. It runs as a service principal with explicit grants, exposes /status and /healthz for debugging, and serves a /results page. Only the browser decides whether prompt text is logged; the app never stores it.
Medallion tables in Databricks SQL (catalog workspace, schema ux_telemetry):
- Bronze:
read_filesover the Volume with an explicit schema, which avoids the schema-merge failures we hit withCOPY INTO. It keeps the source file name and ingest time, and is rebuilt from the whole Volume on each run. - Silver: typed, de-duplicated events (one row per session, time, type, element, position, goal and turn, since the SDK can resend batches). Trials, goals and turns are reconstructed from start and outcome events. Session types keep the data honest:
human,agentandsimulated, with earlier design revisions held apart (human_r1,agent_r1) so they are never pooled with the current design. Anexcluded_sessionstable drops test or incomplete sessions. - Gold: research metrics, each tied to a construct and to HCI literature:
- rage and dead clicks: frustration or a false affordance
- hover dwell: attention and reading effort on chart marks
- idle time and time to first action: hesitation or confusion
- success versus satisfaction: "satisfied but wrong" is over-trust
- for the chat assistant: reformulation, repair, verification, latency and abandonment, per planted behavior
- Gold tables:
gold_trial_metrics,gold_task_summary,gold_element_friction,gold_version_comparison,gold_turn_metrics,gold_goal_metrics,gold_goal_summary,gold_bot_behavior.
Categorizing with taxonomies. Chat prompts are labeled into the Amar, Eagan and Stasko categories with Databricks ai_classify. The labels are checked against a deterministic rule baseline and against the categories each goal was designed to exercise, so the model's labels are not trusted unchecked.
Catalog comments. Table and column descriptions are written into Unity Catalog, so the metric definitions travel with the data and Genie can read them.
Testing without a workspace. The same SQL runs in a local SQLite harness (25 checks), and the SDK, demo, extension and app collector each have automated tests (Playwright end-to-end, plus a collector test with a fake file client).
3. Serve refined data to Genie
A Databricks Genie space sits over the gold tables. A space is curated, not trained: I chose the tables, wrote instructions, and added tested example SQL and a benchmark set.
- Instructions define success and abandonment, treat rage clicks and idle time as proxies (not proof), always group by session type, label simulated data, report n next to every rate, forbid invented composite scores, and avoid significance claims.
- Example queries (11) cover the hardest task, whether v2 helped, which element draws rage clicks, where users over-trust, which tasks cause hesitation and which assistant flaw hurts most. The 20-question benchmark set is derived from them.
- Access. Genie answers in the workspace, and Claude Code reaches it through the Genie One MCP server. The
/resultspage also reads the gold tables through a SQL warehouse: v1 versus v2 per task, rage and dead clicks per element, chat goals, and the proposals, with human and simulated results shown separately.
4. Draft proposals for UI changes
A designer step turns evidence into concrete, cited proposals:
- Evidence pack. Gold rows are exported with stable ids (table, session type, keys). For the live loop the evidence is real v1 sessions only, and designers see neutral element descriptions, not the list of planted flaws.
- Claude as designer. One call drafts up to six changes. Each targets one
uxid(or an assistant behavior), cites evidence rows by id, and states the expected effect and the metric that should move when re-tested. - A second designer inside Databricks.
ai_genruns from SQL over the same gold tables, using a Databricks-managed model that is not necessarily Claude. It stores both its raw reply and the exact evidence it saw. - Guardrails enforced in code, not just in the prompt. A change may cite only rows in the pack; the cited value and sample size must match the row; simulated evidence stays labeled; the target must be a real element; literature may only be cited from rows marked verified. Anything failing a check goes to a rejected list with the reason. Valid changes start as pending.
- After approval, Claude builds the change as v2.
5. UX developer sign-off
The human in the loop. A UX developer reviews each proposal and approves, edits or rejects it, with their name and a note stored alongside. Only approved changes can become v2. In the pilot run, one proposal set had six changes approved. In another, one was approved and two were rejected (one showed no problem in the data, one conflicted with an approved change). The /results page shows every proposal set side by side.
6. Repeat
The approved v2 goes through the same capture and pipeline, and the SDK's app_version field lets Databricks compare v1 and v2 using the same gold tables. Each proposal names the metric that should move, so the re-test is a direct check on whether the fix worked.
Why Databricks
- All-in-one platform. I host the test site on Databricks too: the Databricks App serves the study UI to participants and collects their telemetry, and the output goes straight back into the platform for processing. The App writes raw events into a Unity Catalog Volume, and the same workspace turns them into bronze, silver and gold tables, runs the AI steps, serves the Genie space and shows results on a
/resultspage. Data never leaves the workspace between collection, analysis and the proposal, so I didn't need to stitch together separate services. - Medallion layers fit the problem. Telemetry is noisy and schemas change. Keeping raw events in a Volume and rebuilding bronze, silver and gold from them means a metric definition can change without re-collecting data.
- Databricks Apps host the collector. The app both ingests events and serves a results page from the gold tables through a SQL warehouse, so participants and results share one deployment.
- AI Functions run next to the data.
ai_classifylabels prompts into taxonomy categories andai_gendrafts proposals without moving data out of the workspace. - Genie makes the results askable. A designer can ask "which element do users rage-click?" in plain language, and curated instructions force it to report sample sizes and label simulated data. Genie is also reachable from Claude Code through its MCP server.
- Unity Catalog comments carry meaning. Column descriptions are what Genie reads, so the metric definitions travel with the data.
- Free Edition a great starter point to build and test the whole loop.
References
[1] Rzeszotarski, J. M., & Kittur, A. (2011). Instrumenting the crowd: Using implicit behavioral measures to predict task performance. UIST '11, 13–22. https://doi.org/10.1145/2047196.2047199
[2] Amar, R., Eagan, J., & Stasko, J. (2005). Low-level components of analytic activity in information visualization. IEEE InfoVis 2005, 111–117. https://doi.org/10.1109/INFVIS.2005.1532136 Brehmer, M., & Munzner, T. (2013). A multi-level typology of abstract visualization tasks. IEEE TVCG, 19(12), 2376–2385. https://doi.org/10.1109/TVCG.2013.124
[3] Gu, K., Shang, R., Althoff, T., Wang, C., & Drucker, S. M. (2024). How do analysts understand and verify AI-assisted data analyses? CHI '24. https://doi.org/10.1145/3613904.3642497


