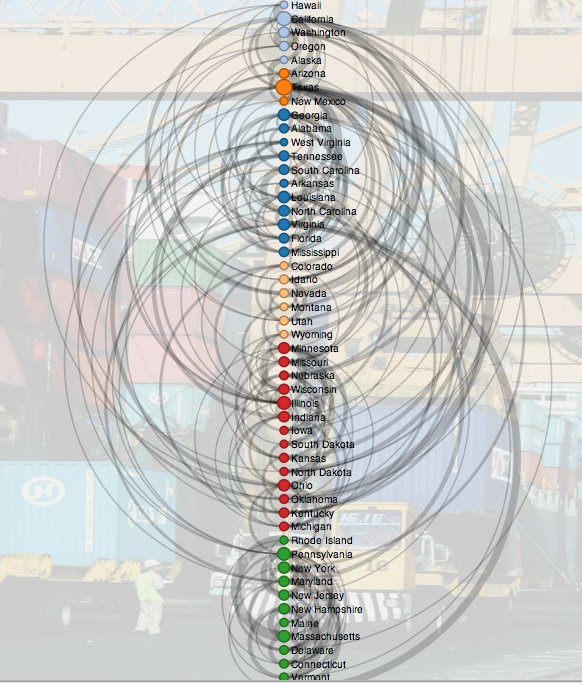
This is a visualization of the freight analysis framework data from 2007. It illustrates the connections of freight flowing from state to state. The thought is that by seeing the interconections between the states invesments can be made in specific states that will benefit many states. To veiw unzip the attached file and open index.html in a modern browser (Firefox, Safari, or Chrome). This project was generously supported by Wilbur Smith Associates, and Metro Analytics
Freight Flows
Updates
Leave feedback in the comments!
Log in or sign up for Devpost to join the conversation.