-
-

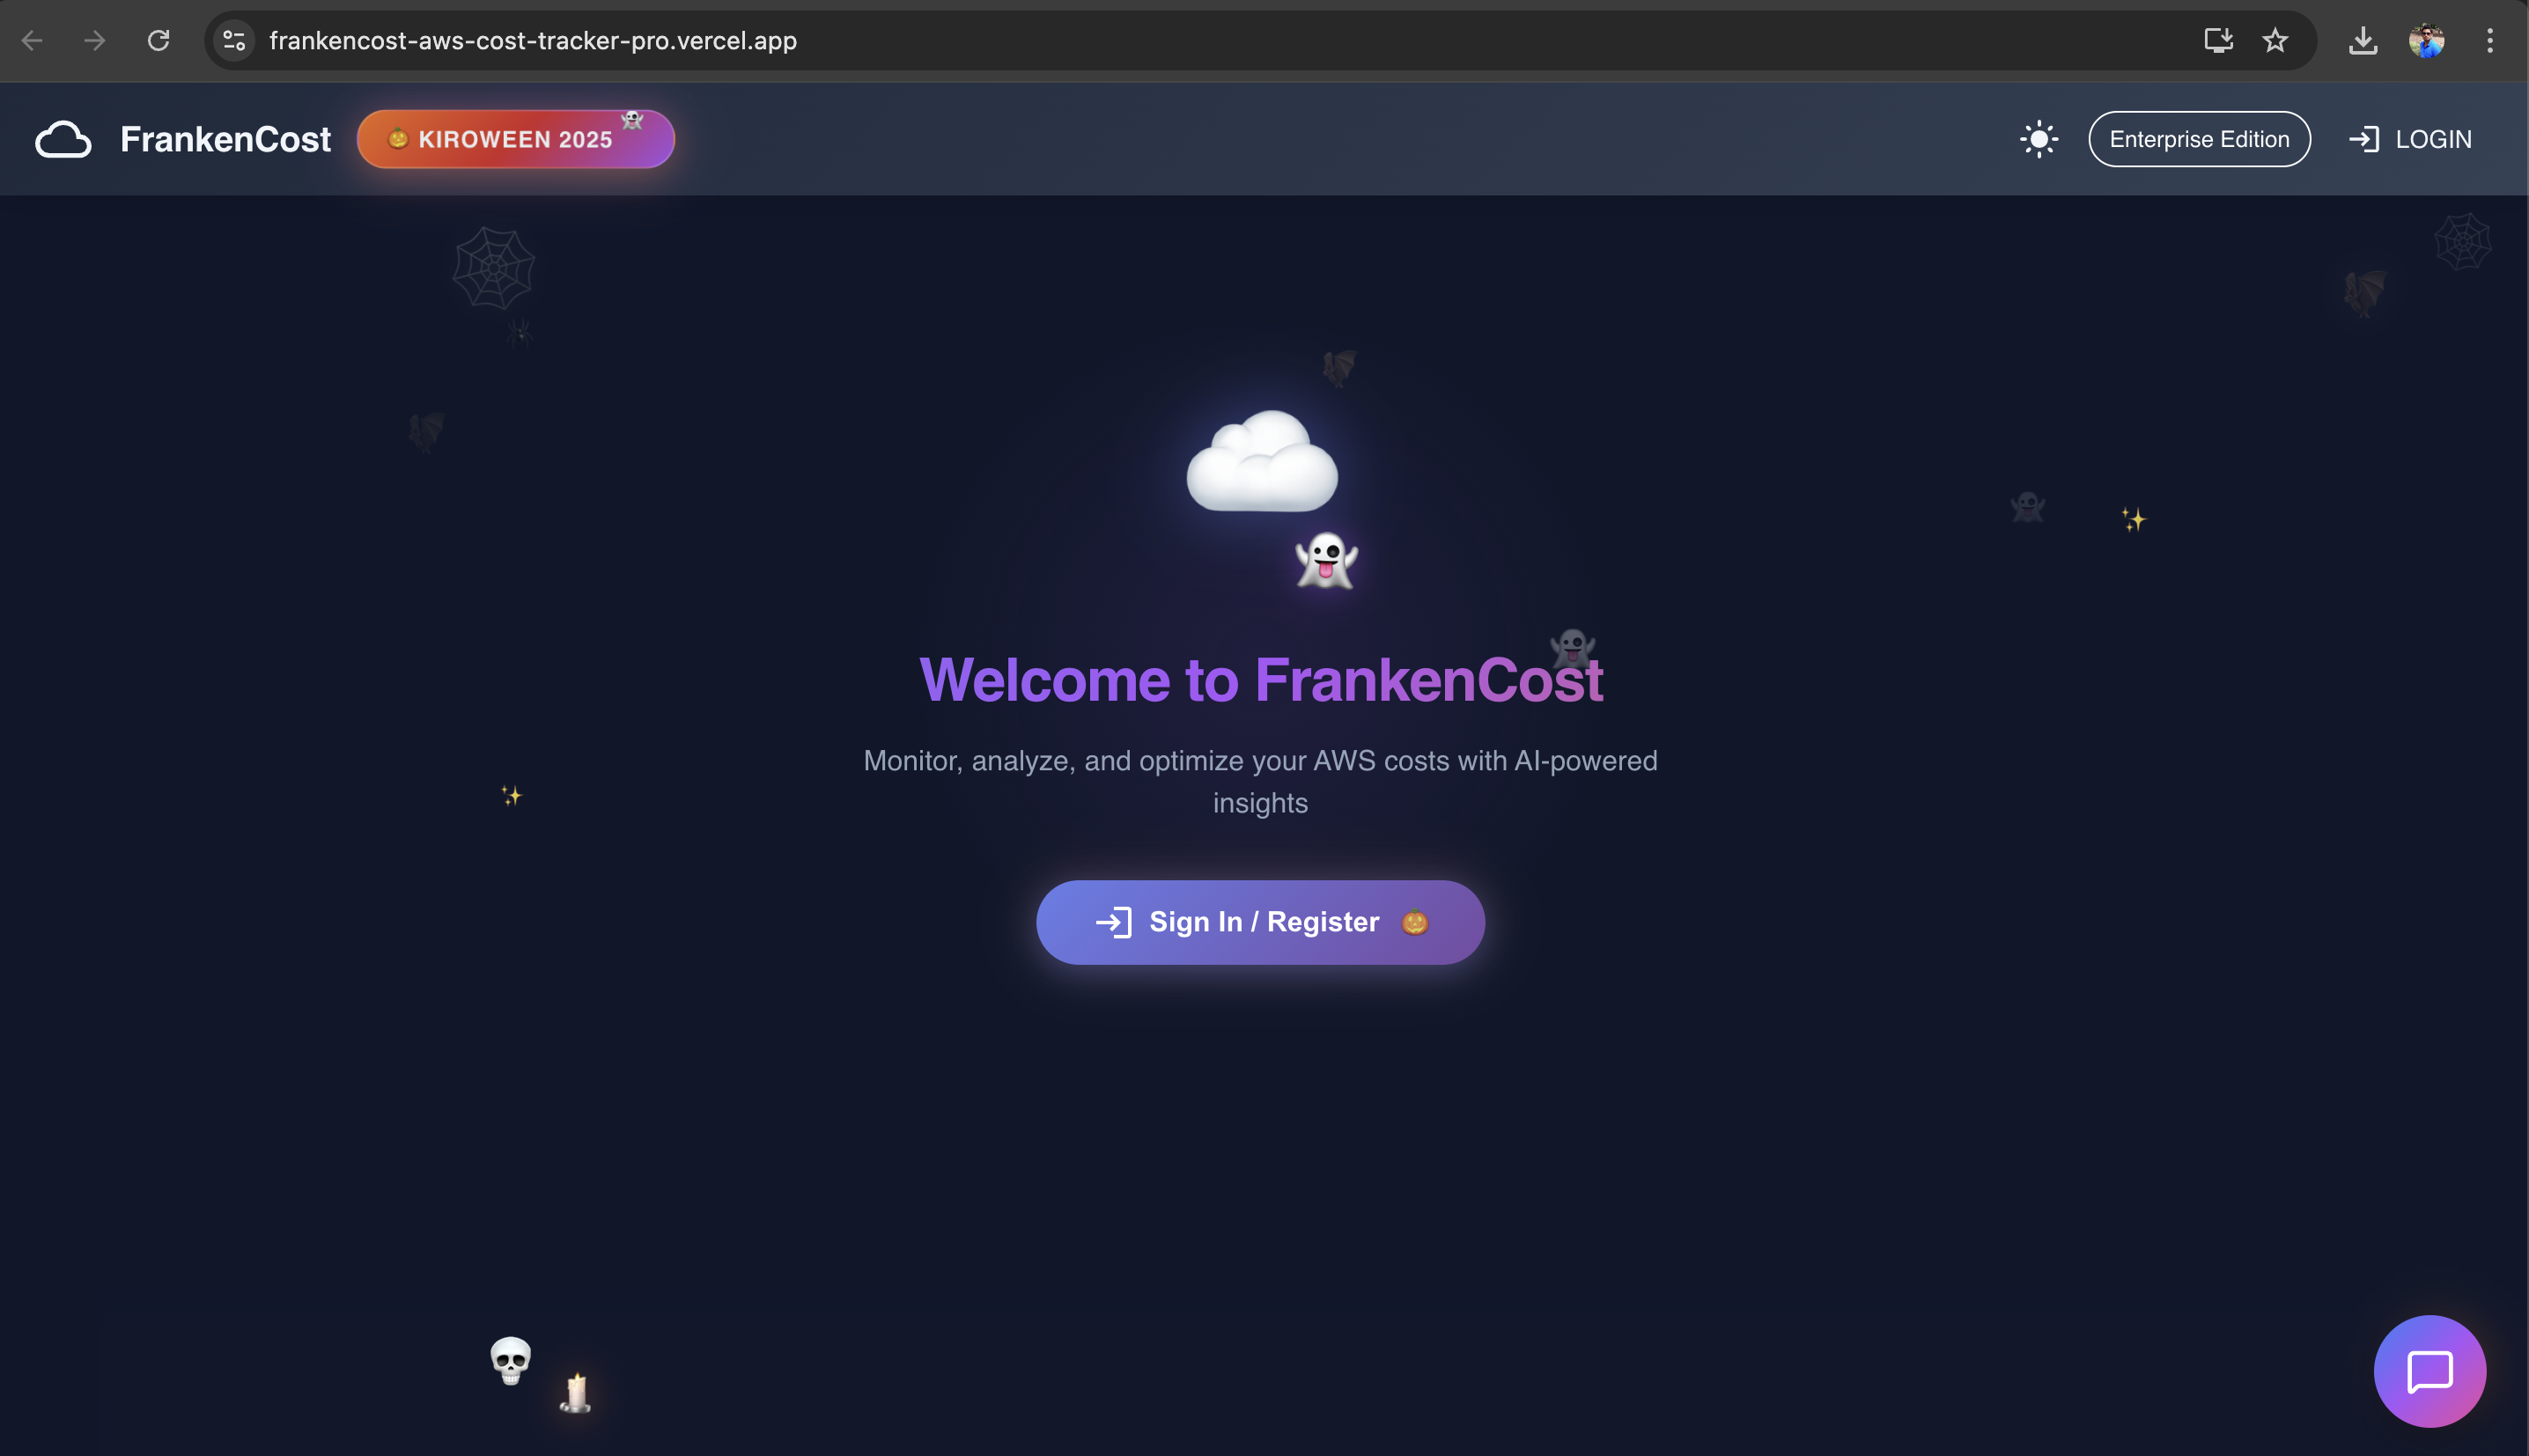
FrankenCost landing page
-
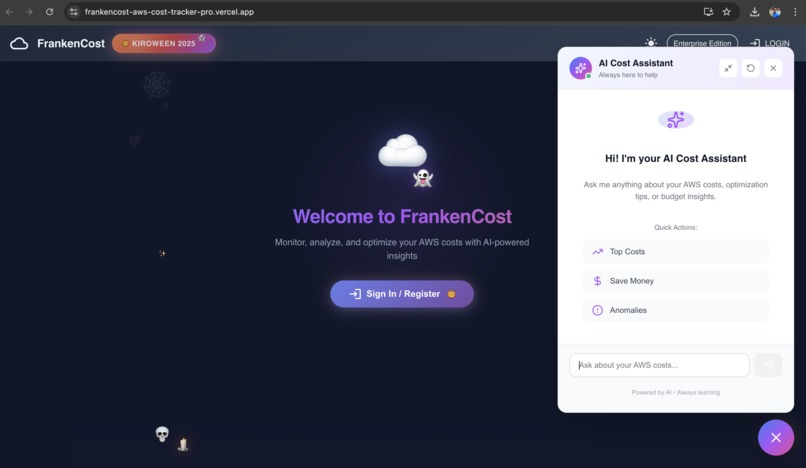
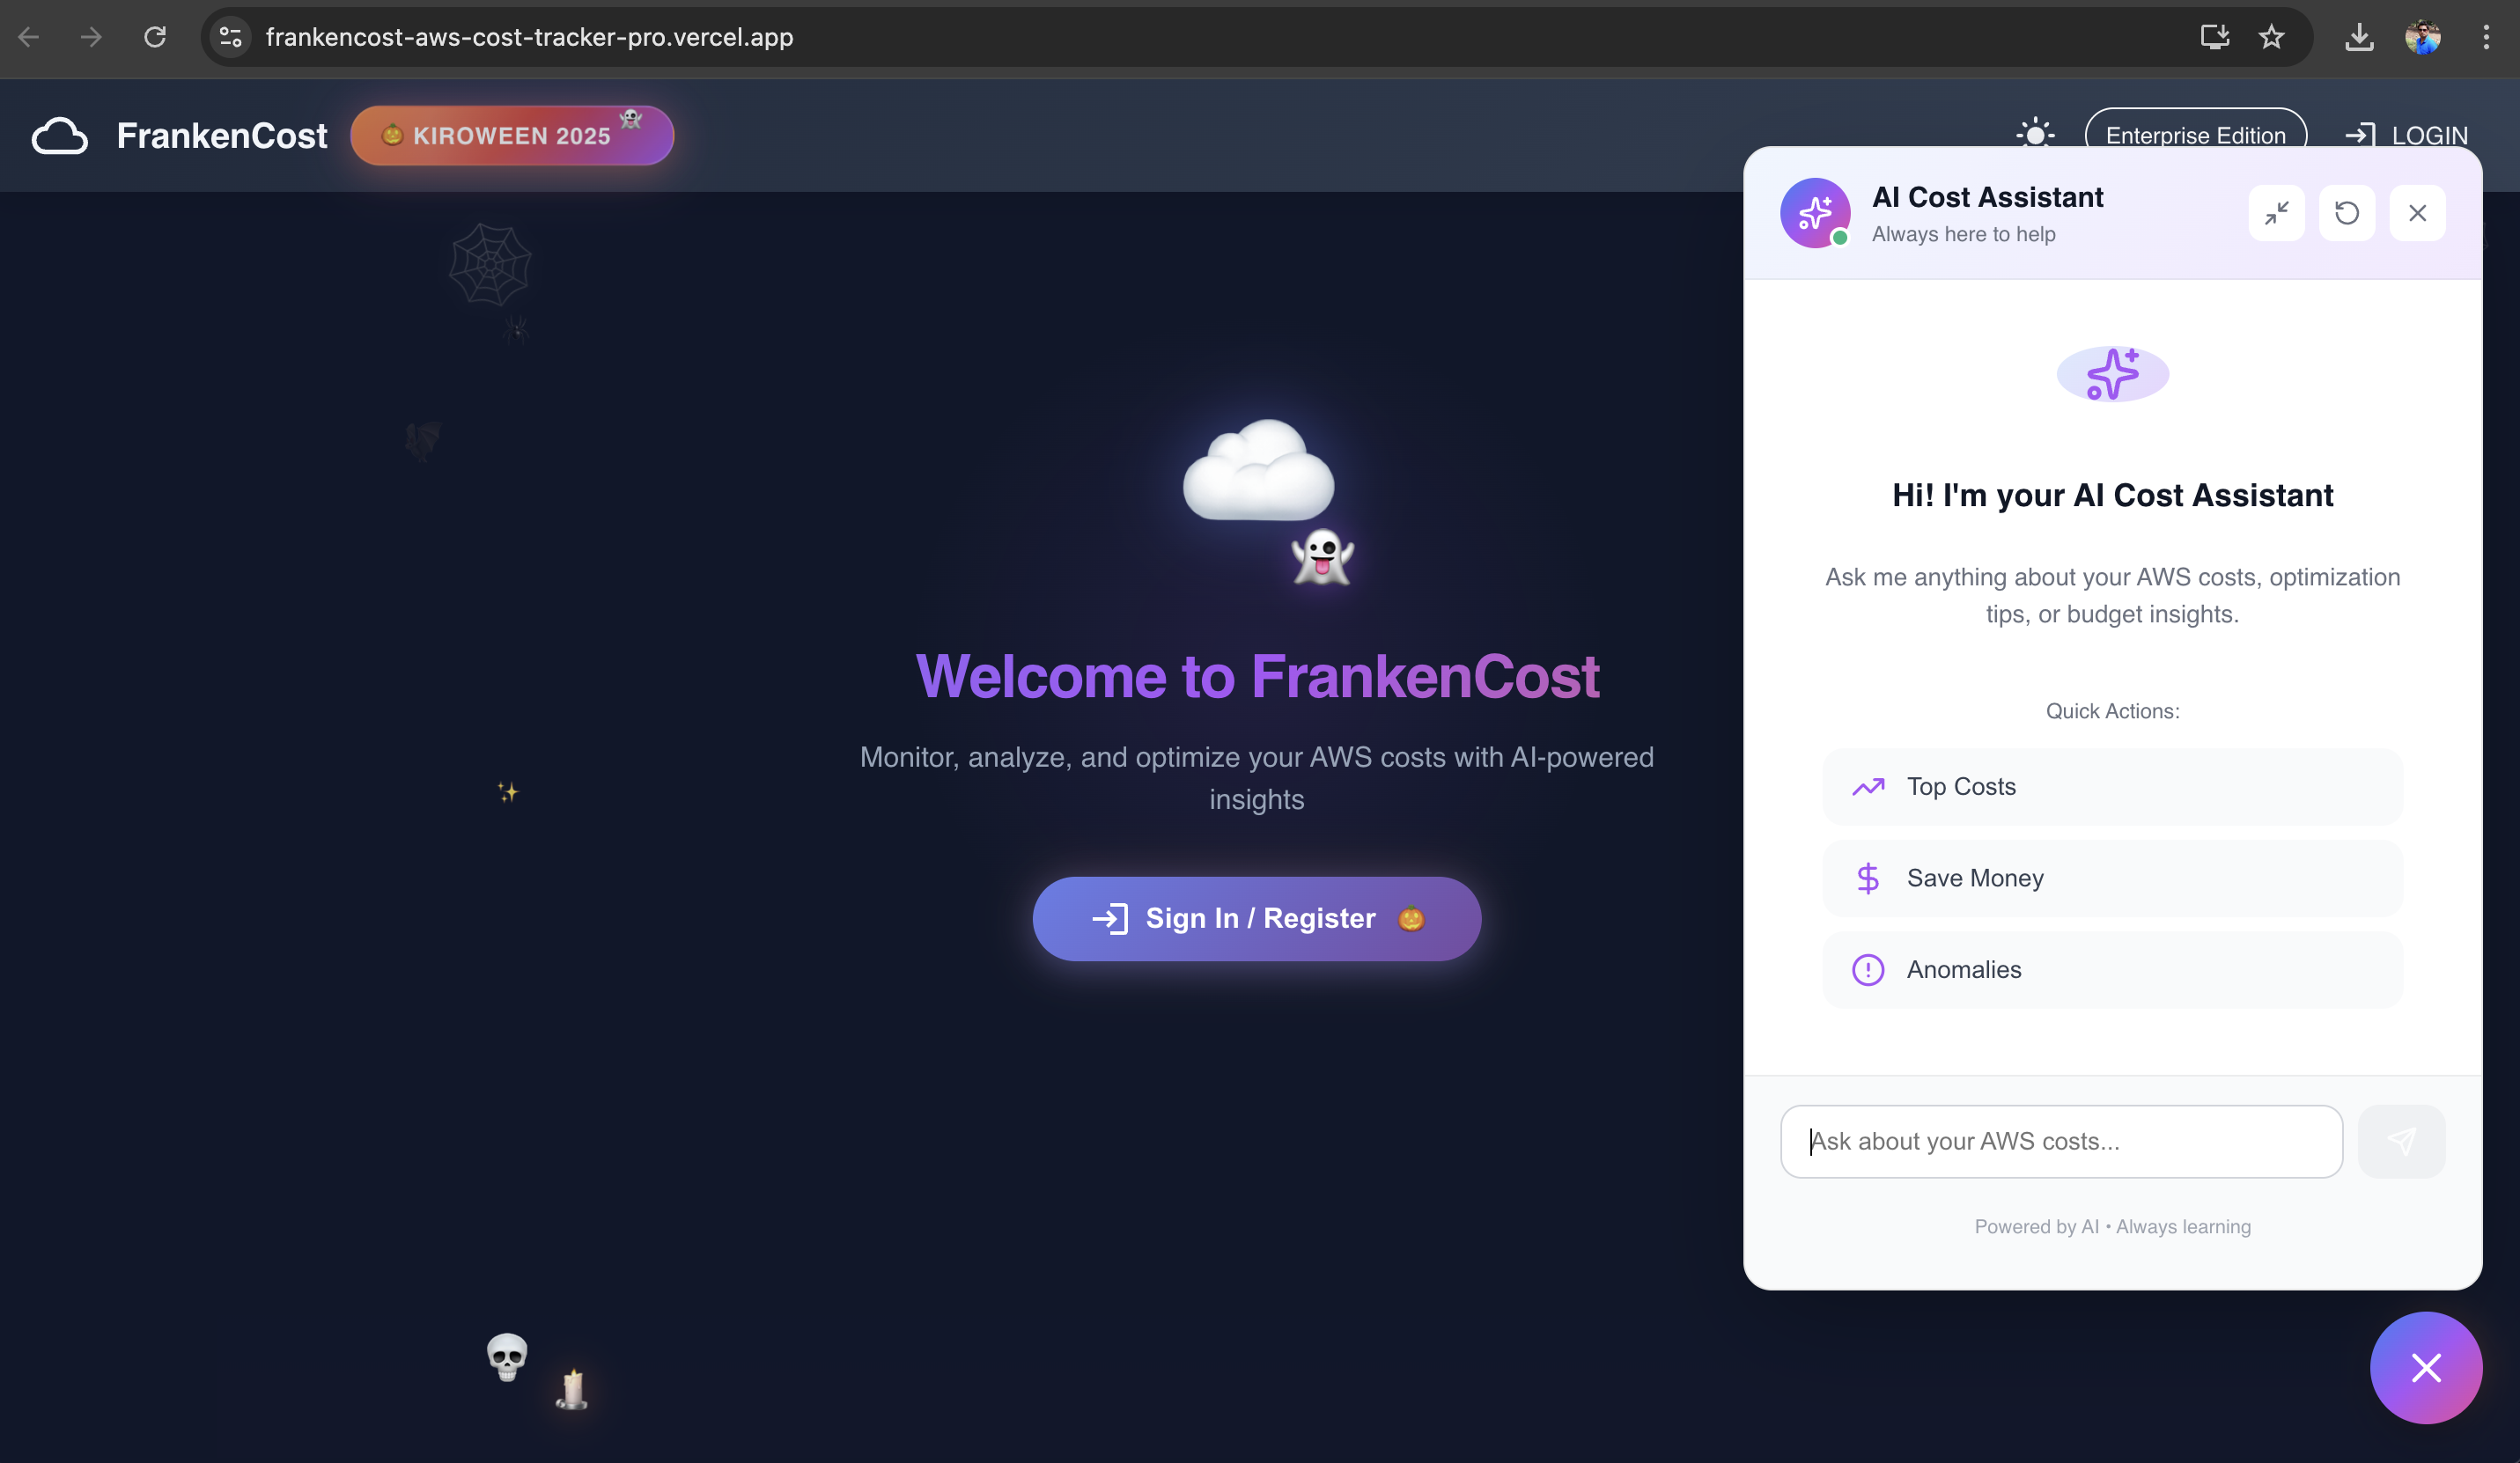
AI Cost assistance in action
-
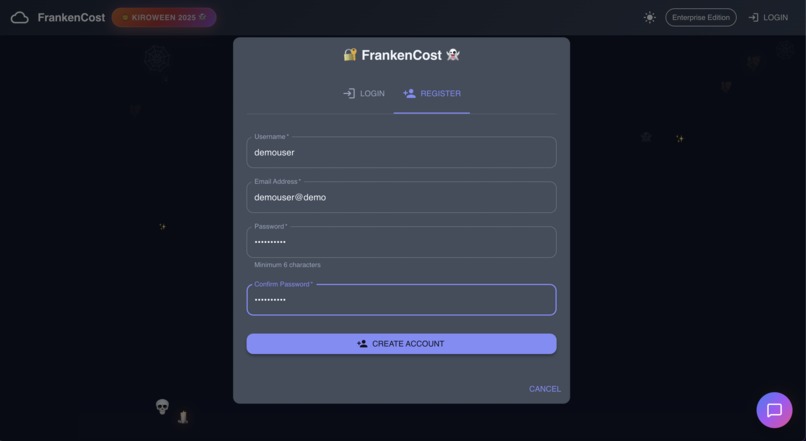
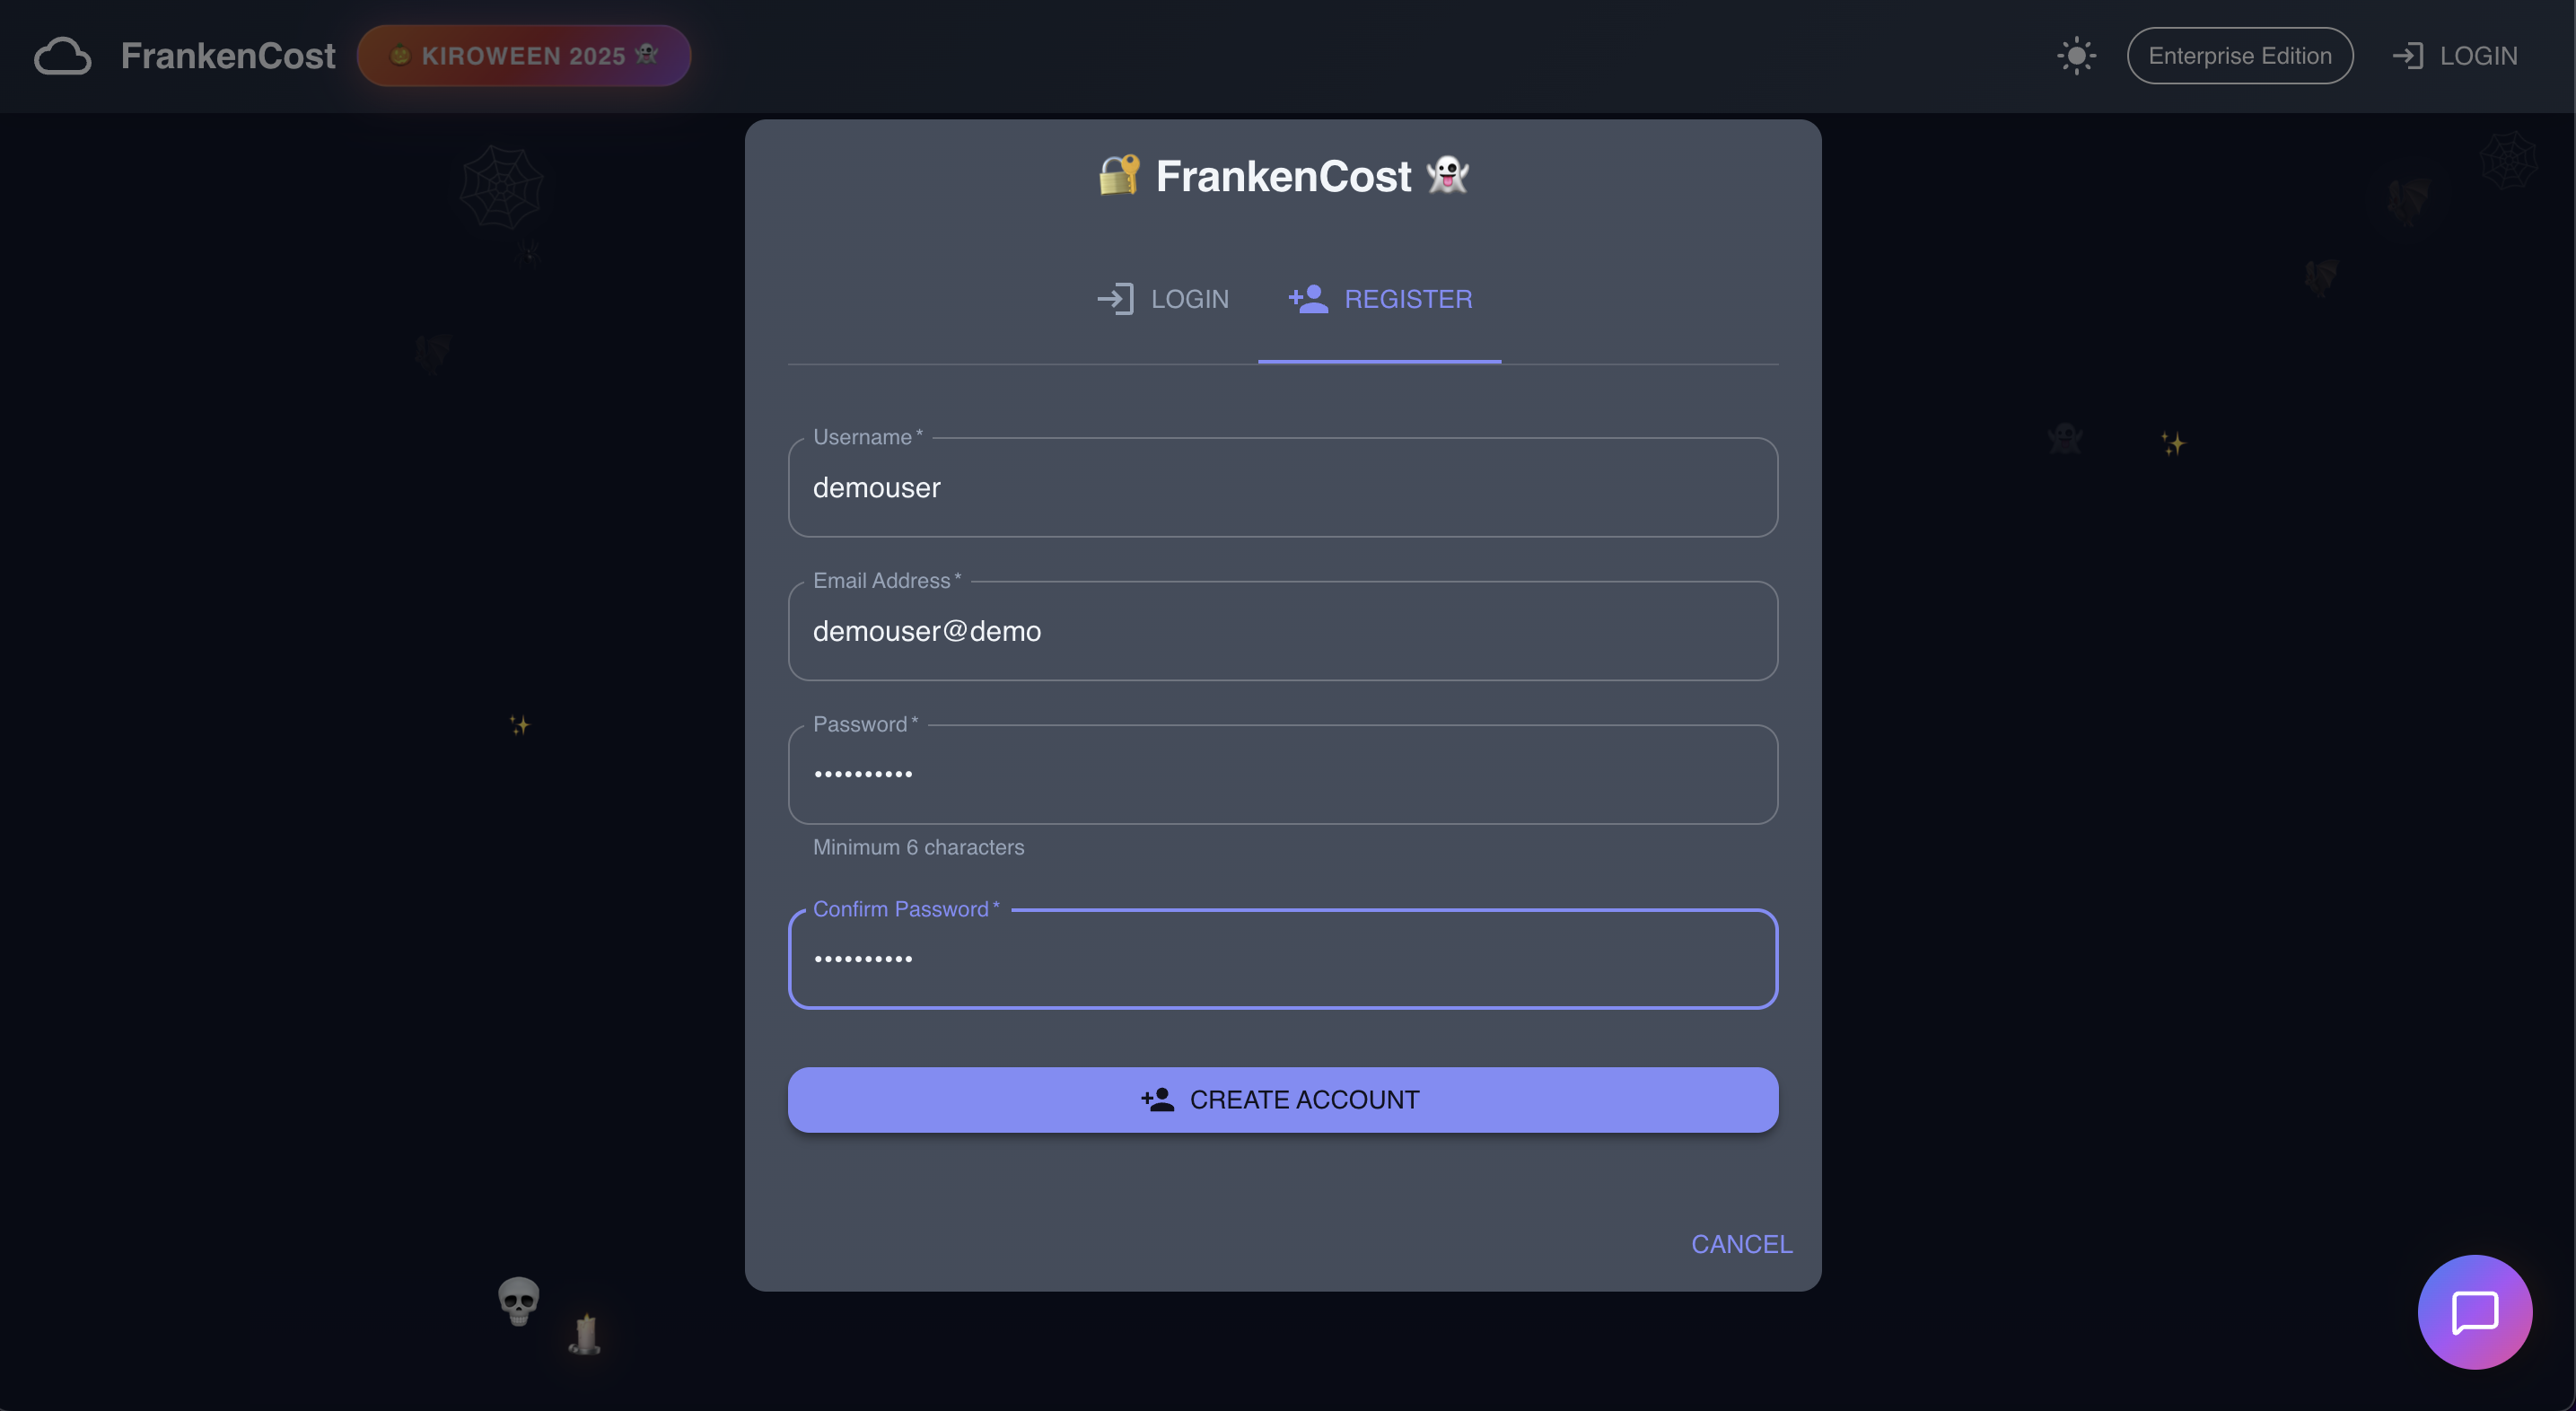
User Registration process
-
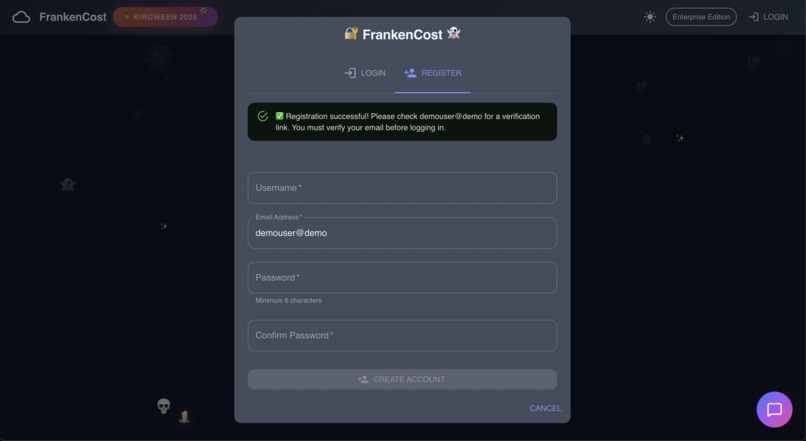
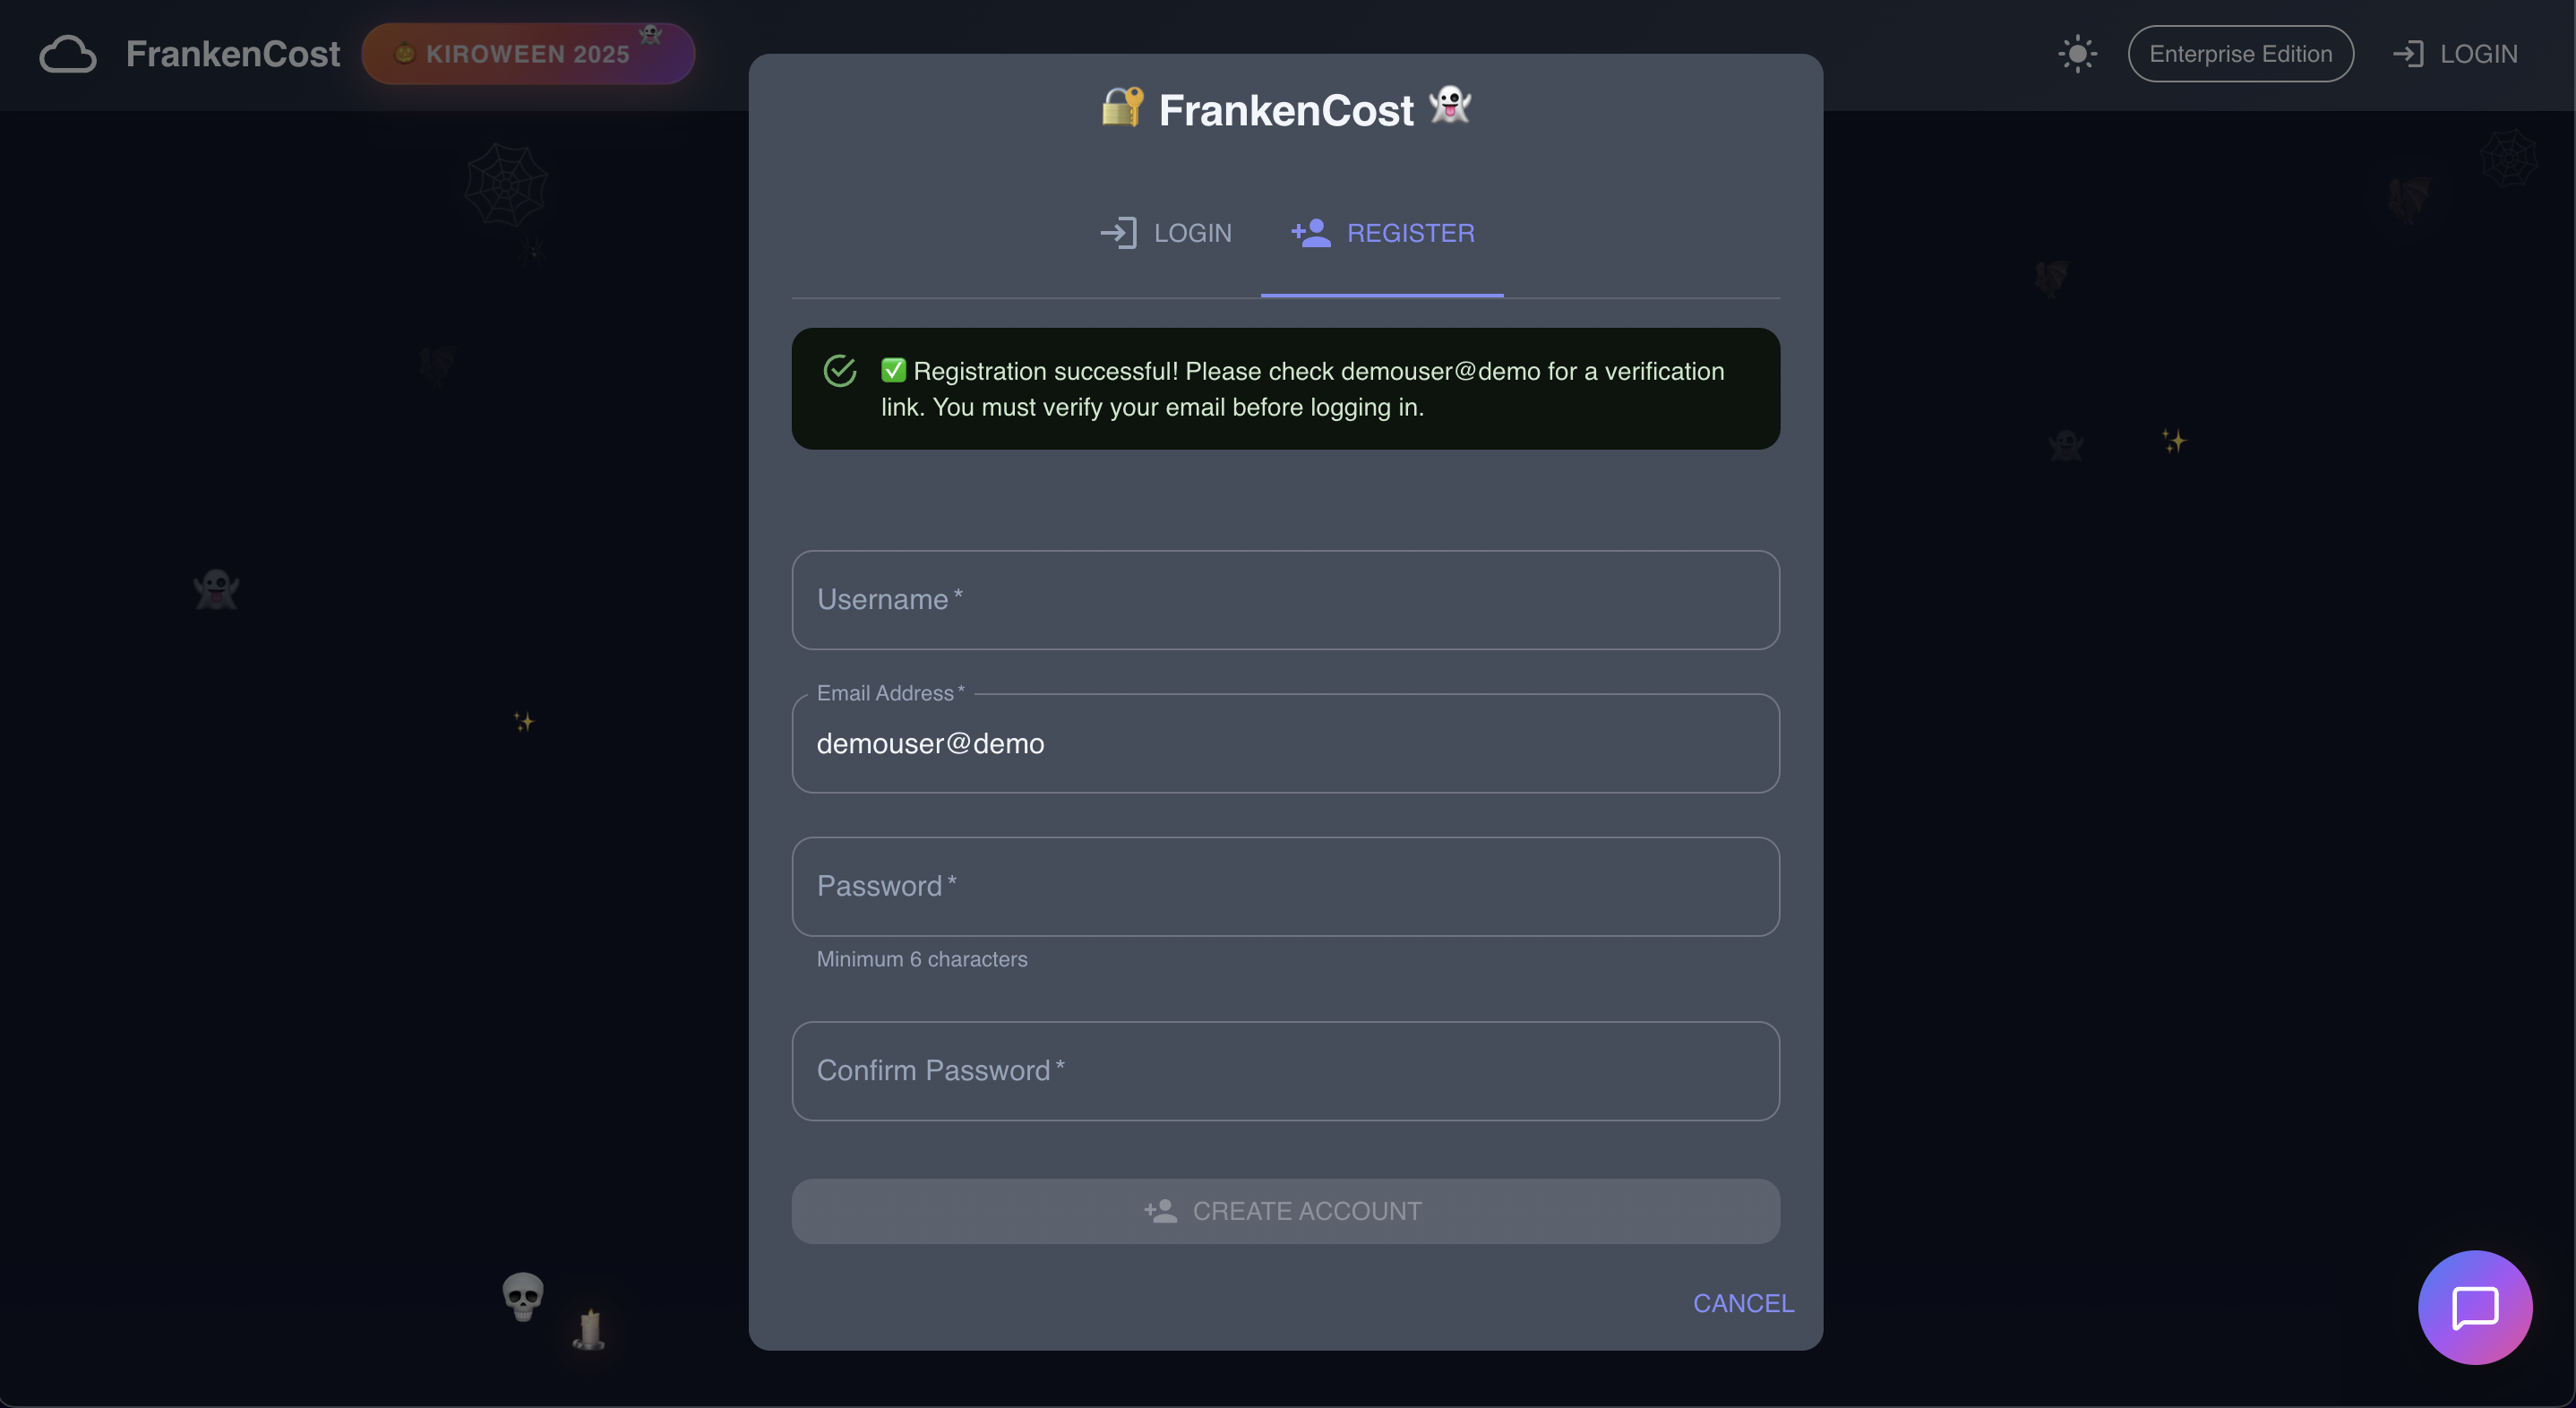
User Registration successful, User registration is auto verified for demo purpose, click the login page and enter the credentials
-
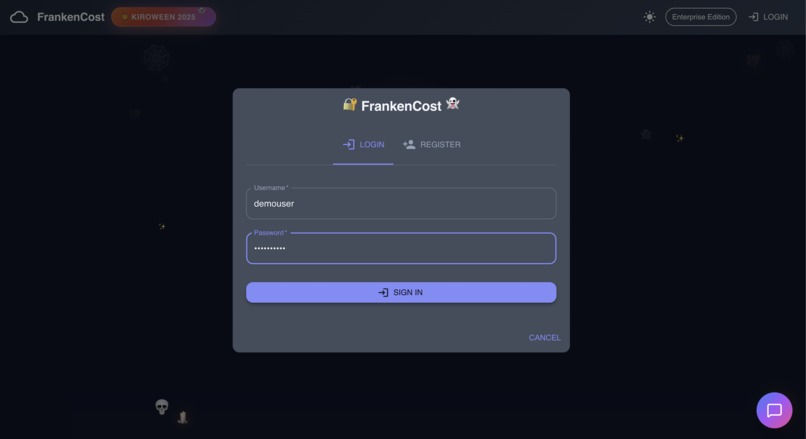
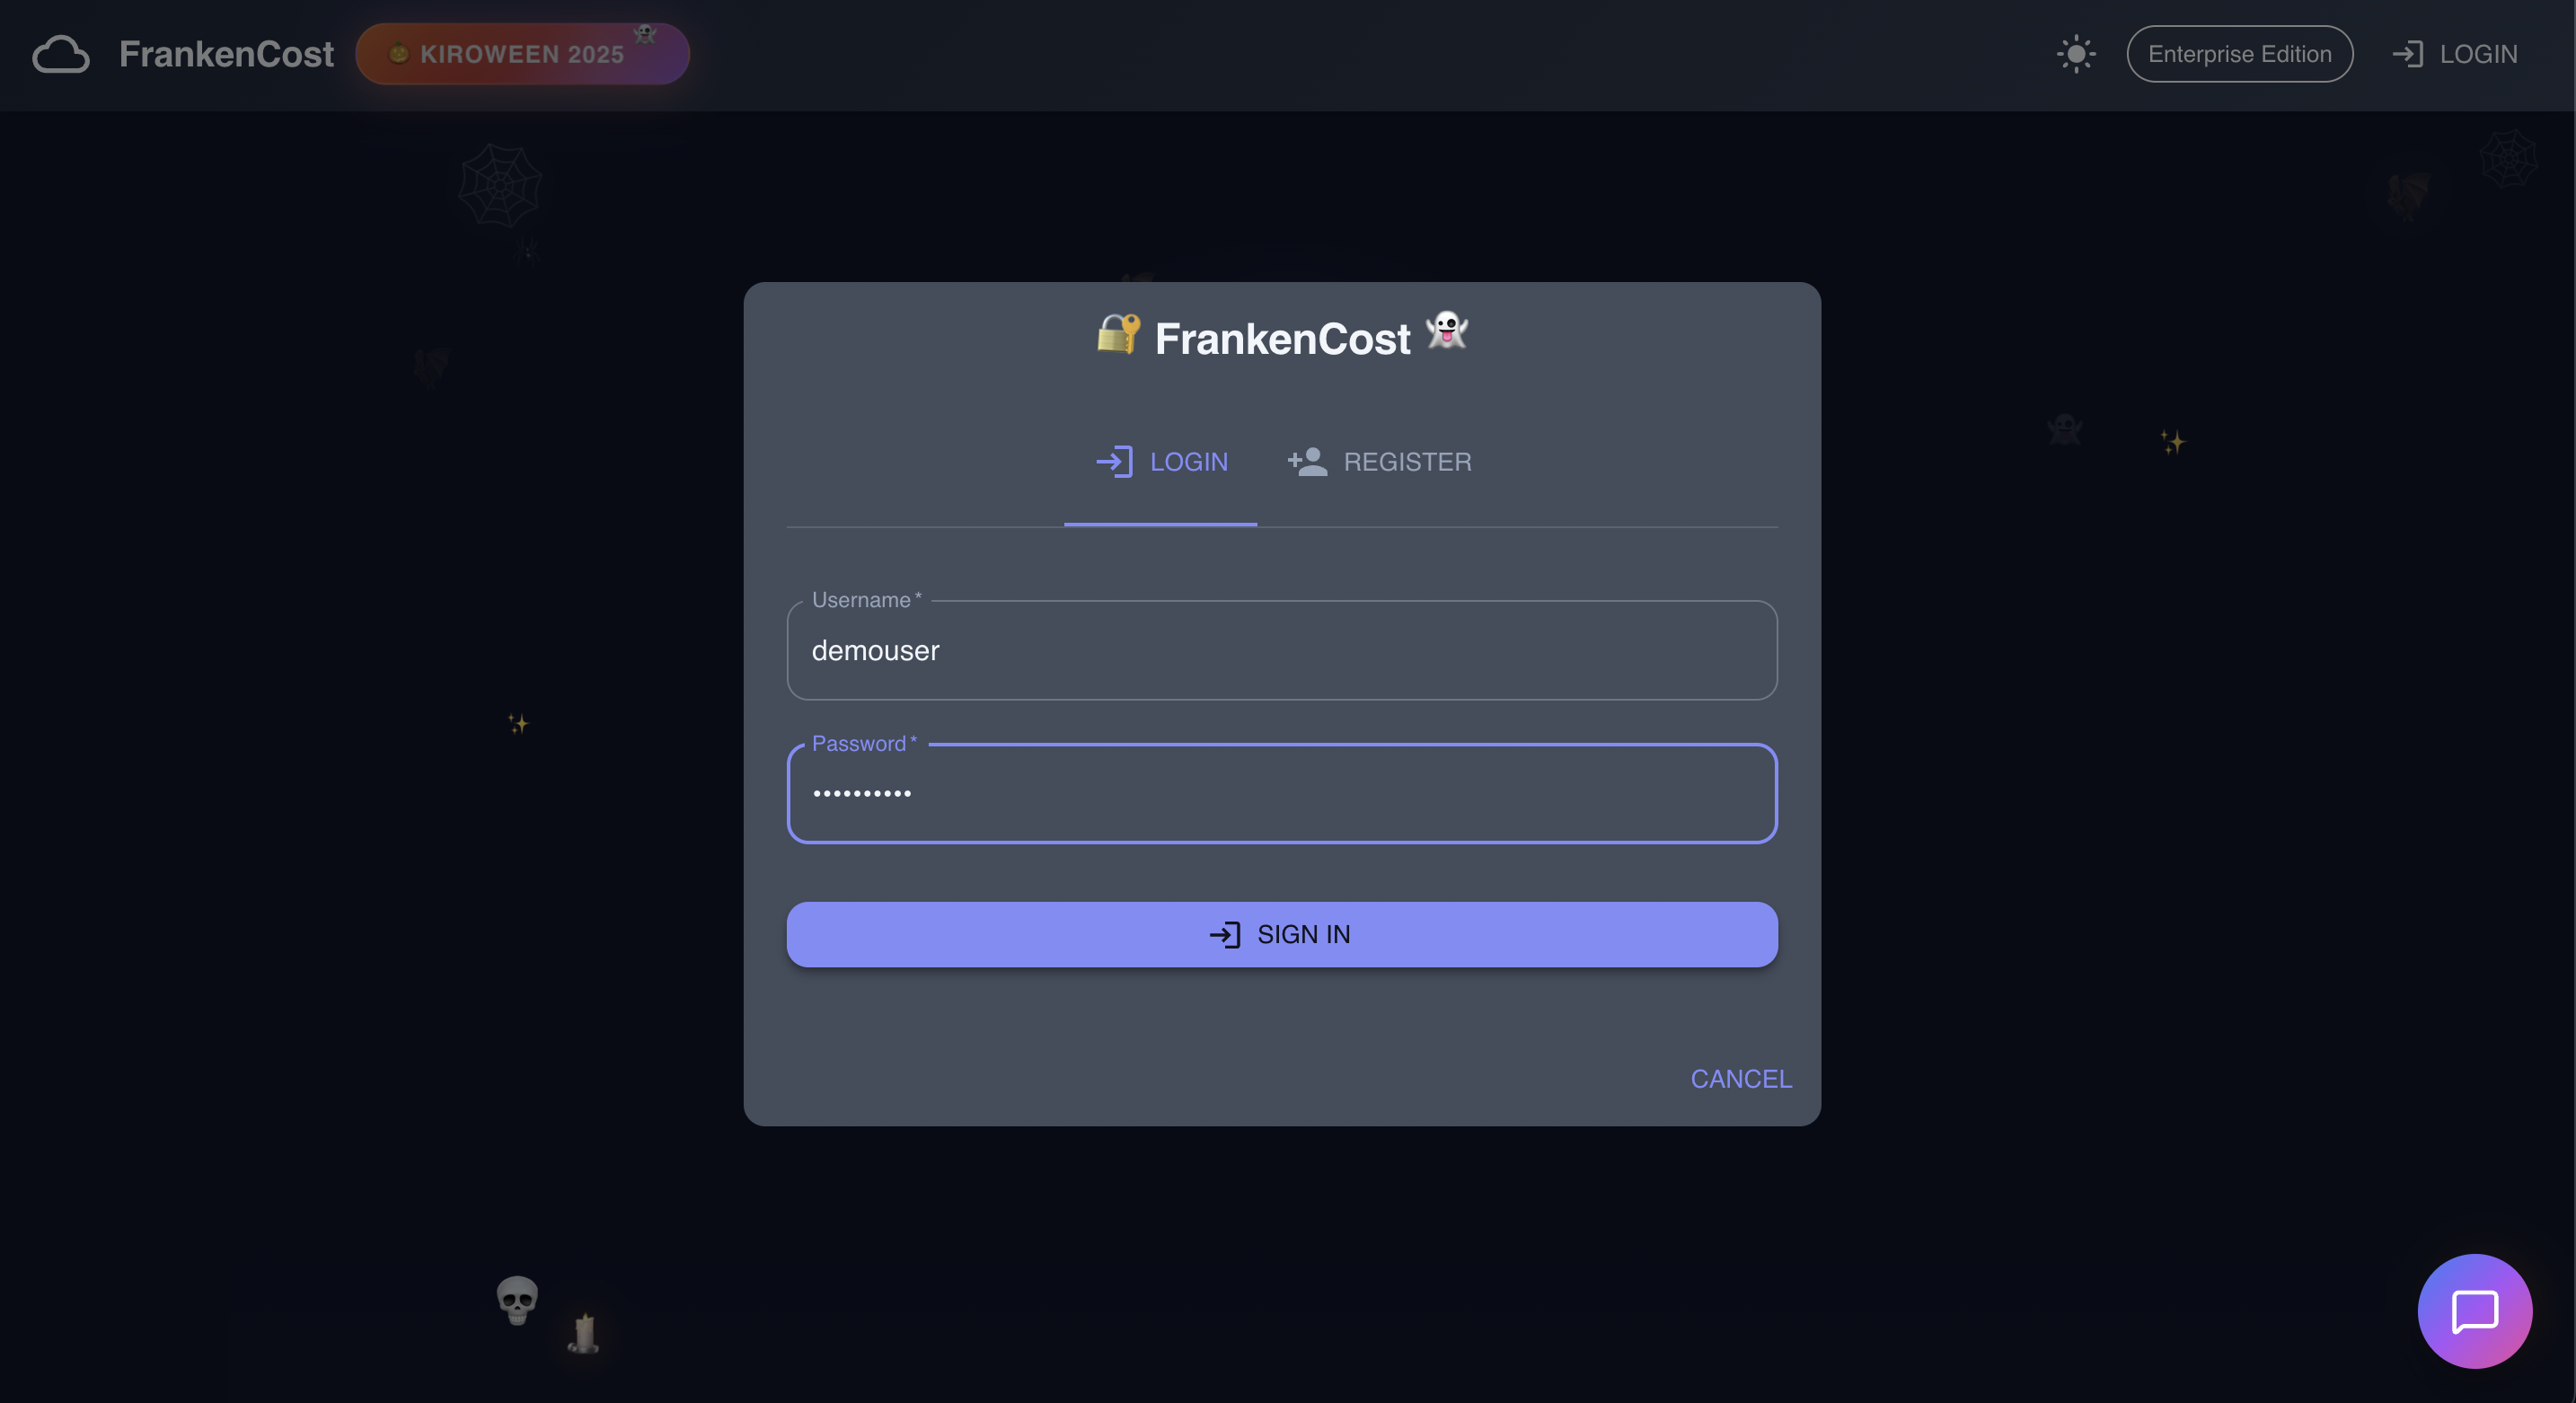
User entering the credentials
-
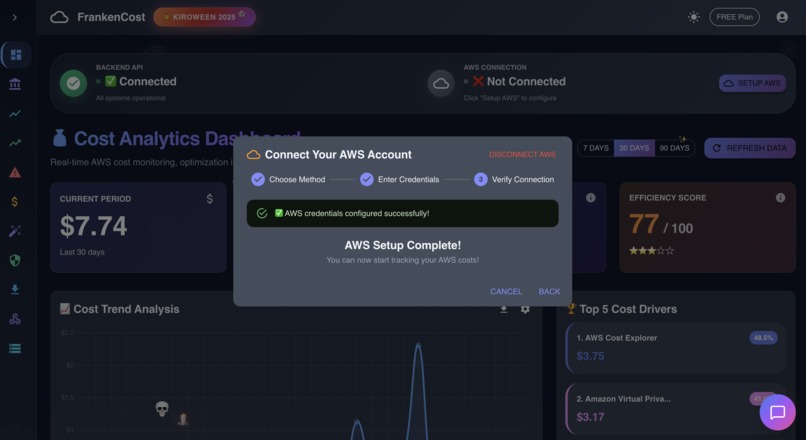
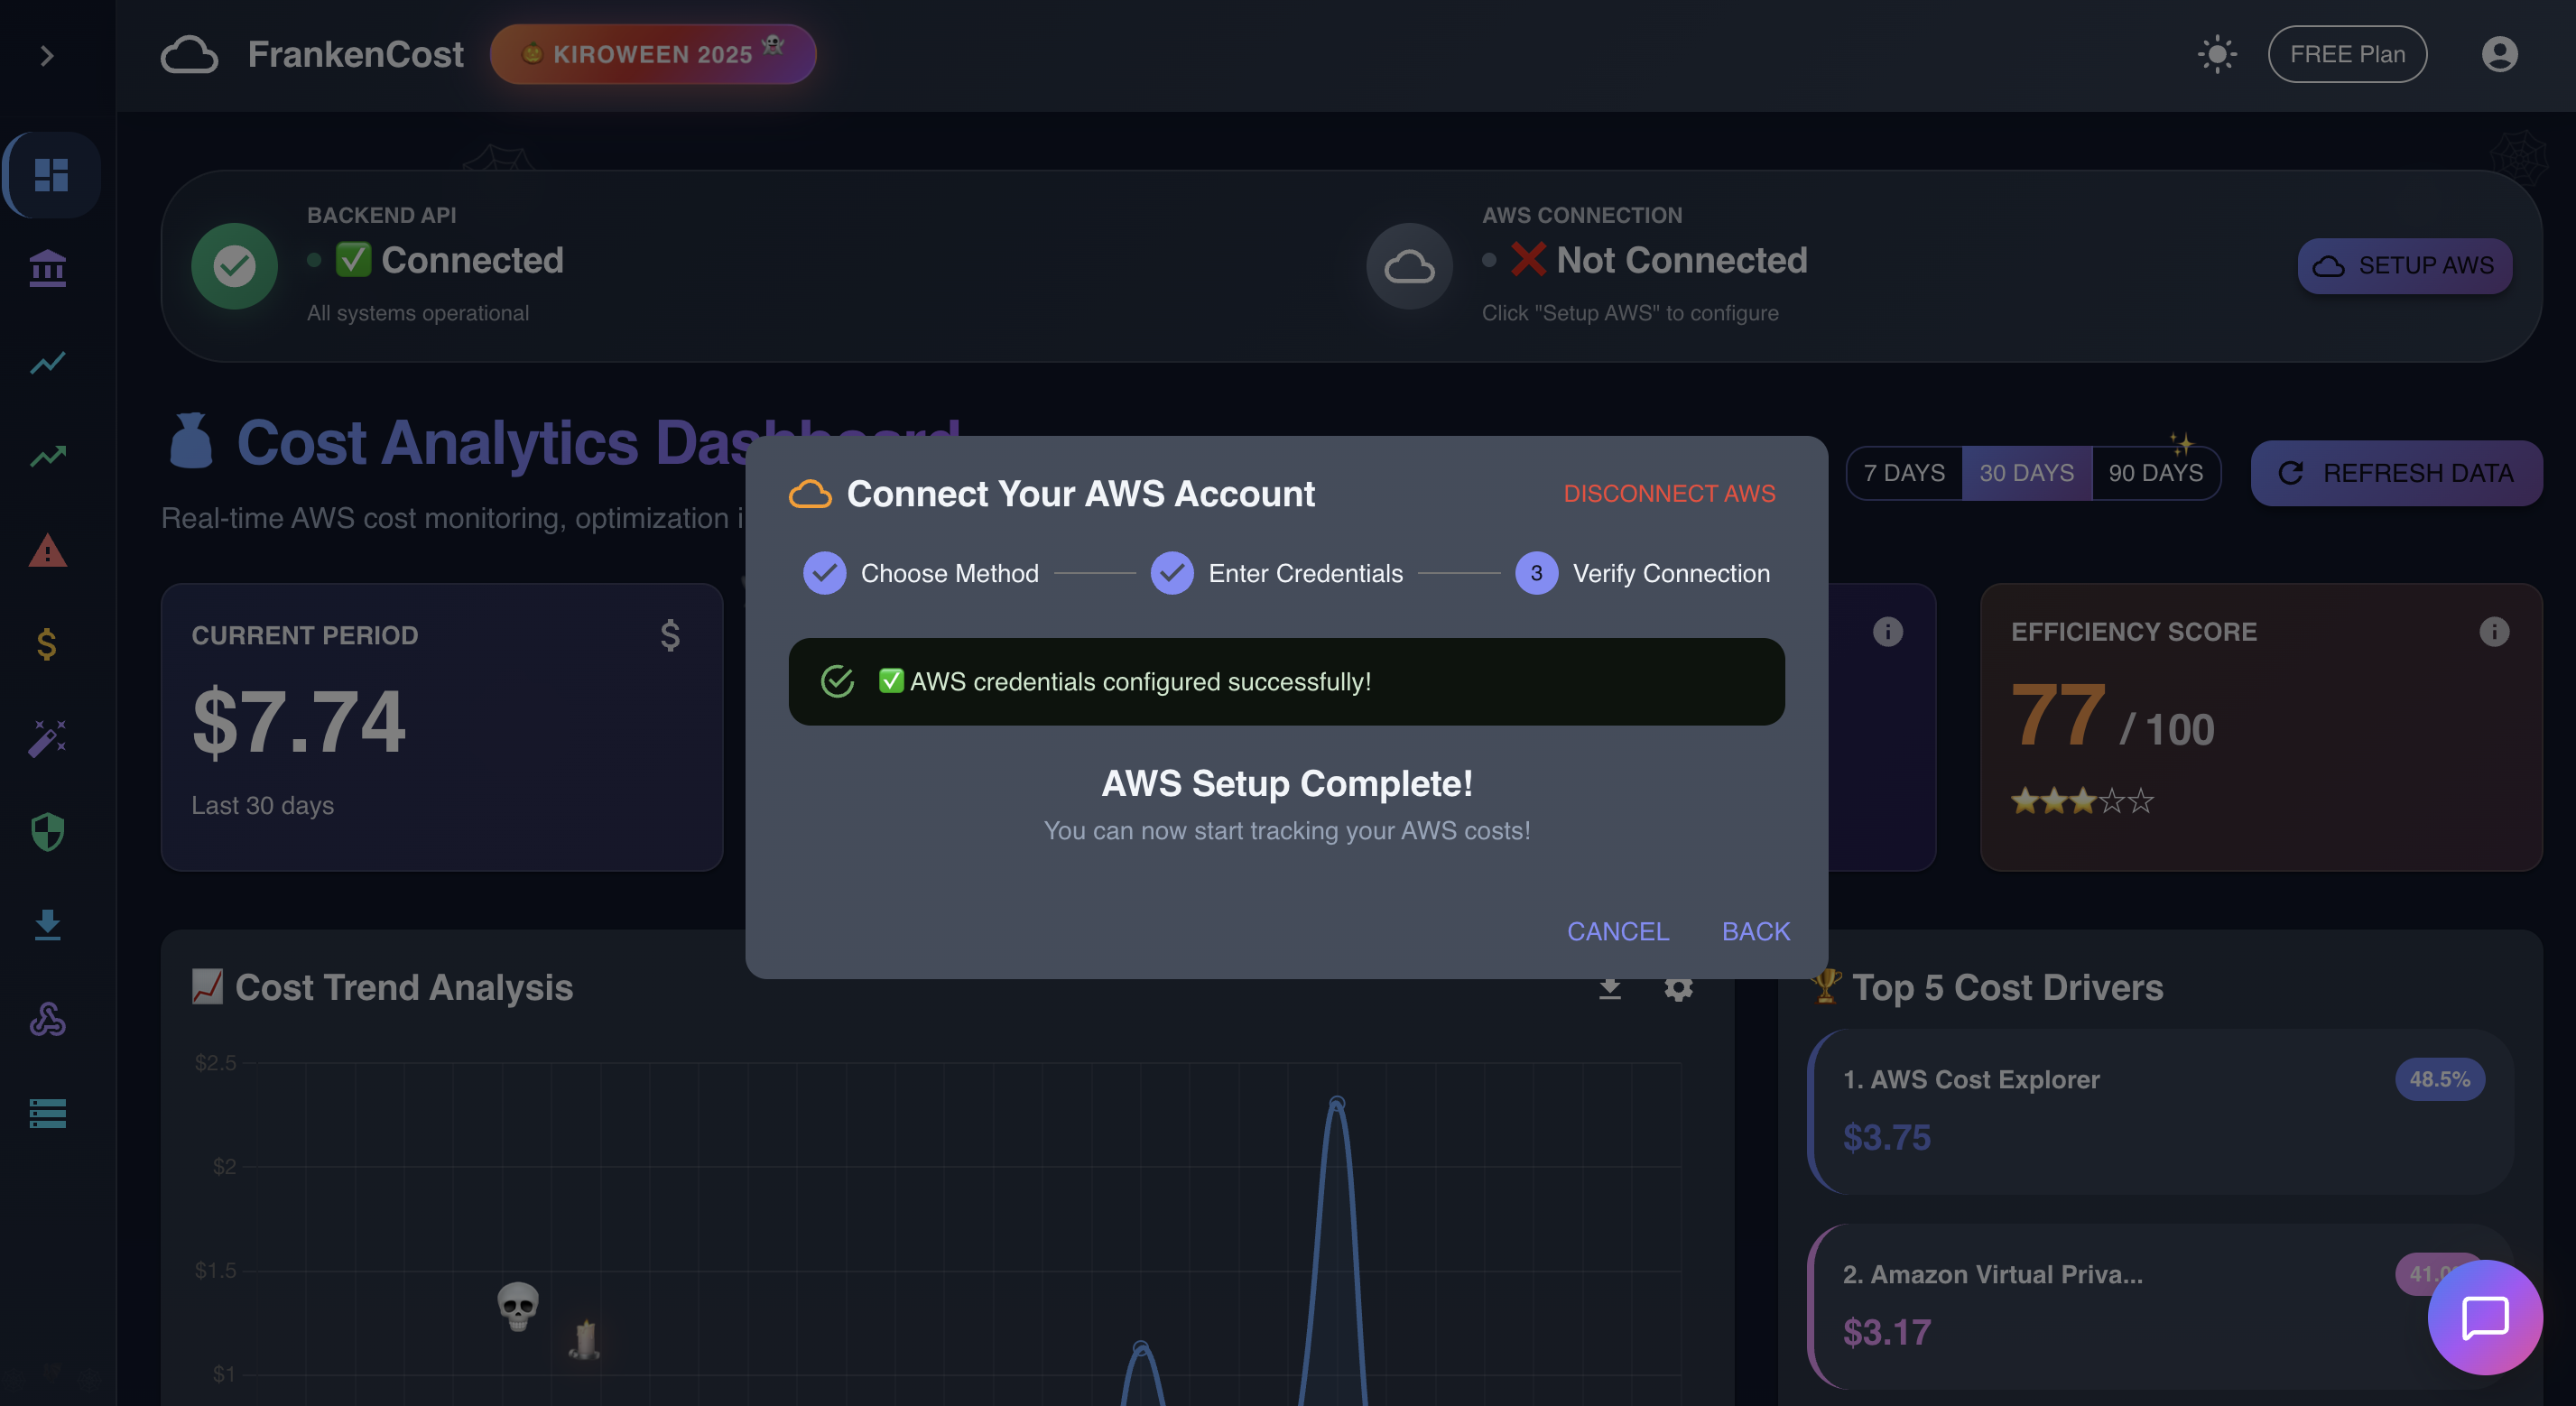
For real time data user need to enter the AWS credentials , for demo purpose fall back method is also added
-
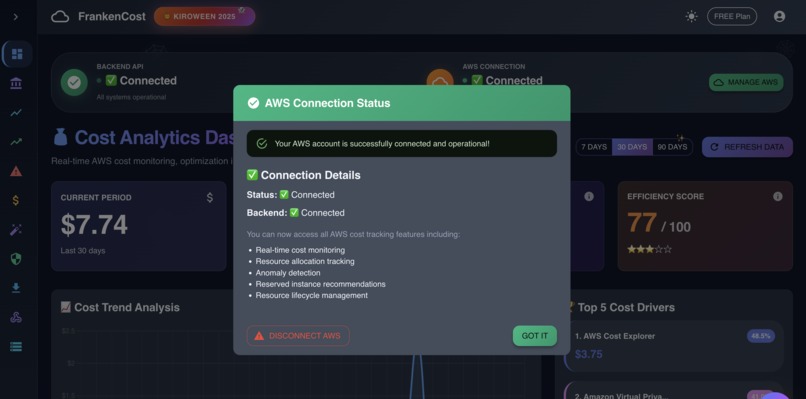
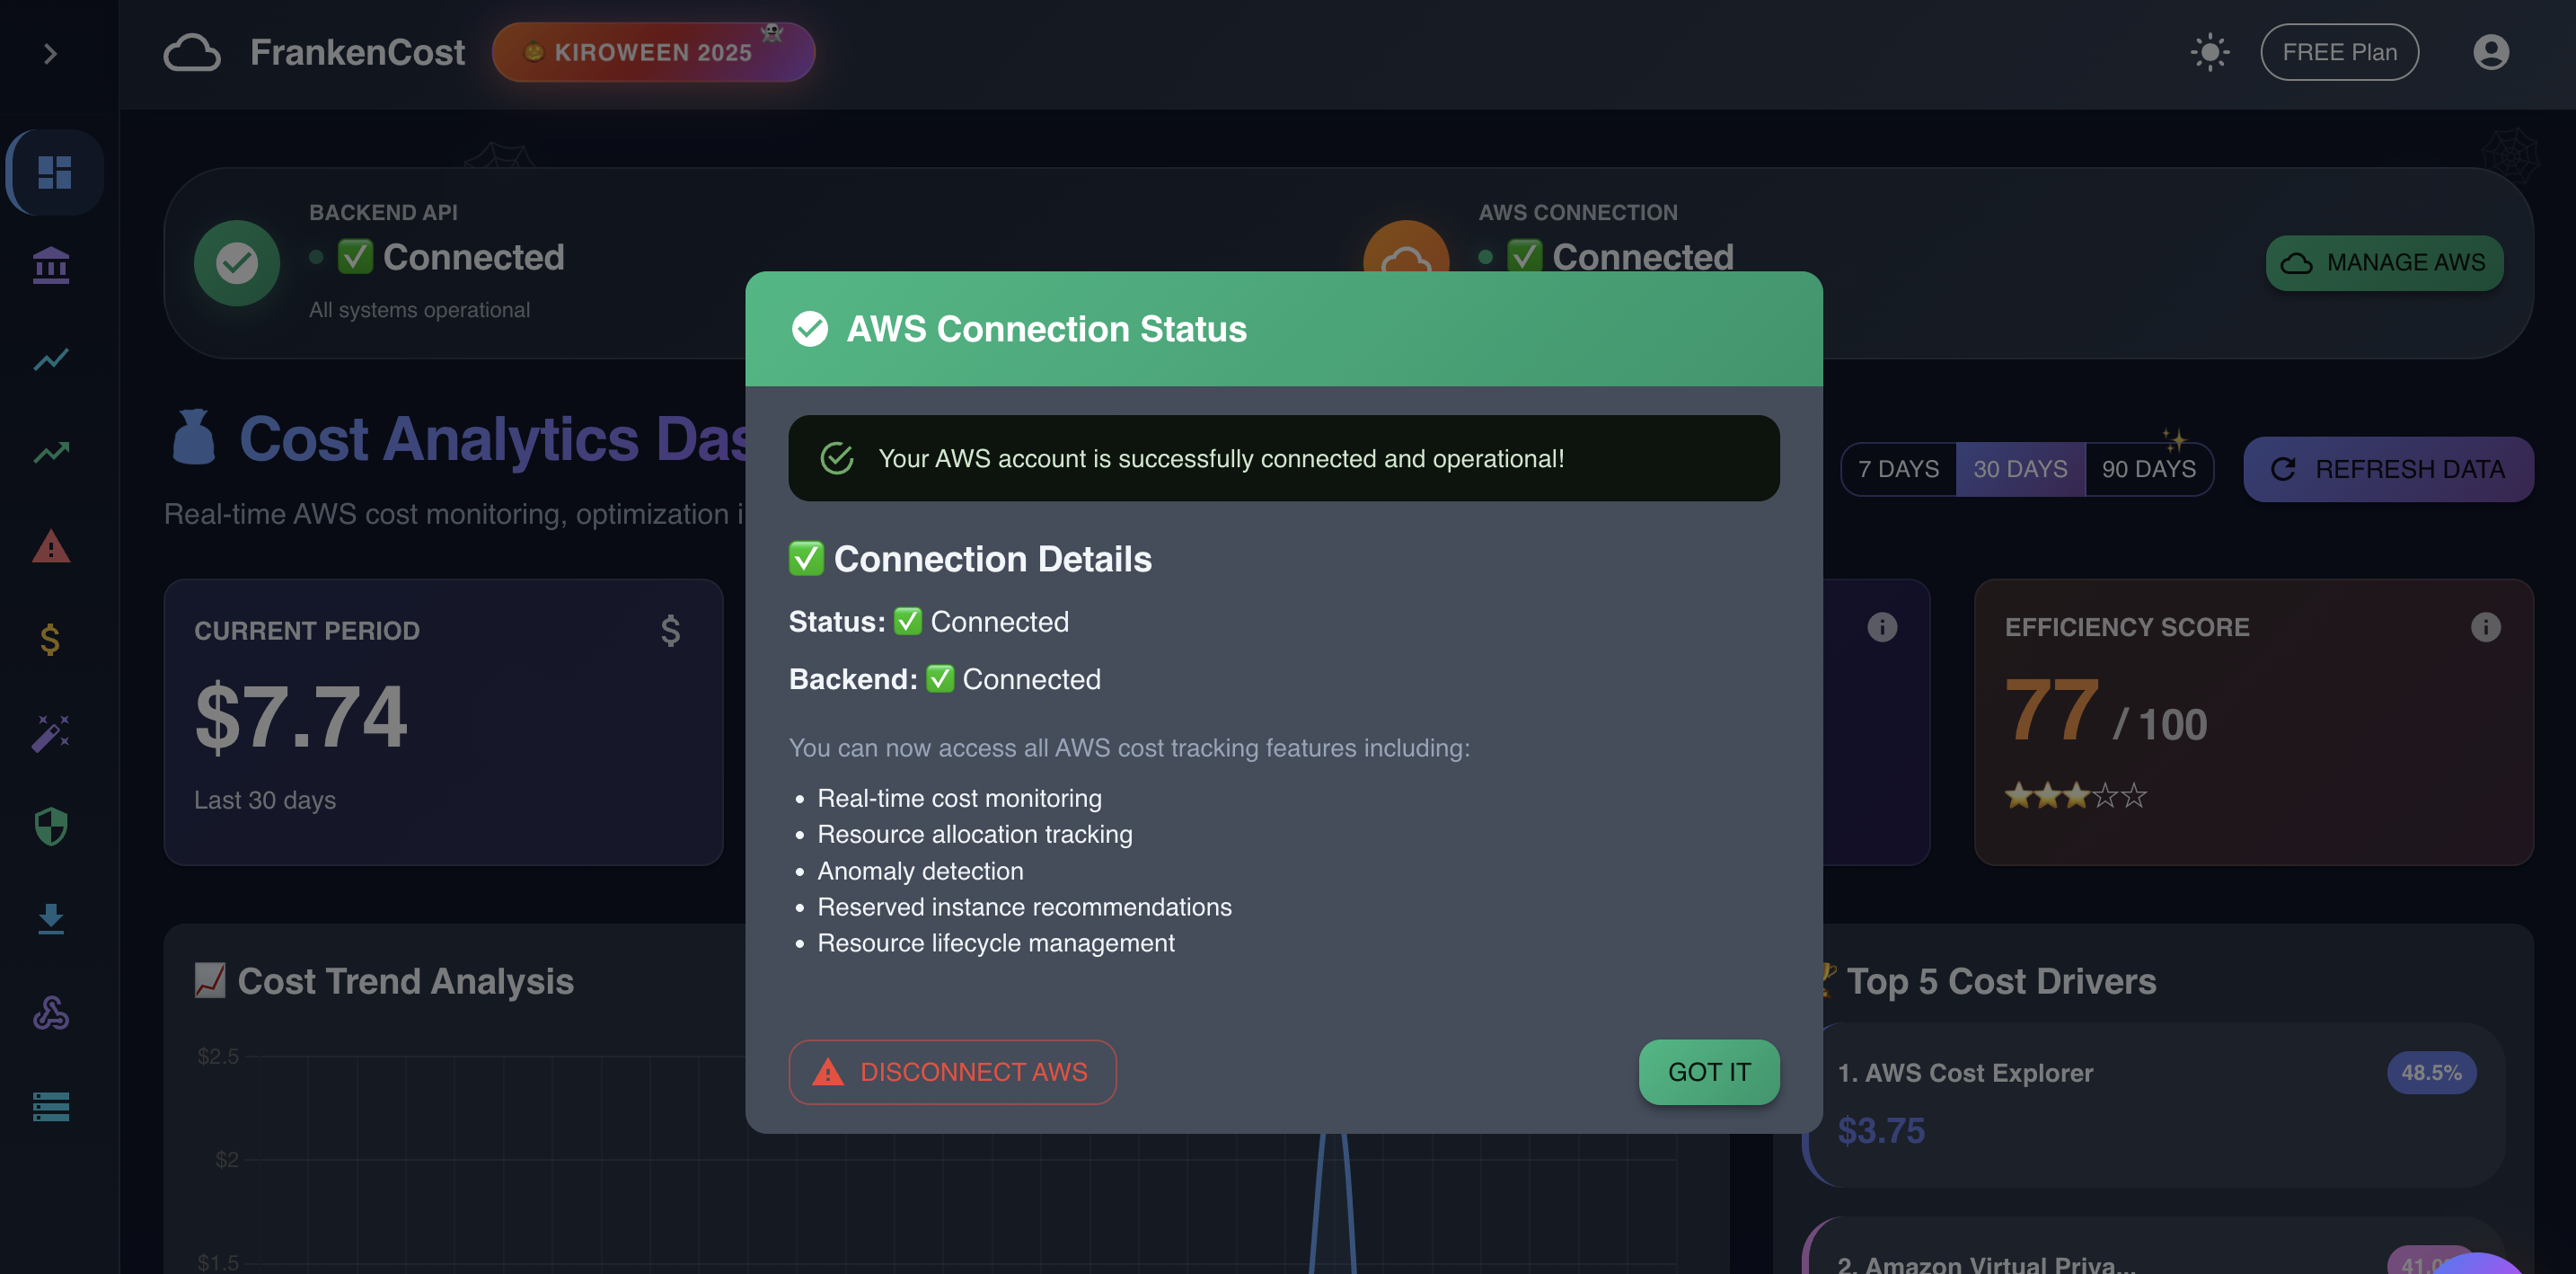
Application successfully connected to AWS , even if user don't enter the AWS credentials , application will still work on fallback demo data
-
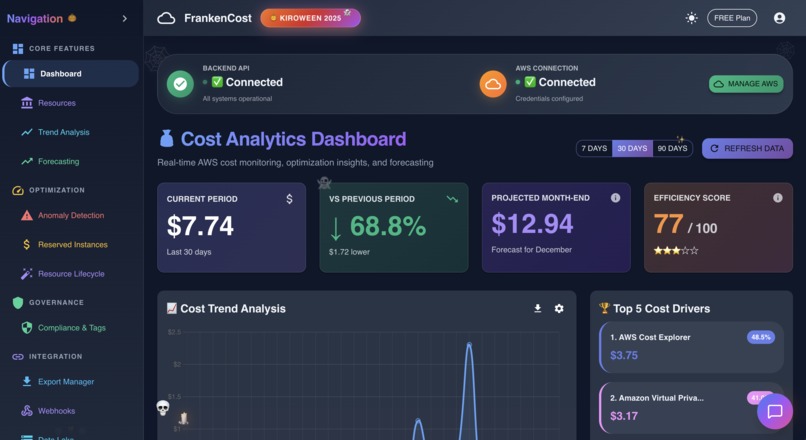
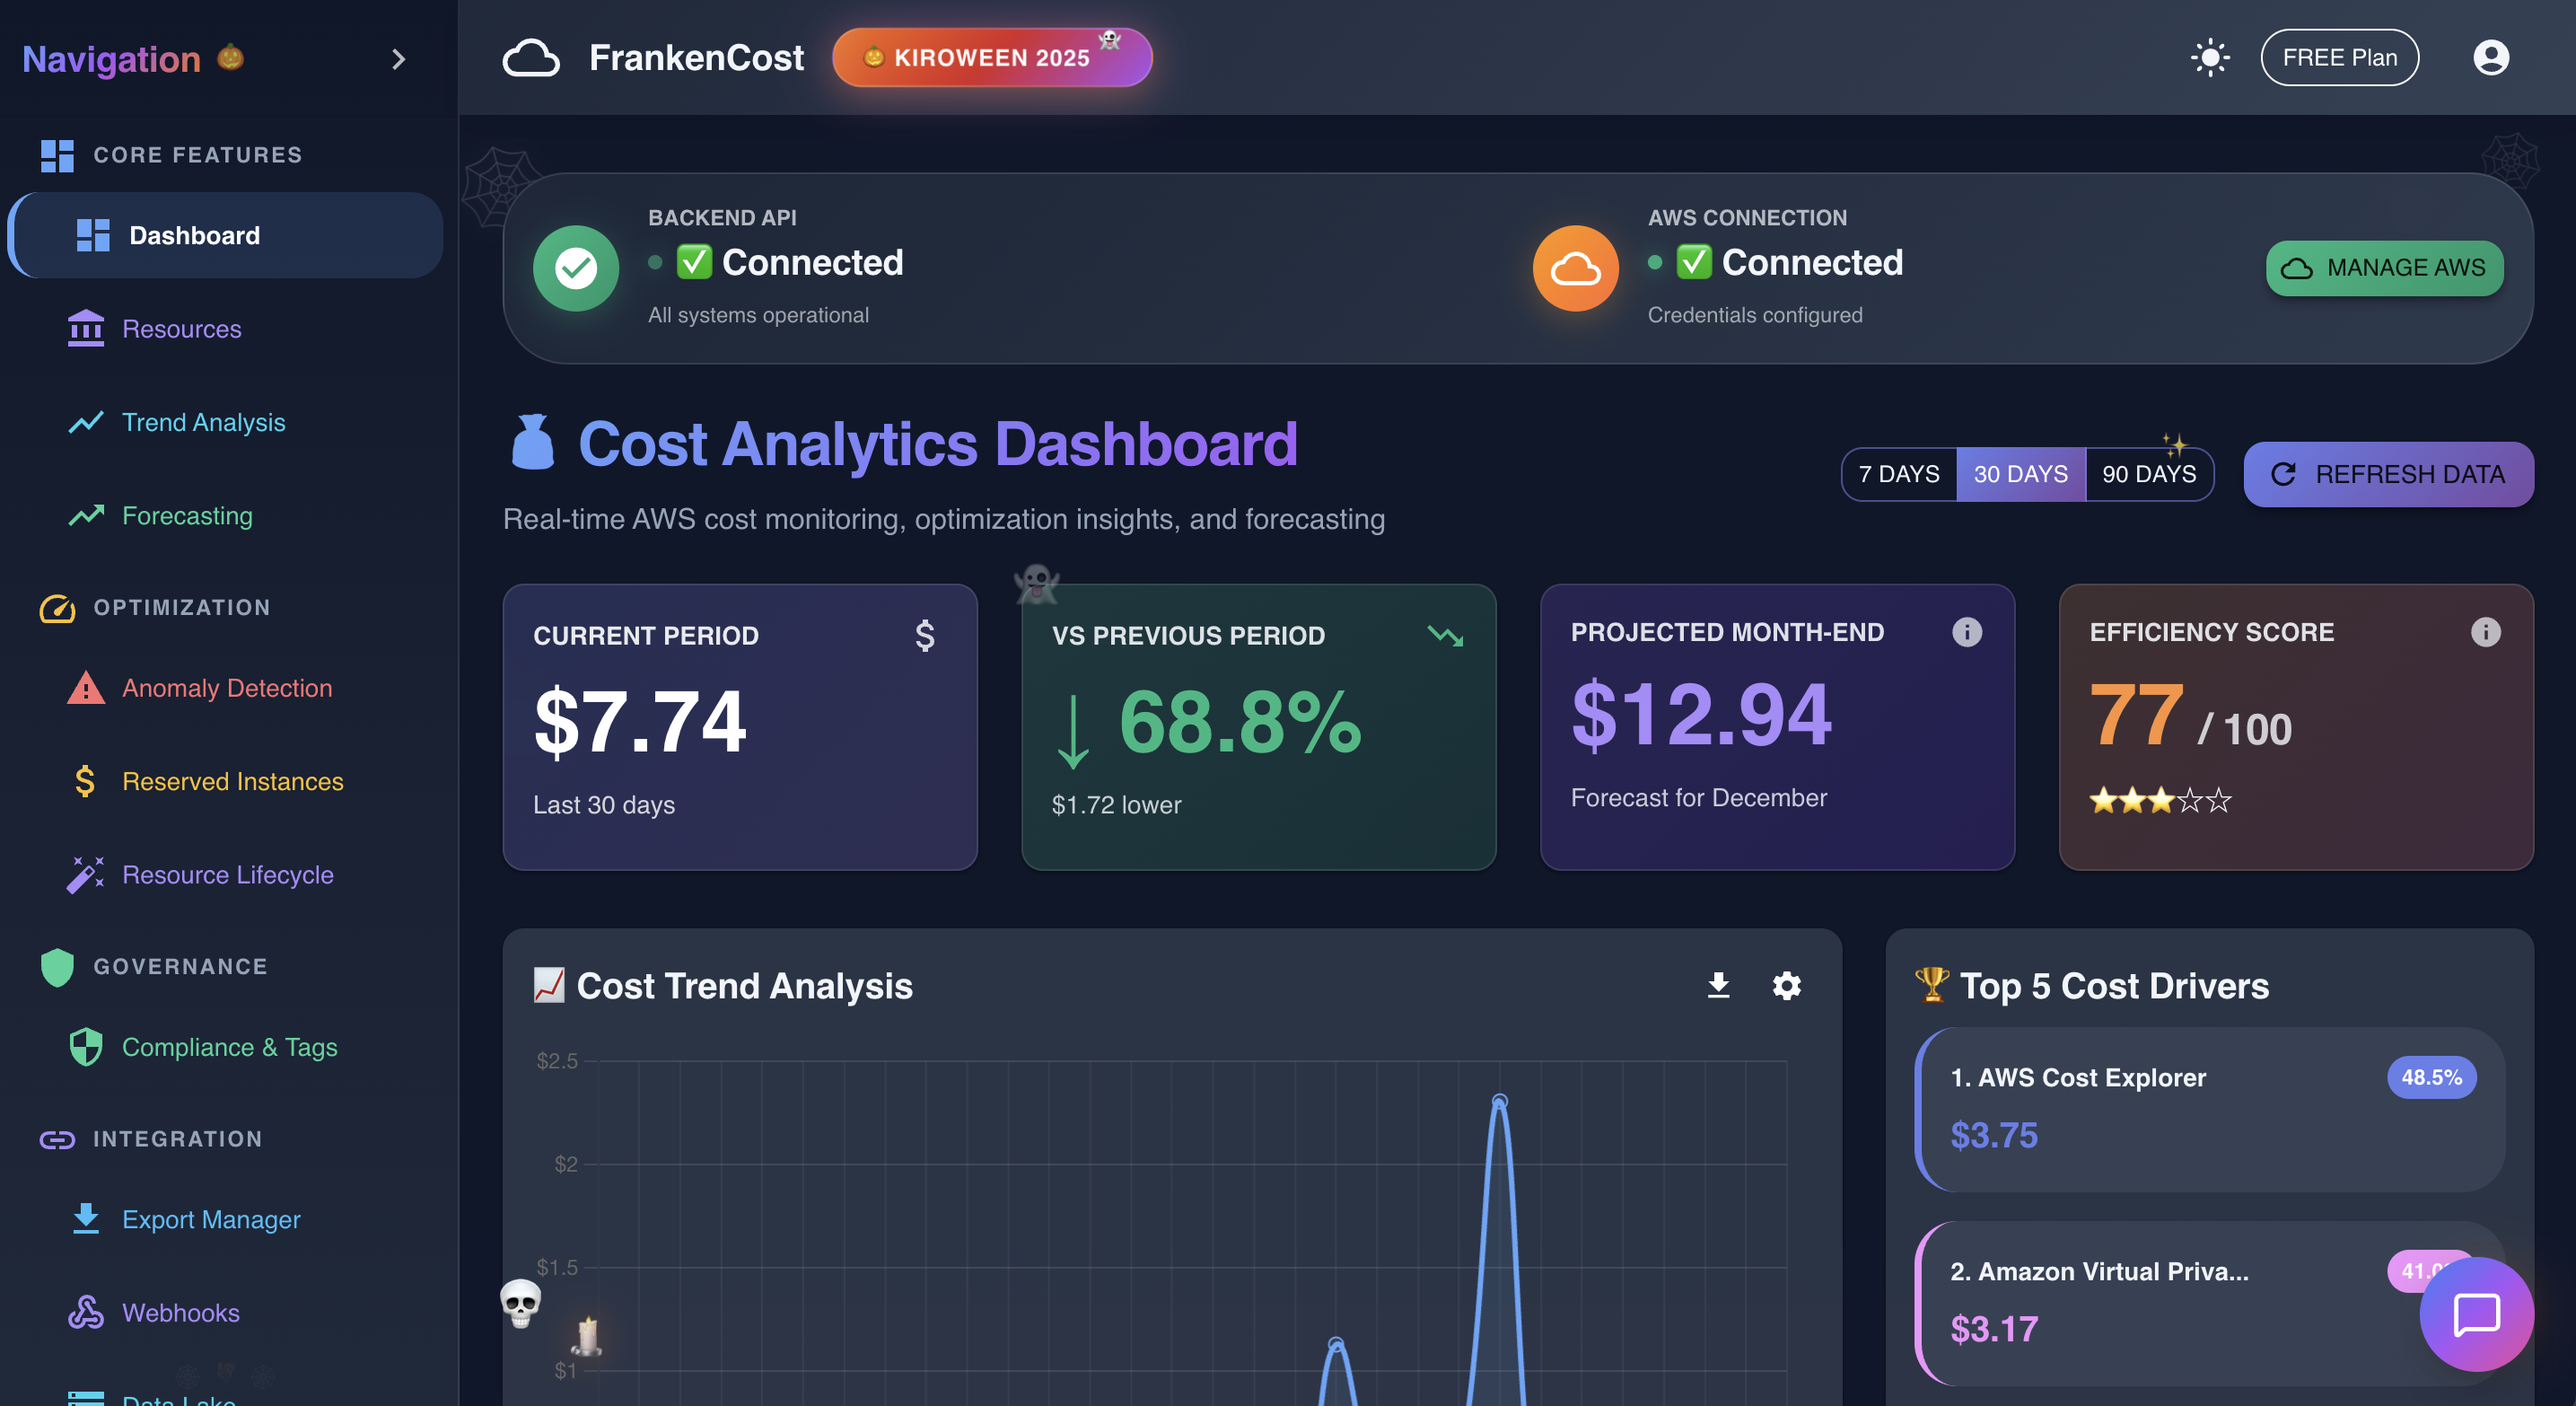
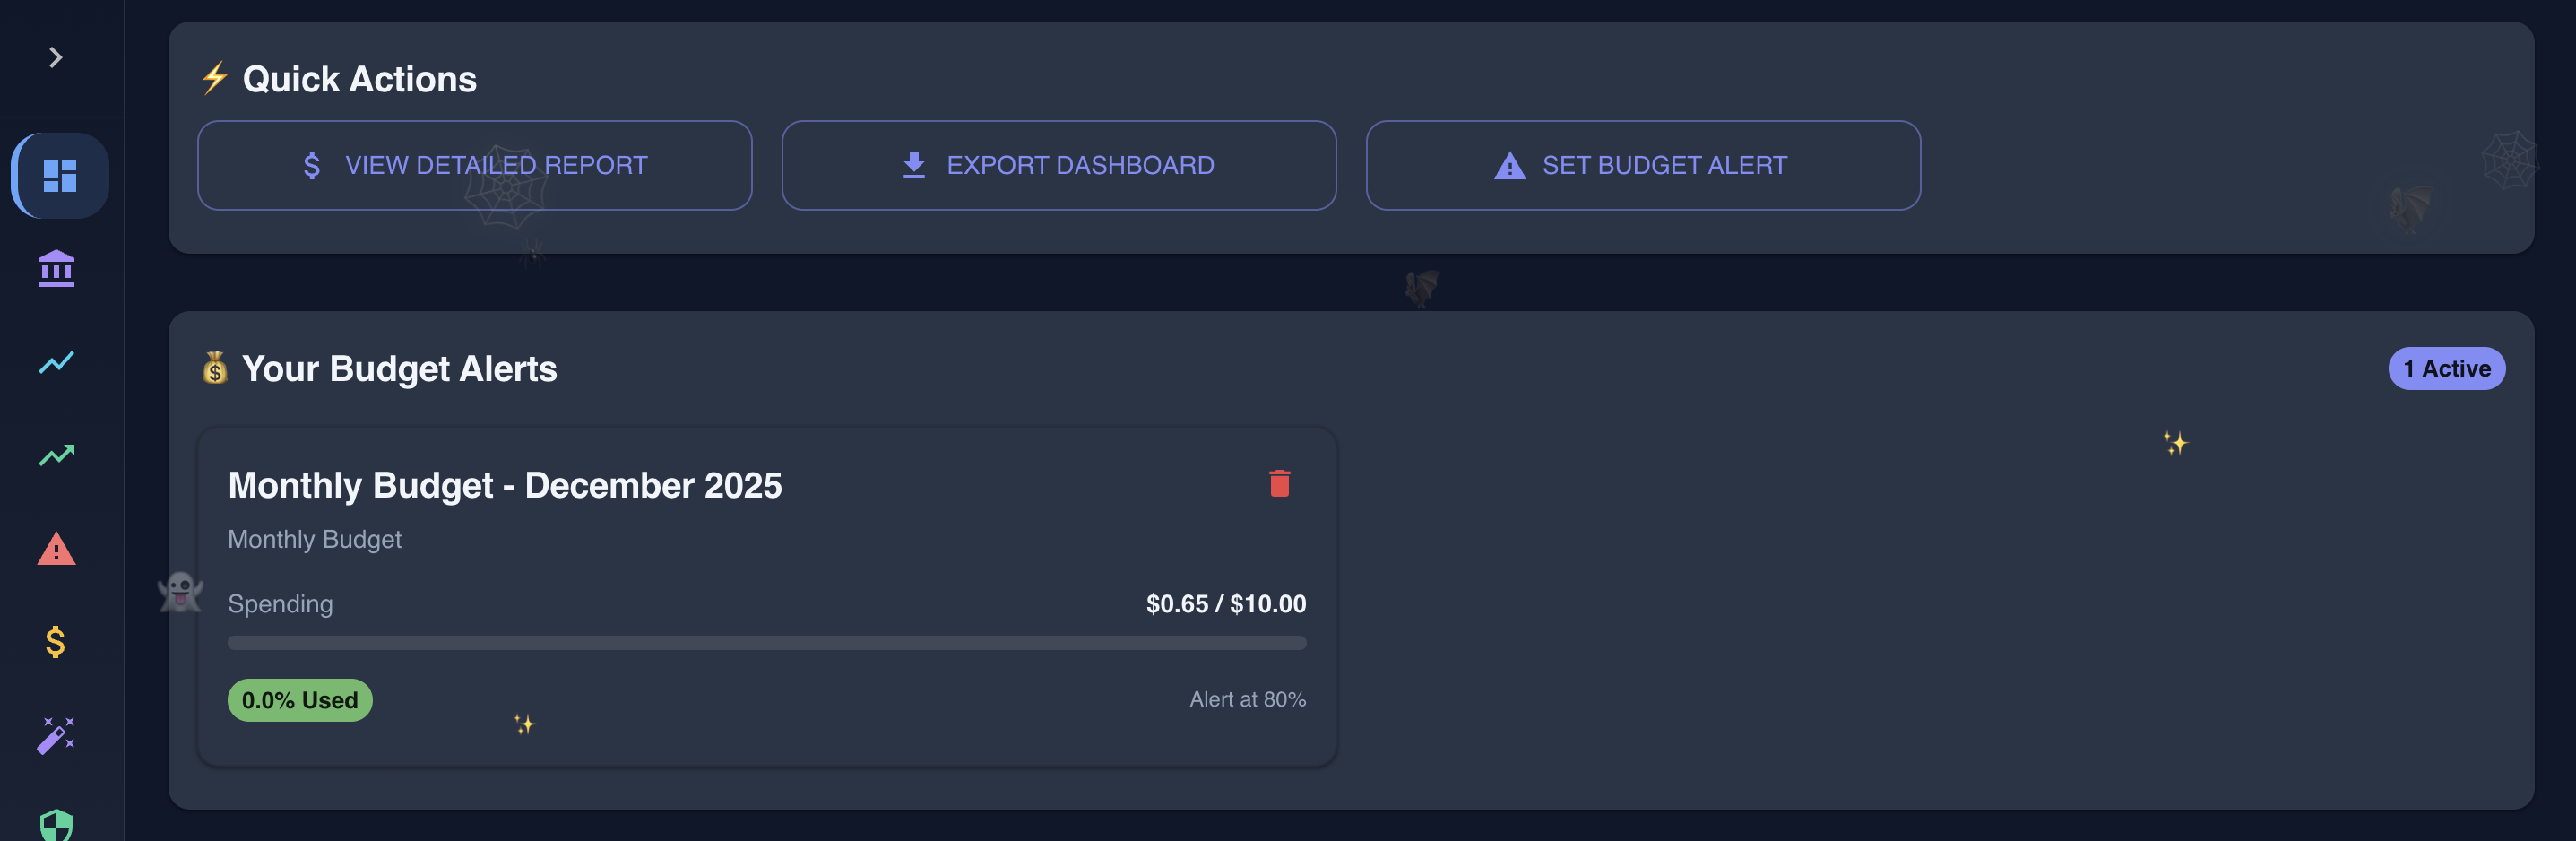
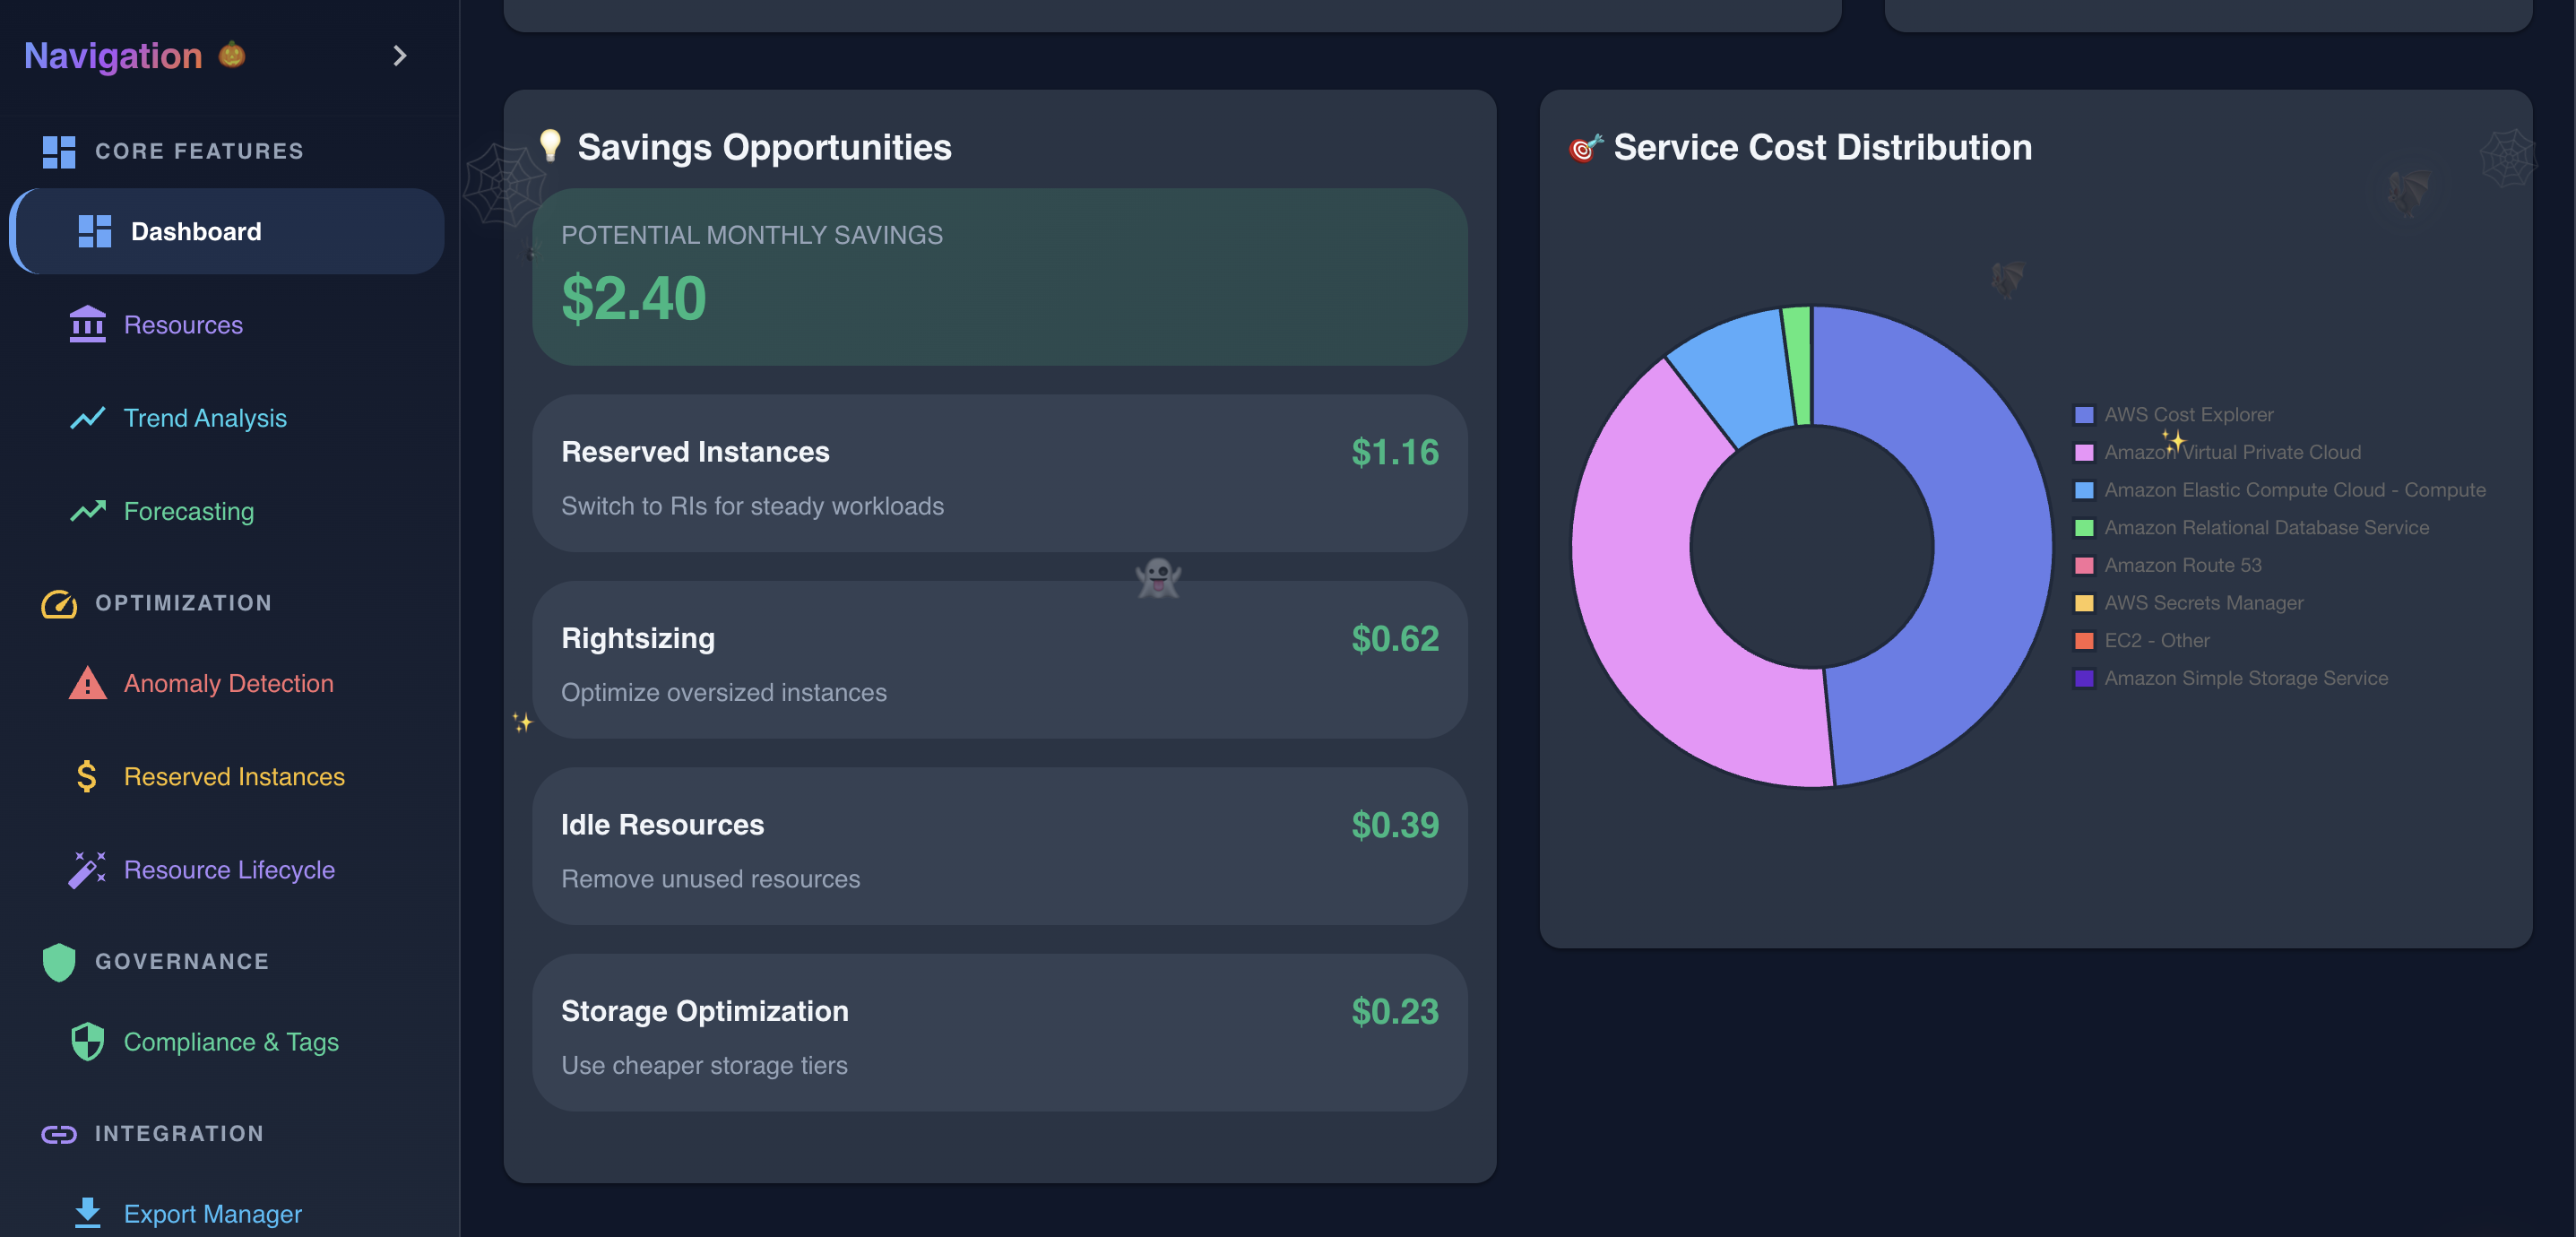
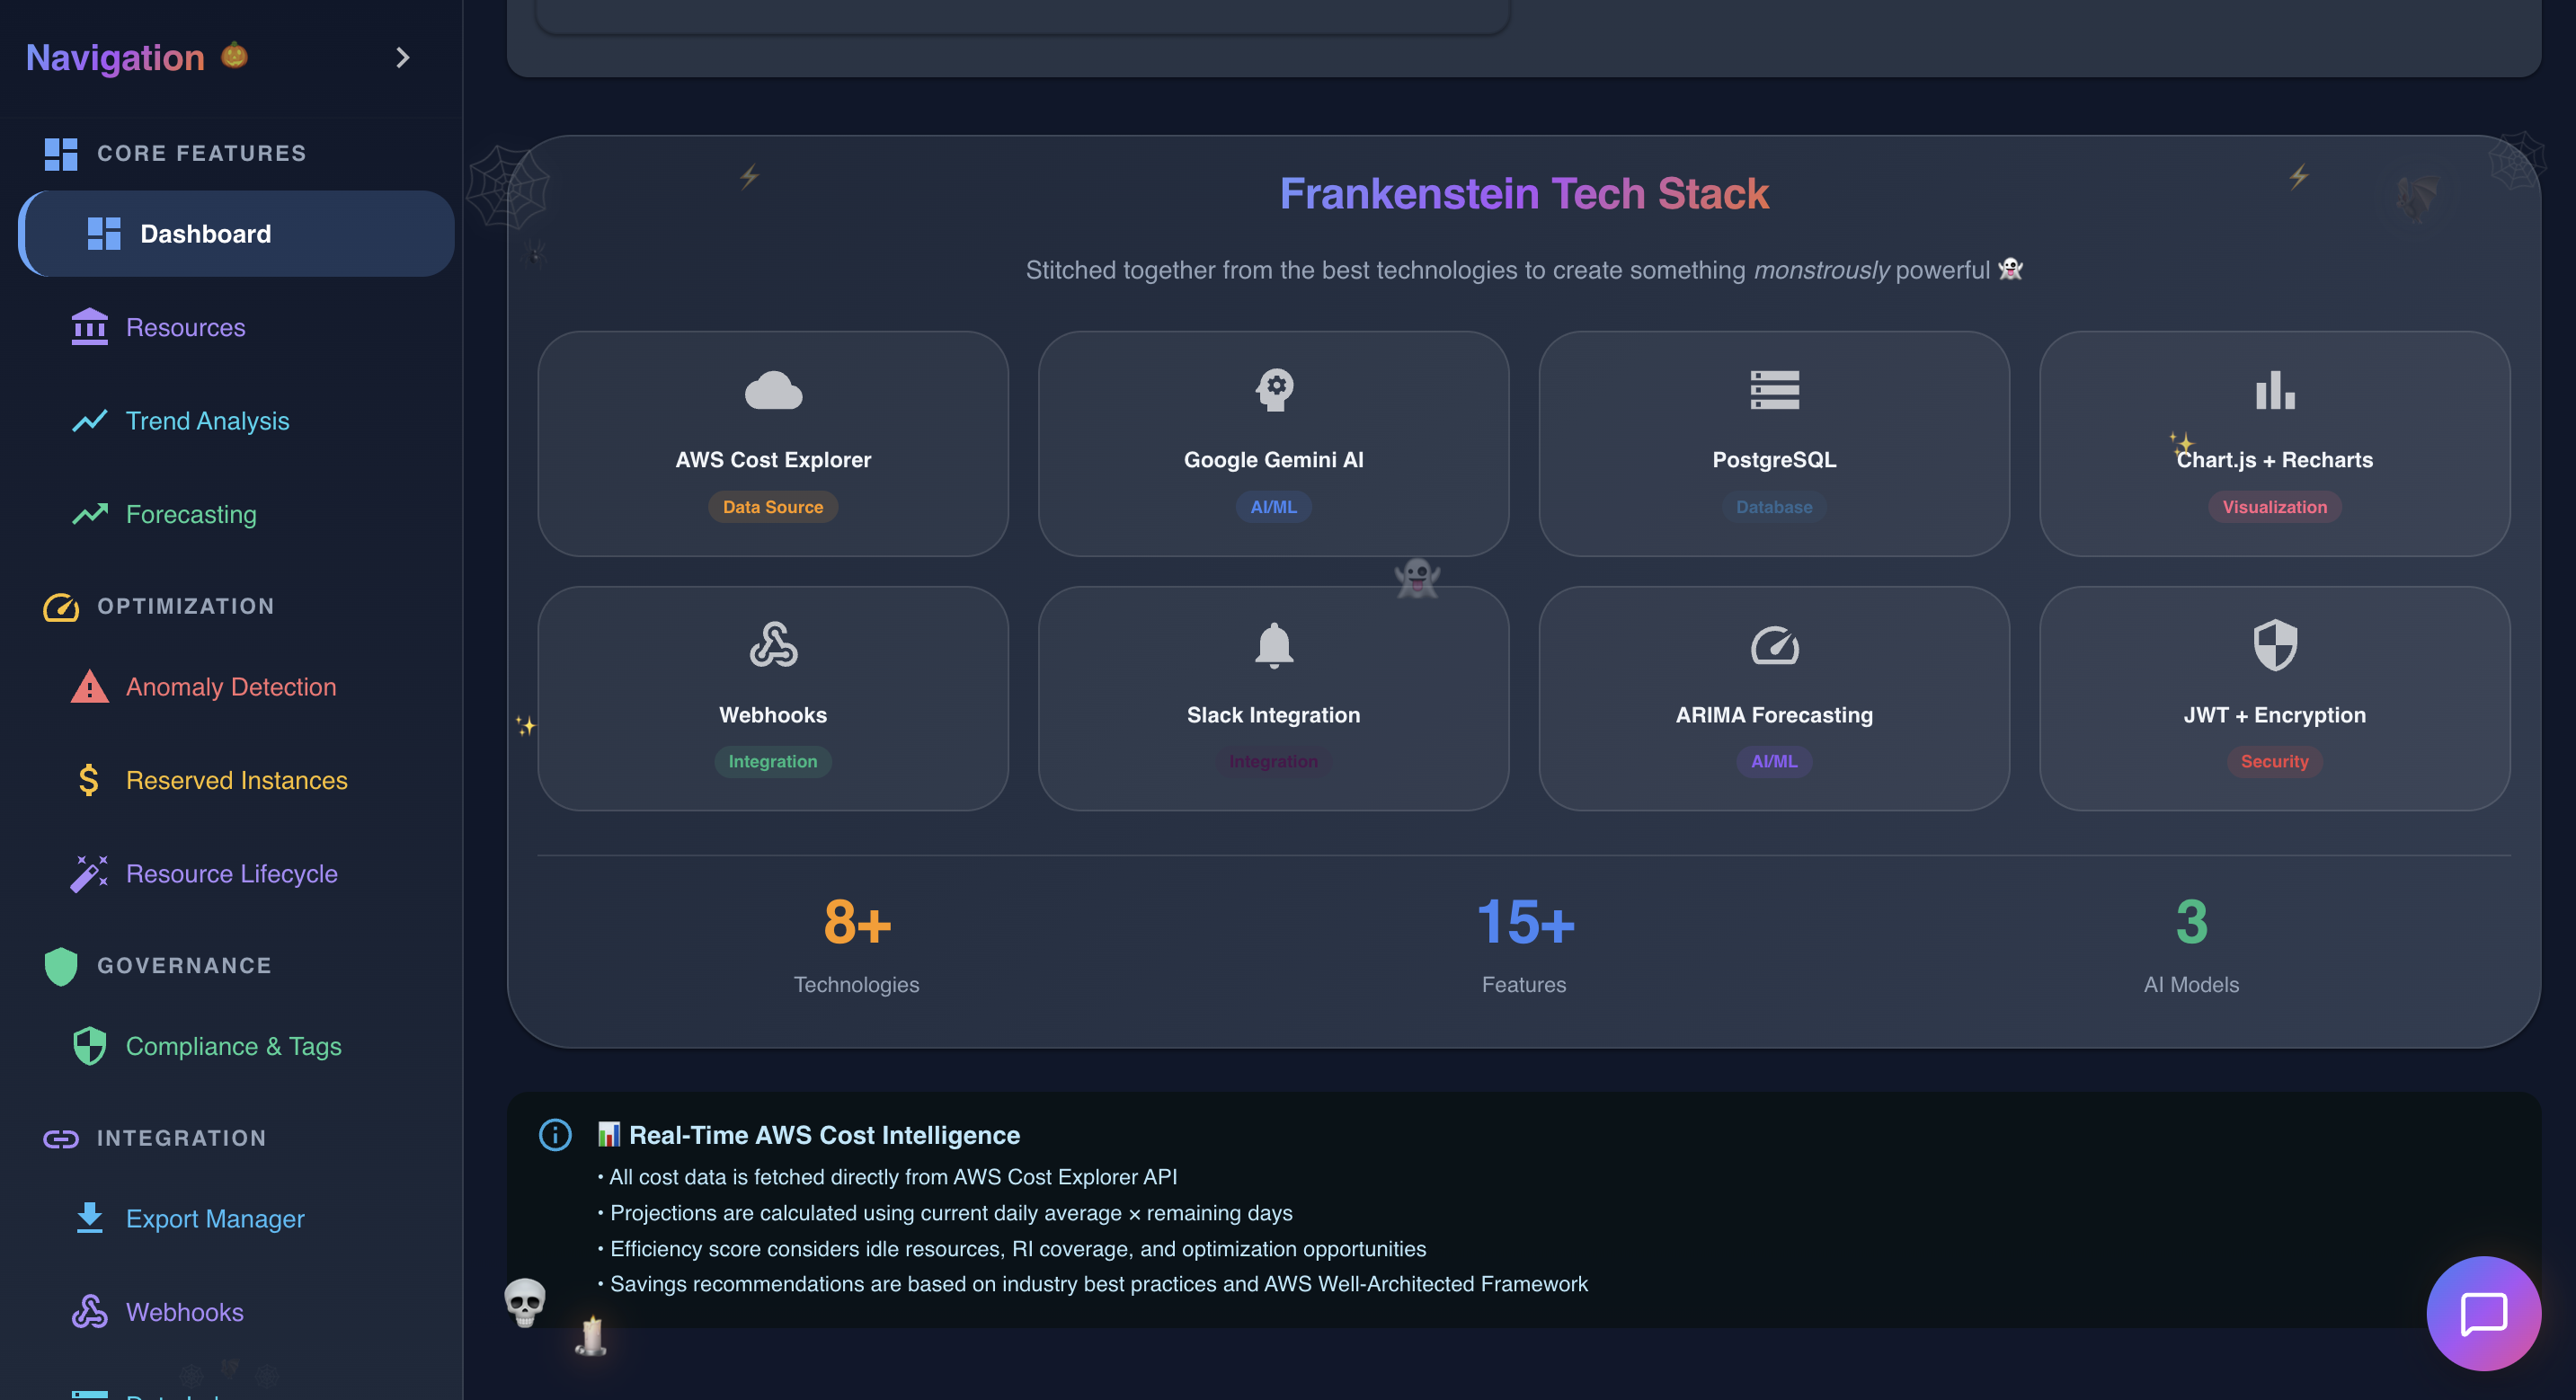
Dashboard in action showing various data
-
Dashboard in action showing various data
-
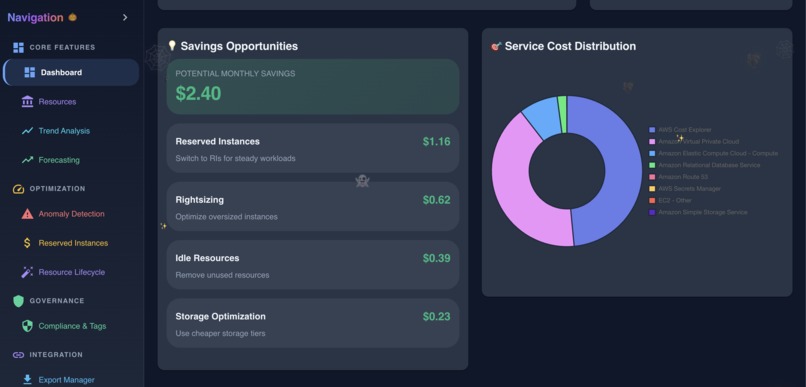
Dashboard in action showing various data
-
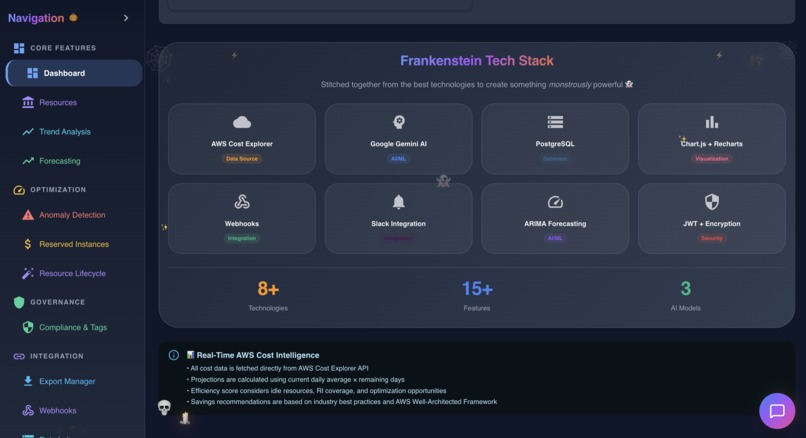
Dashboard in action showing various data
-

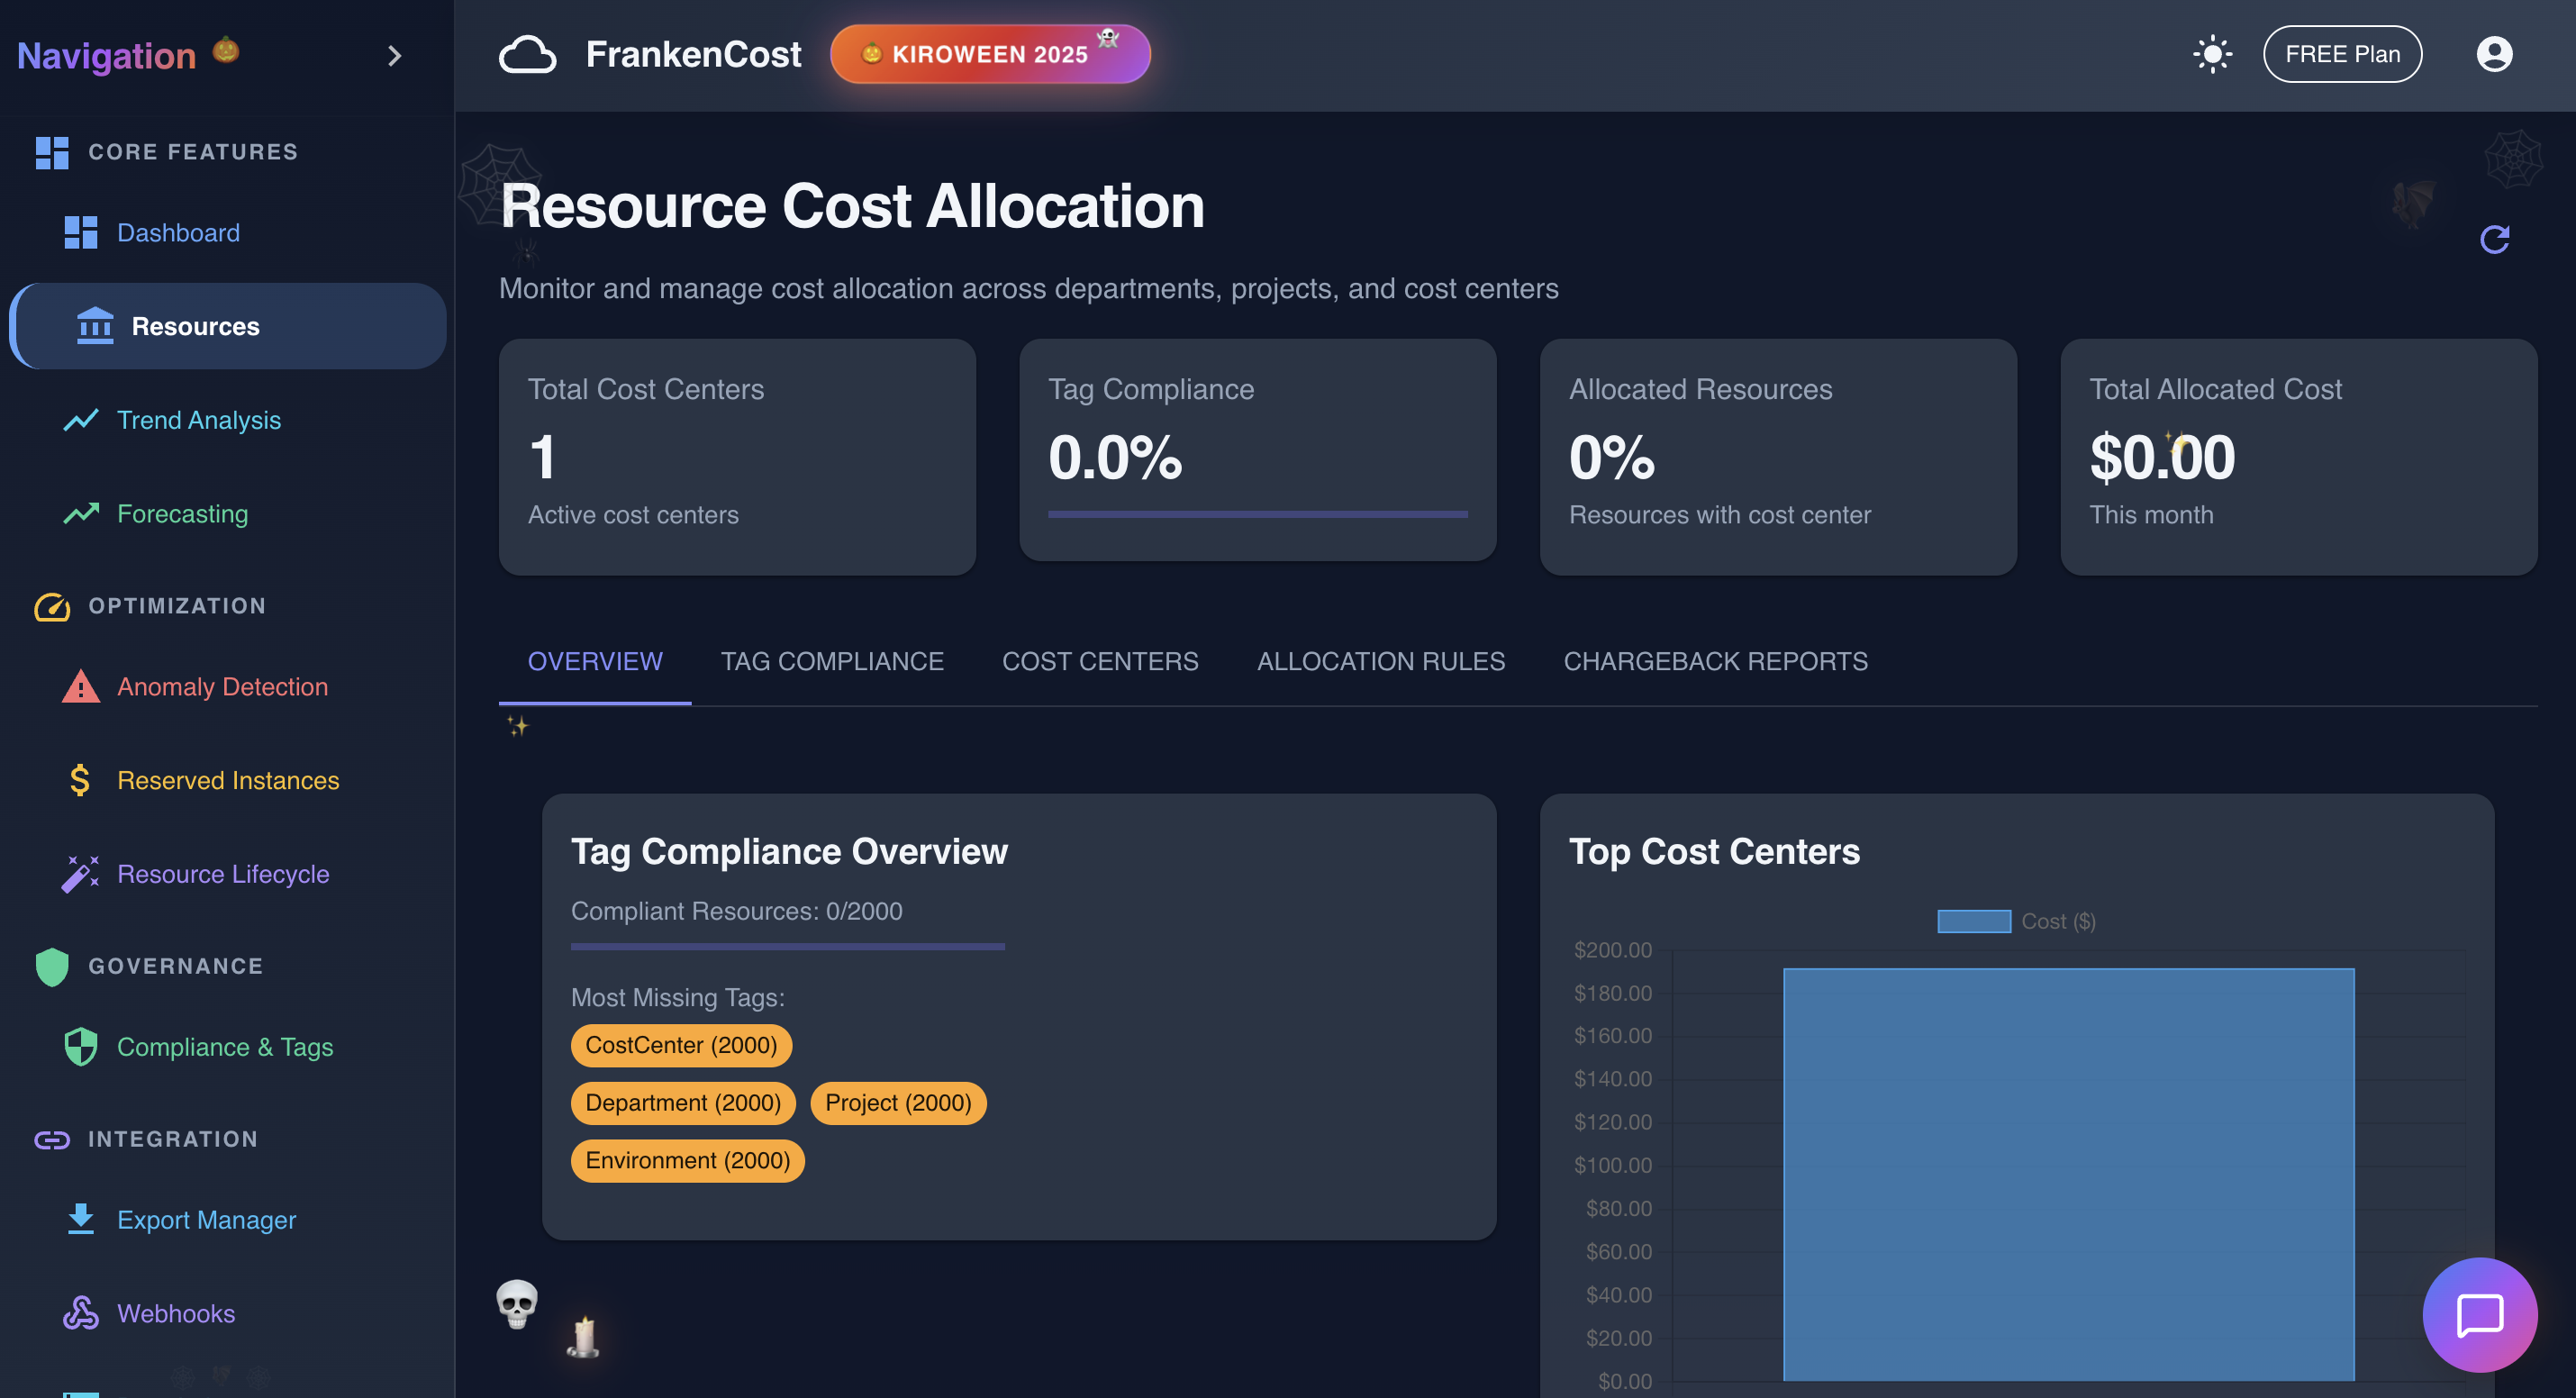
Resource Cost Allocation in action
-
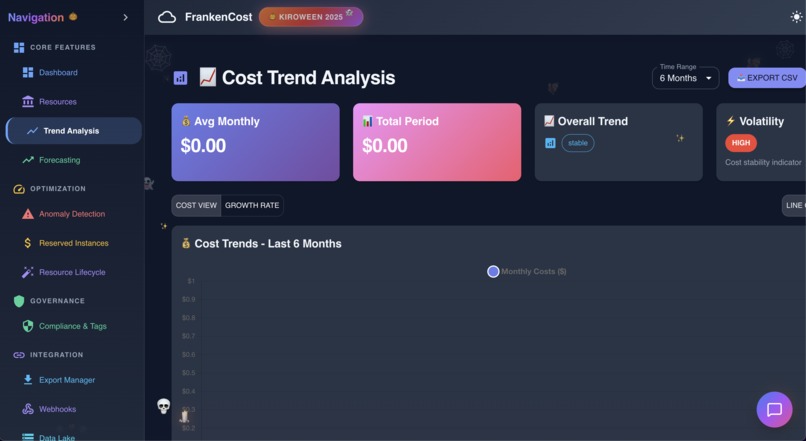
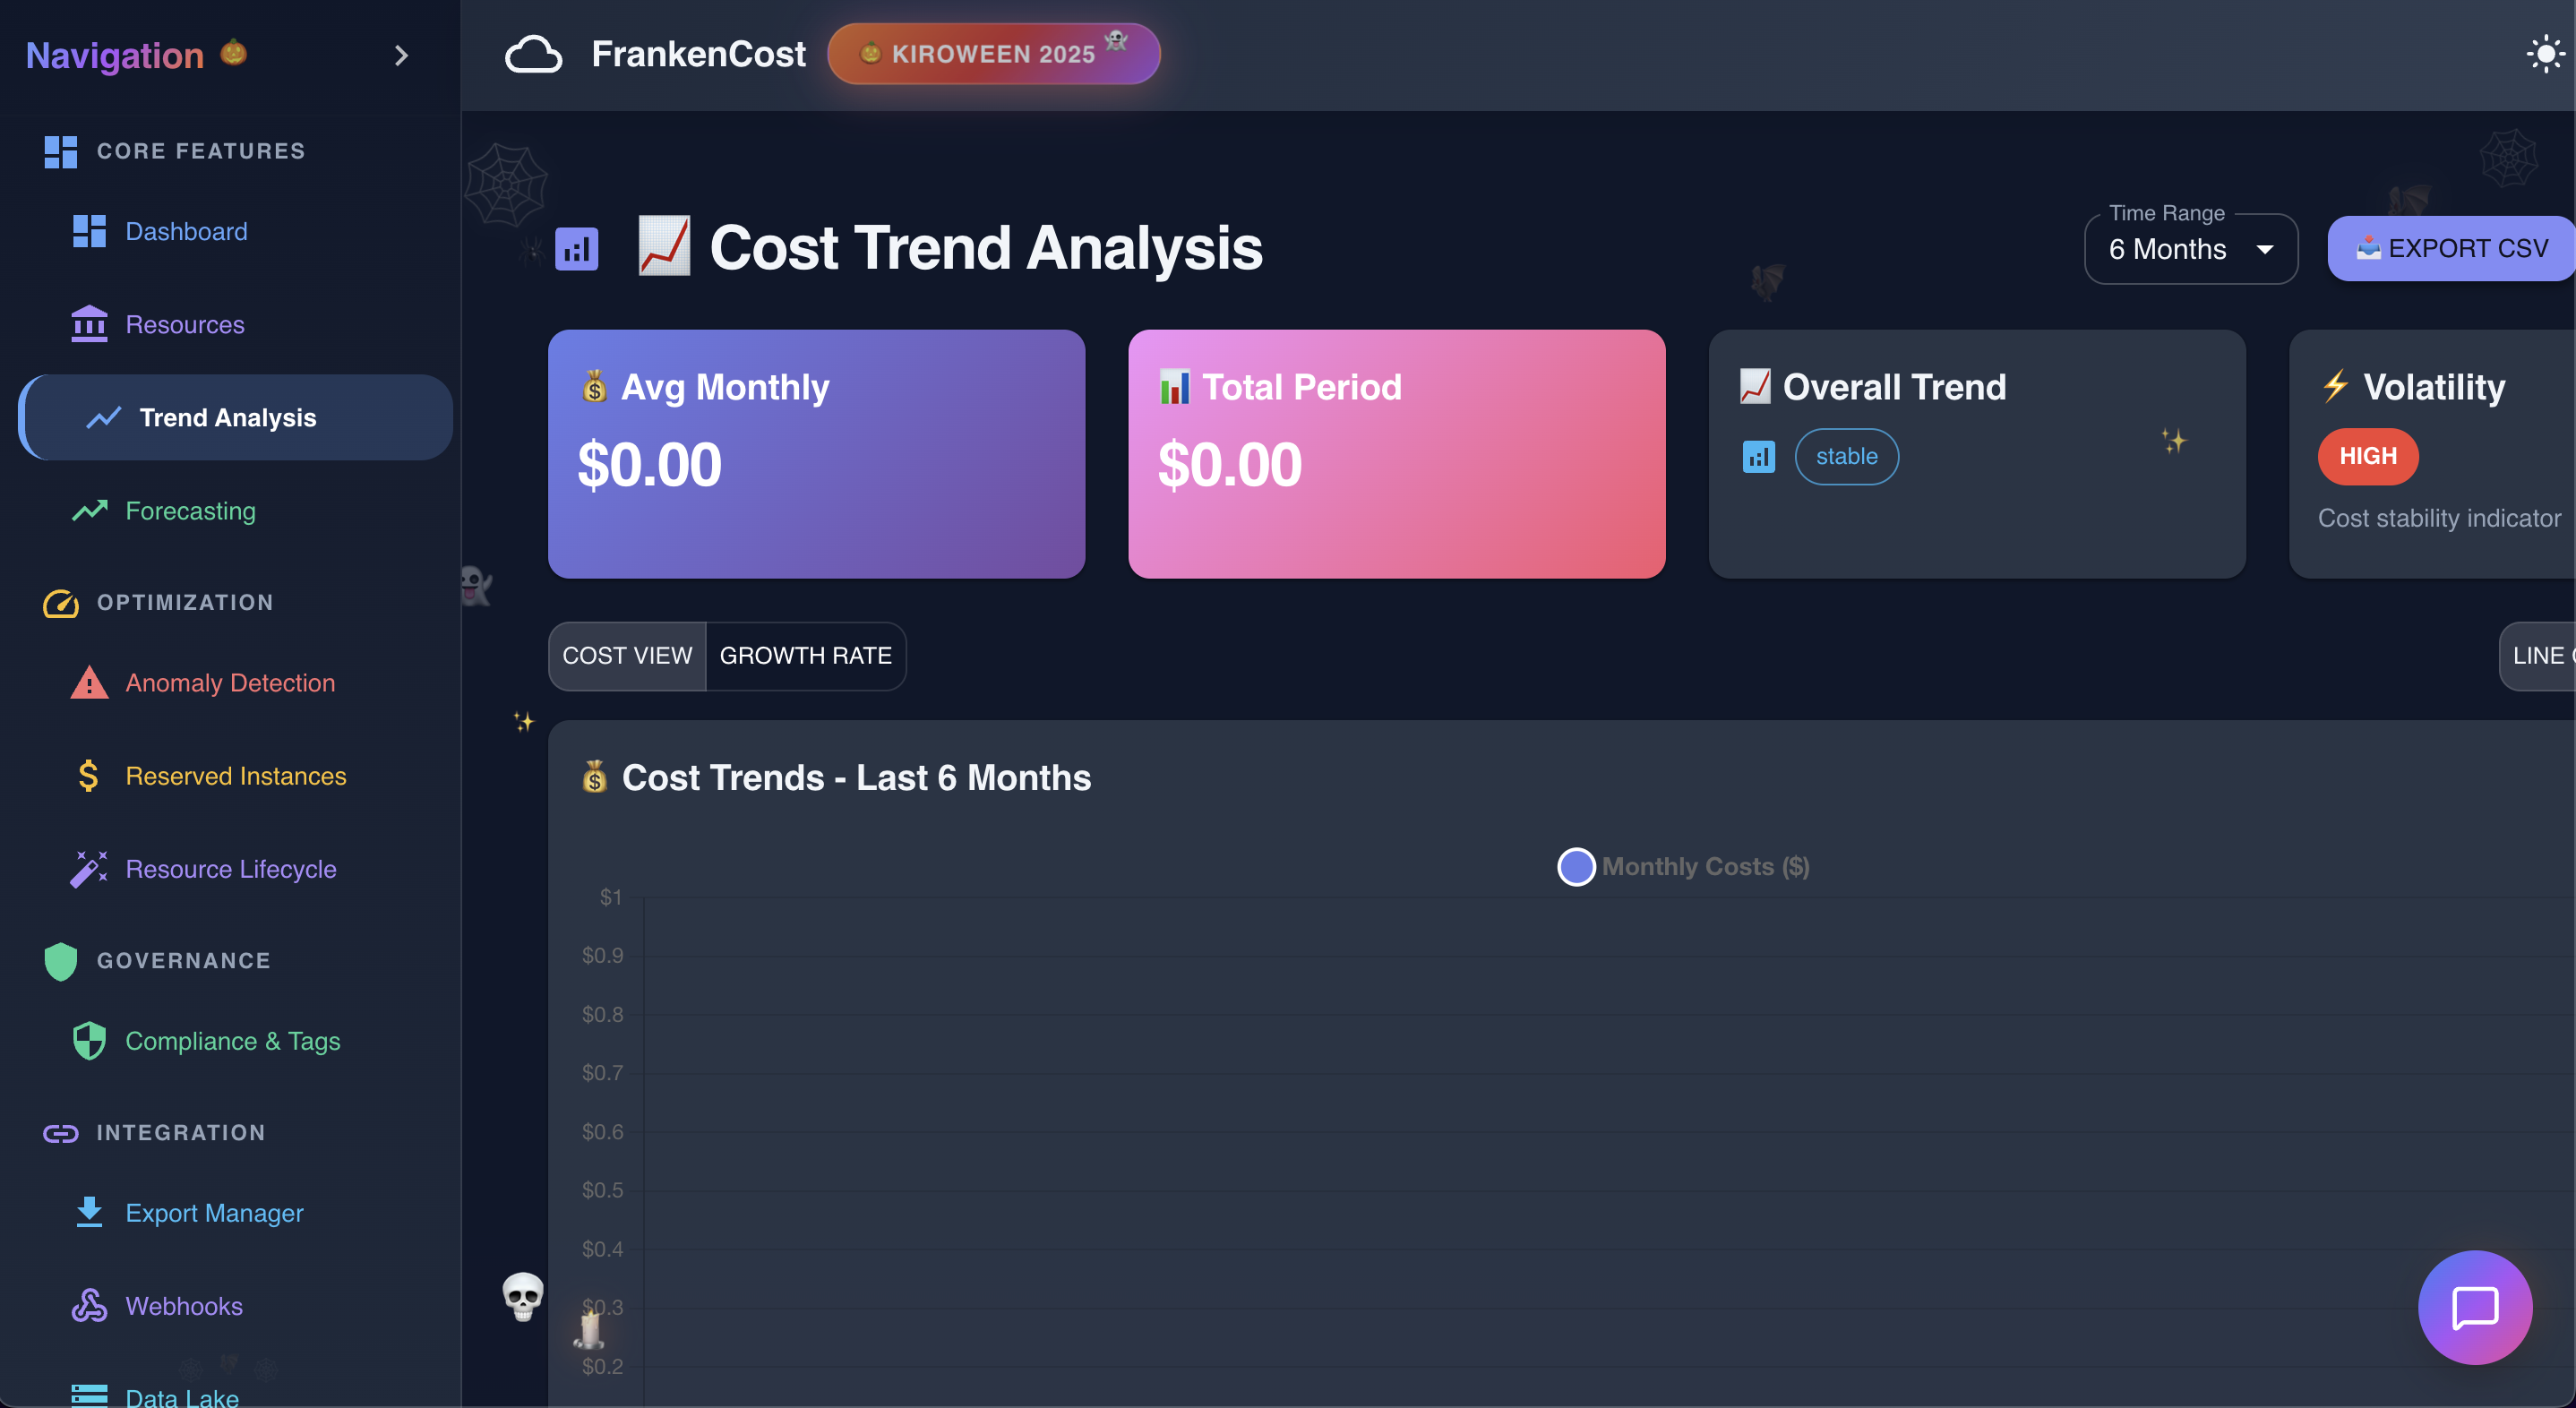
Trend analysis in action
-
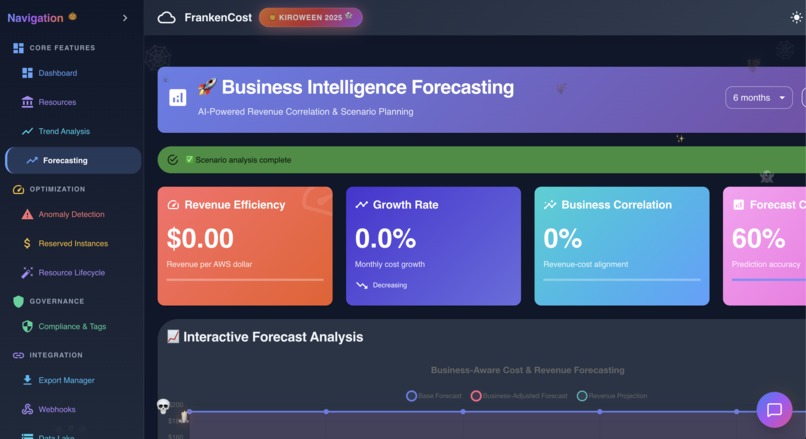
Business Forecasting in Action
-
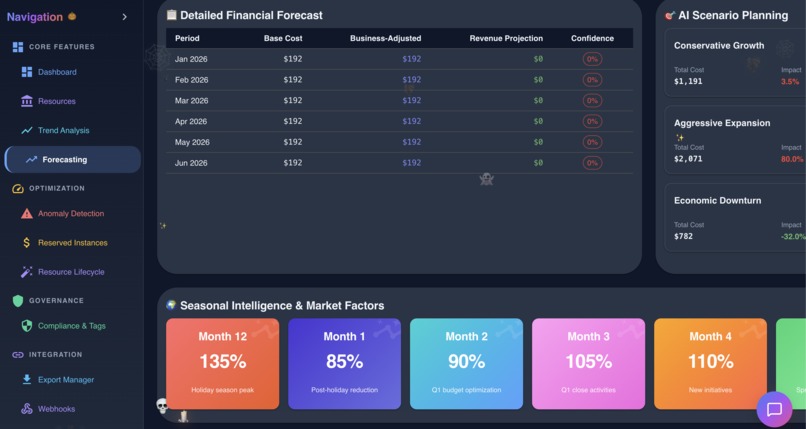
Business Forecasting in Action
-
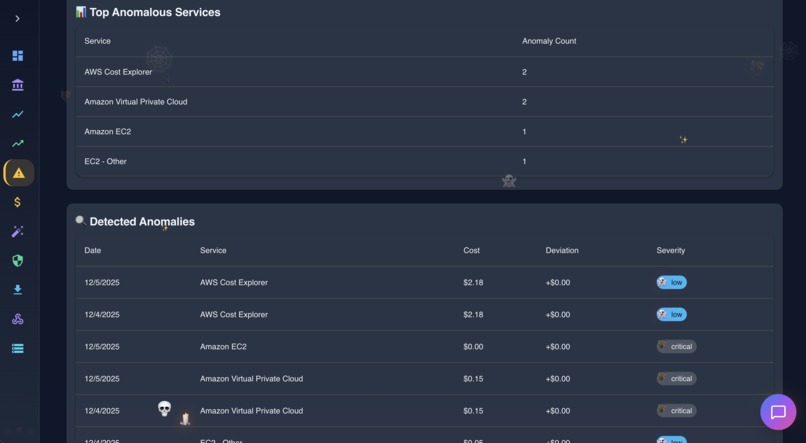
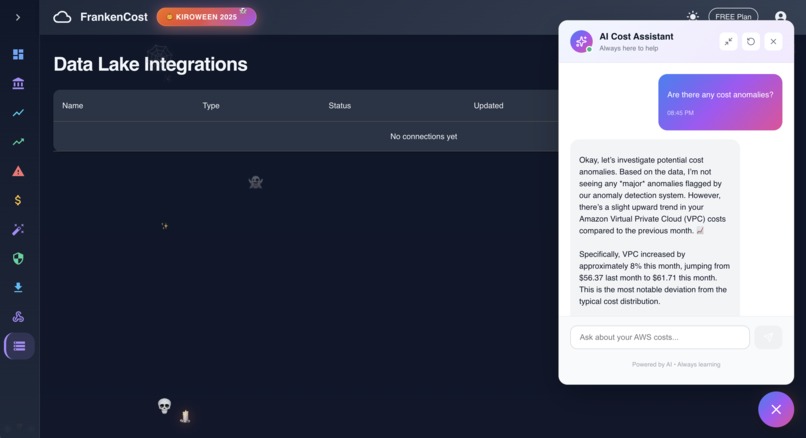
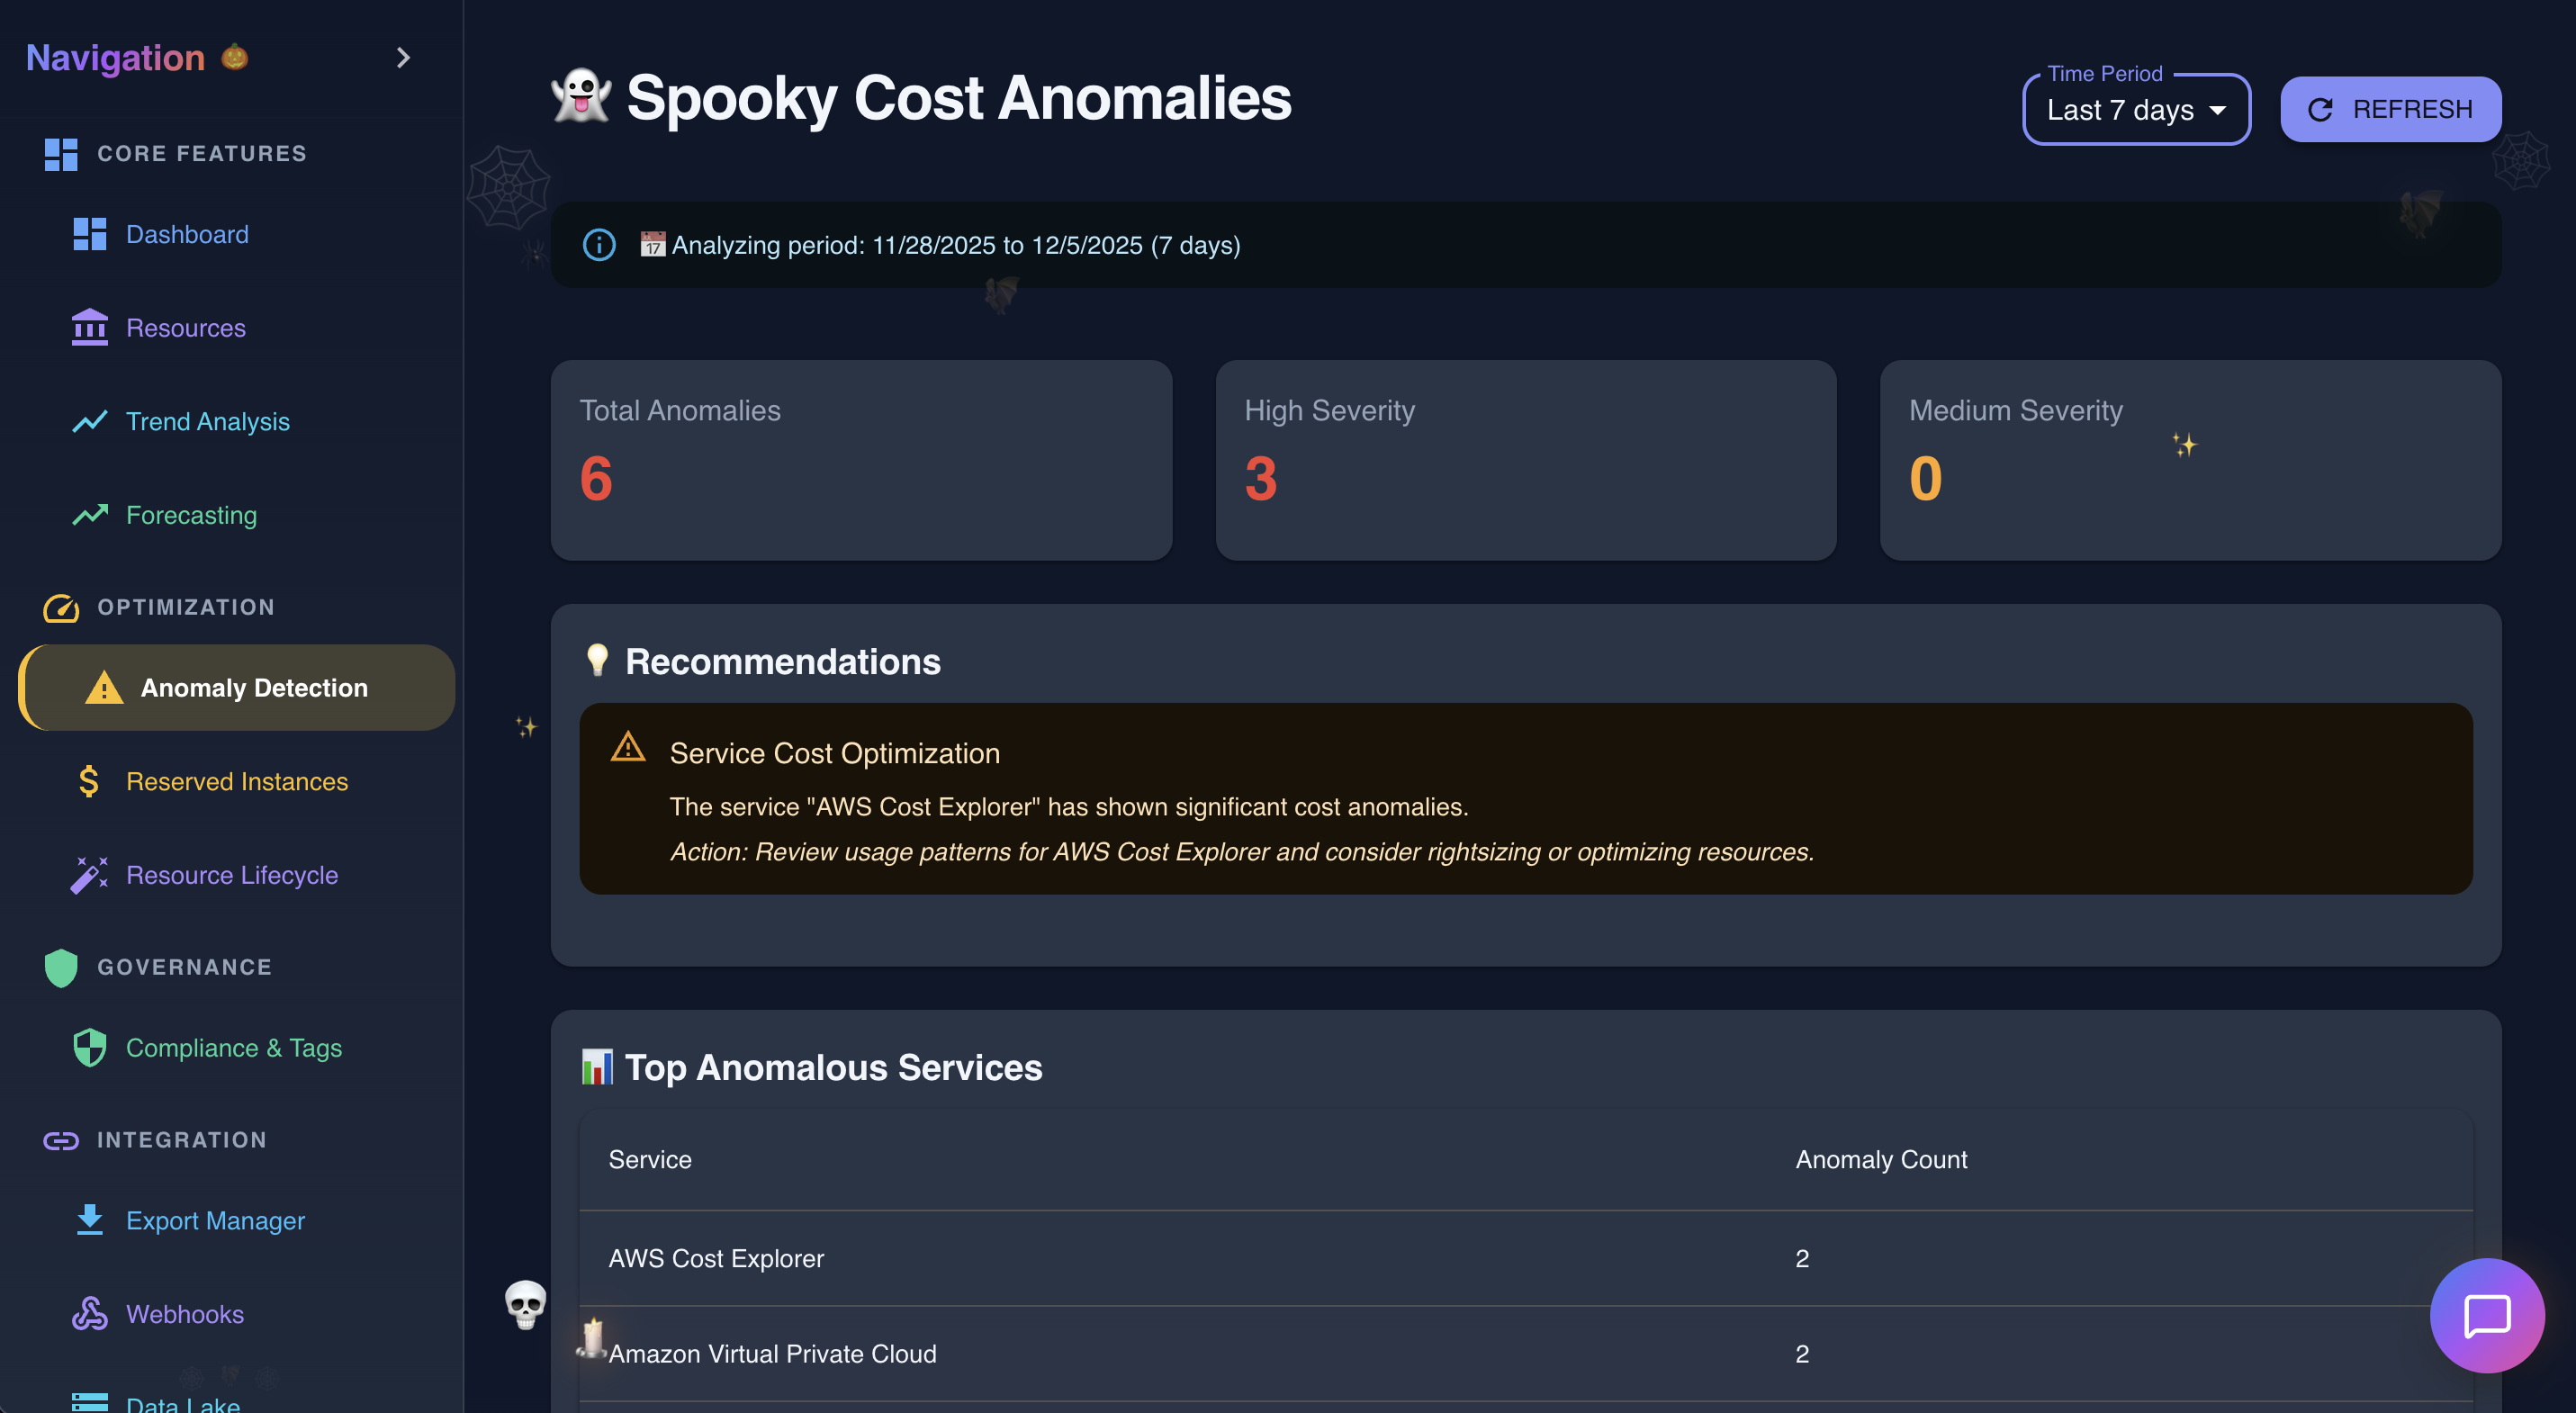
Anomoly Detection in action
-
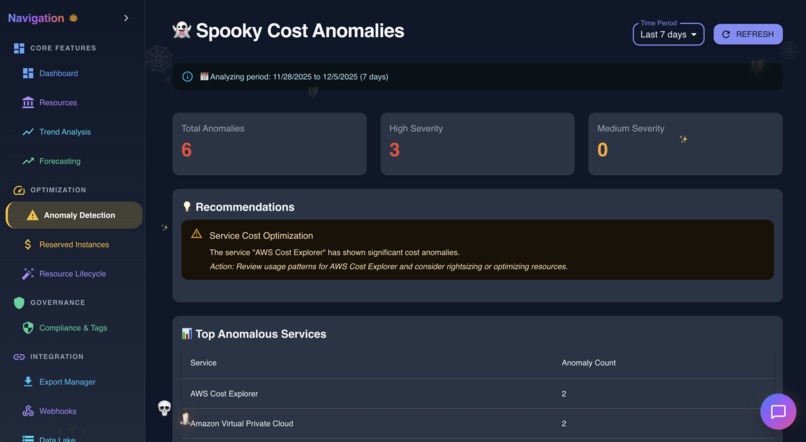
Anomoly Detection in action
-
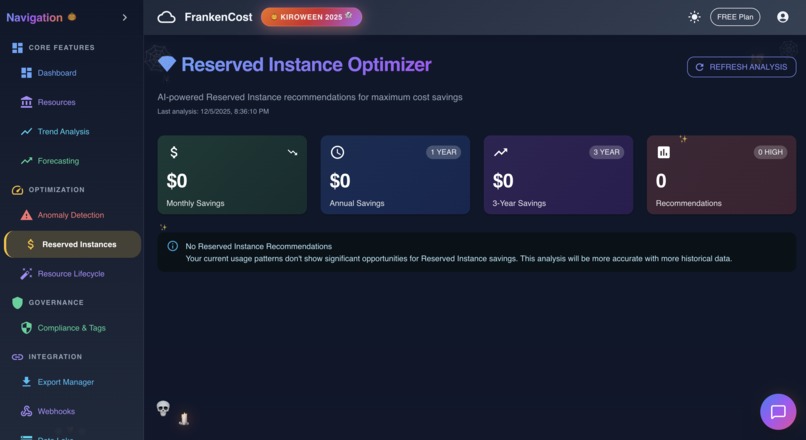
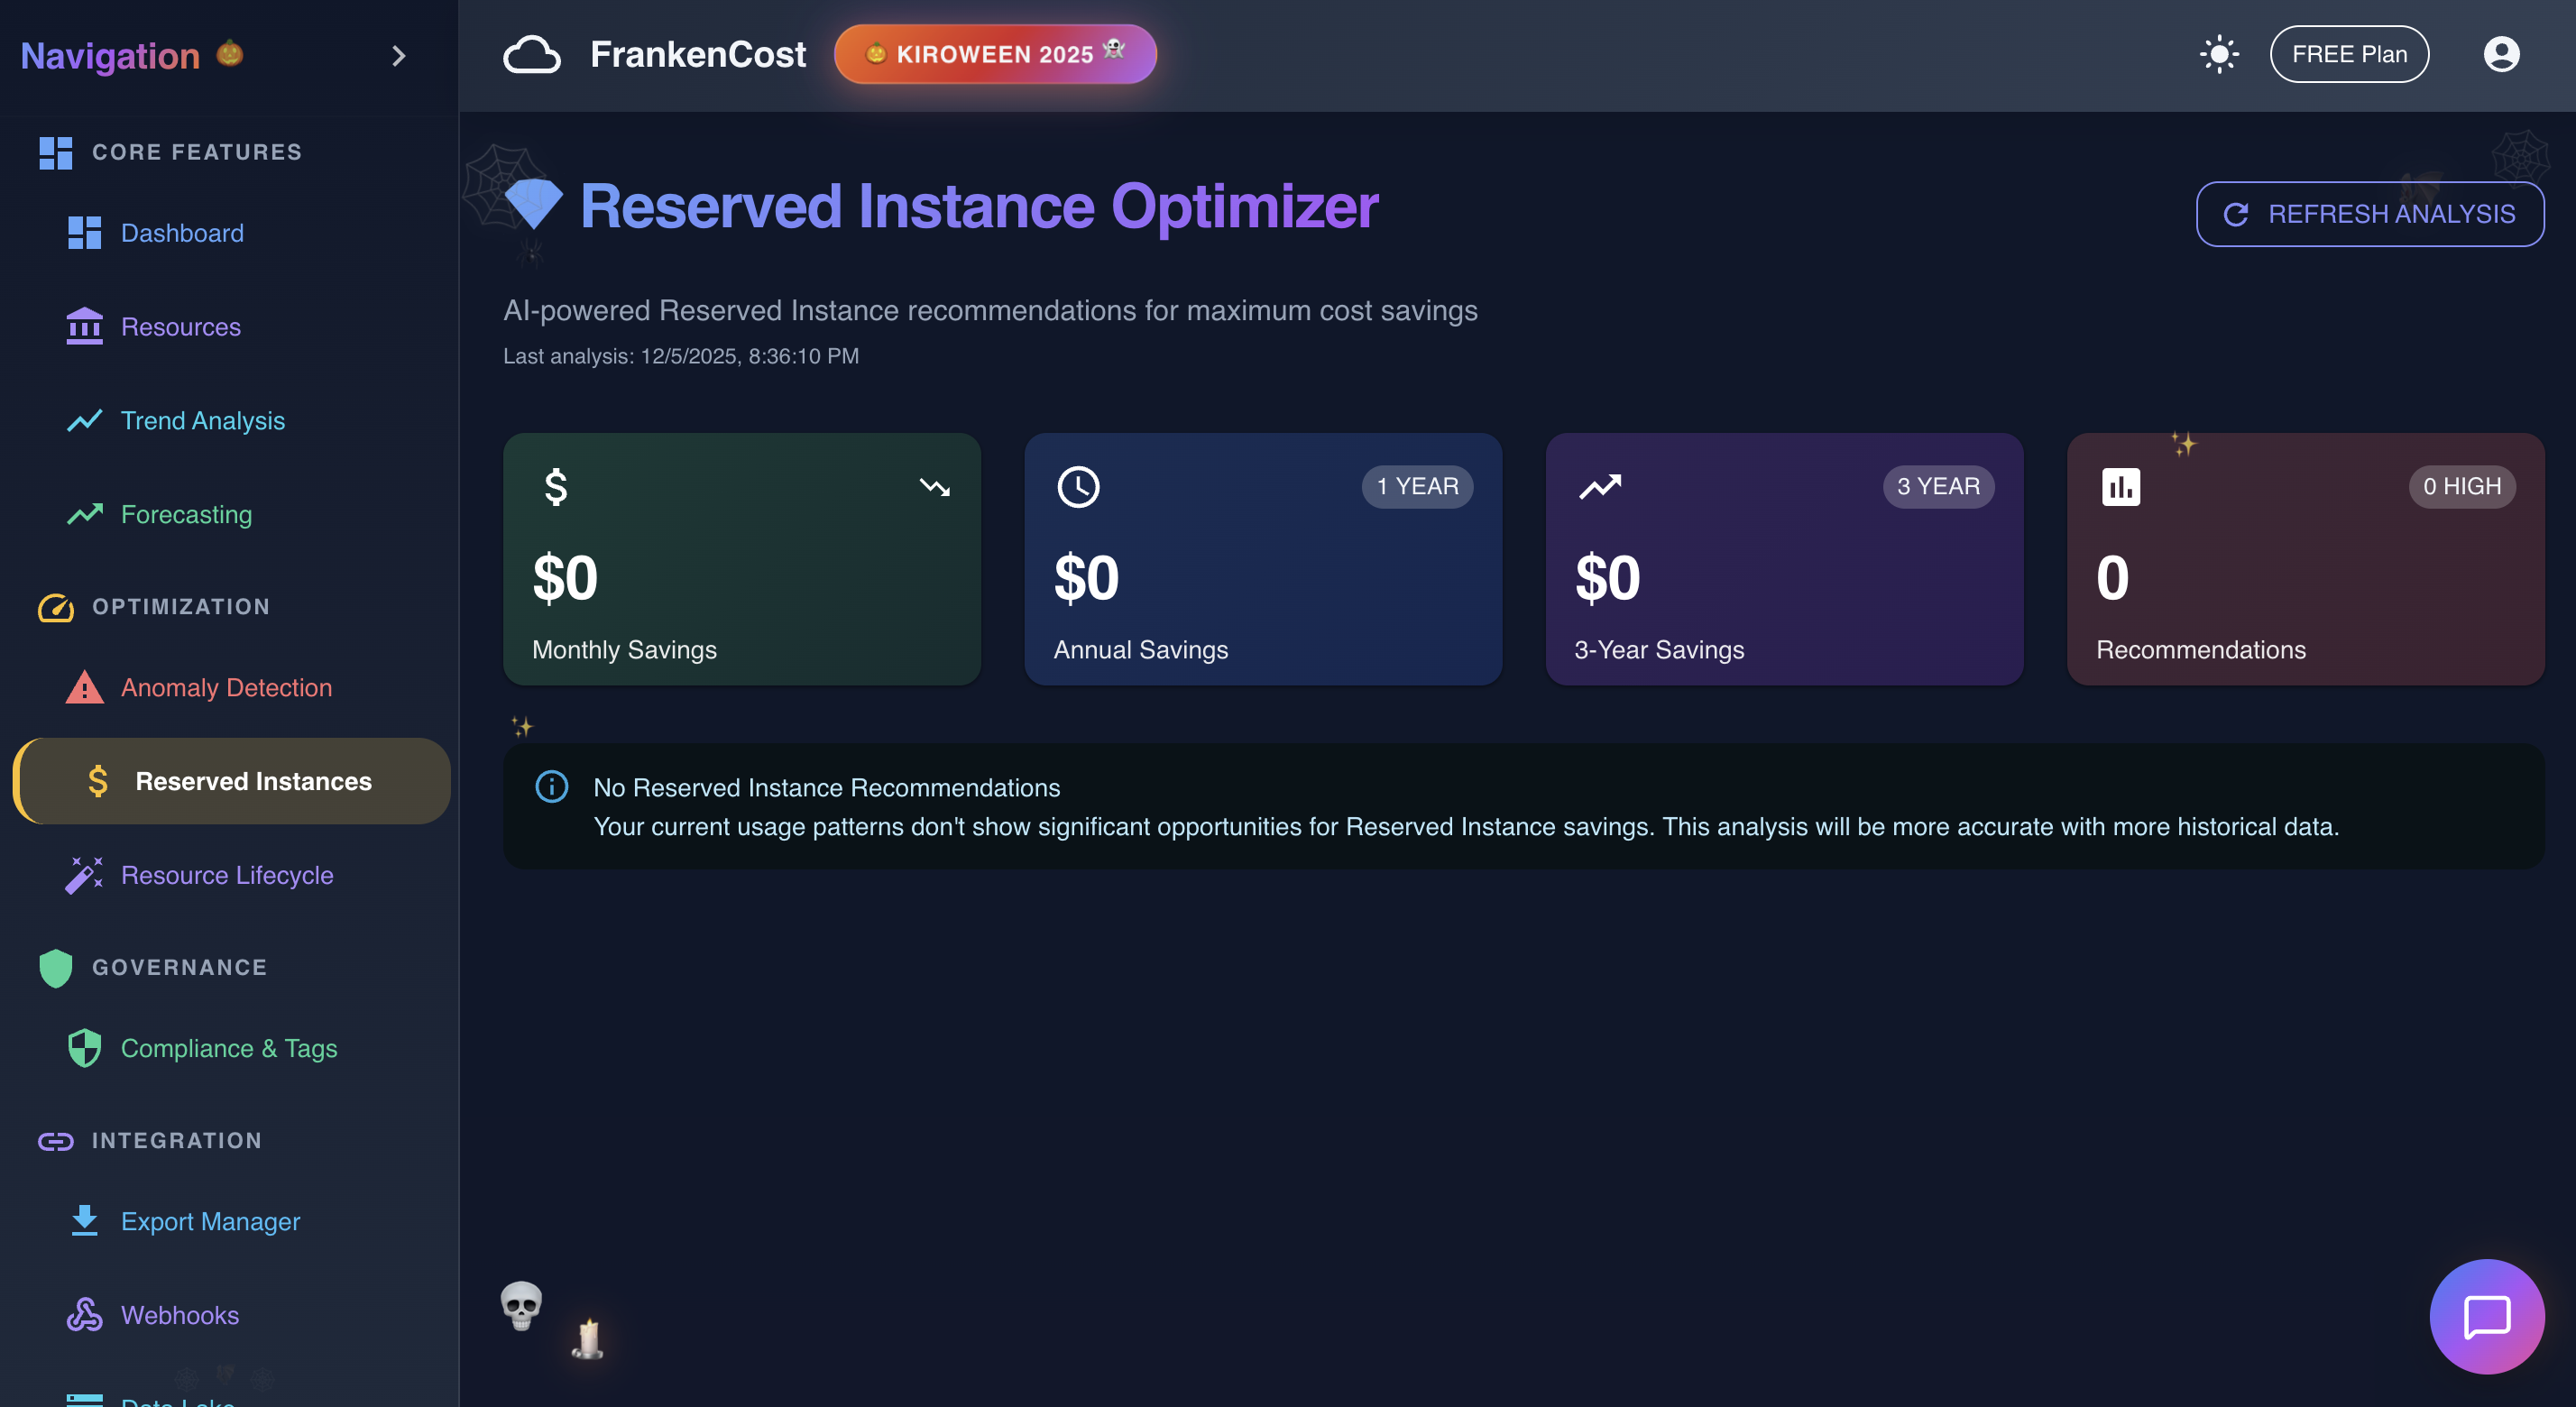
Reserved Instance Analysis in action
-
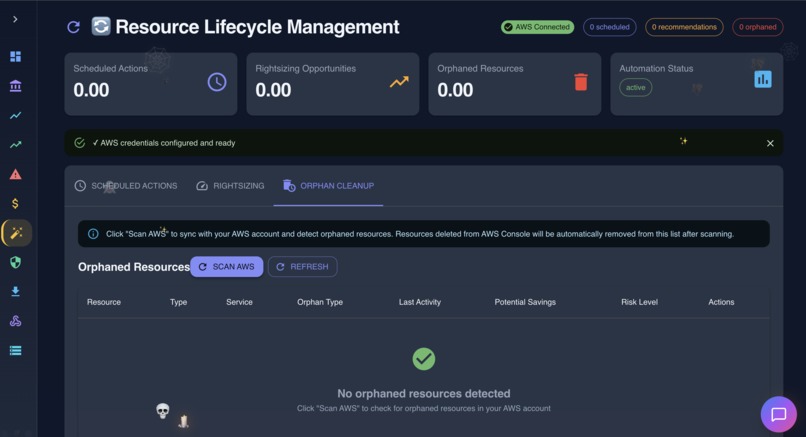
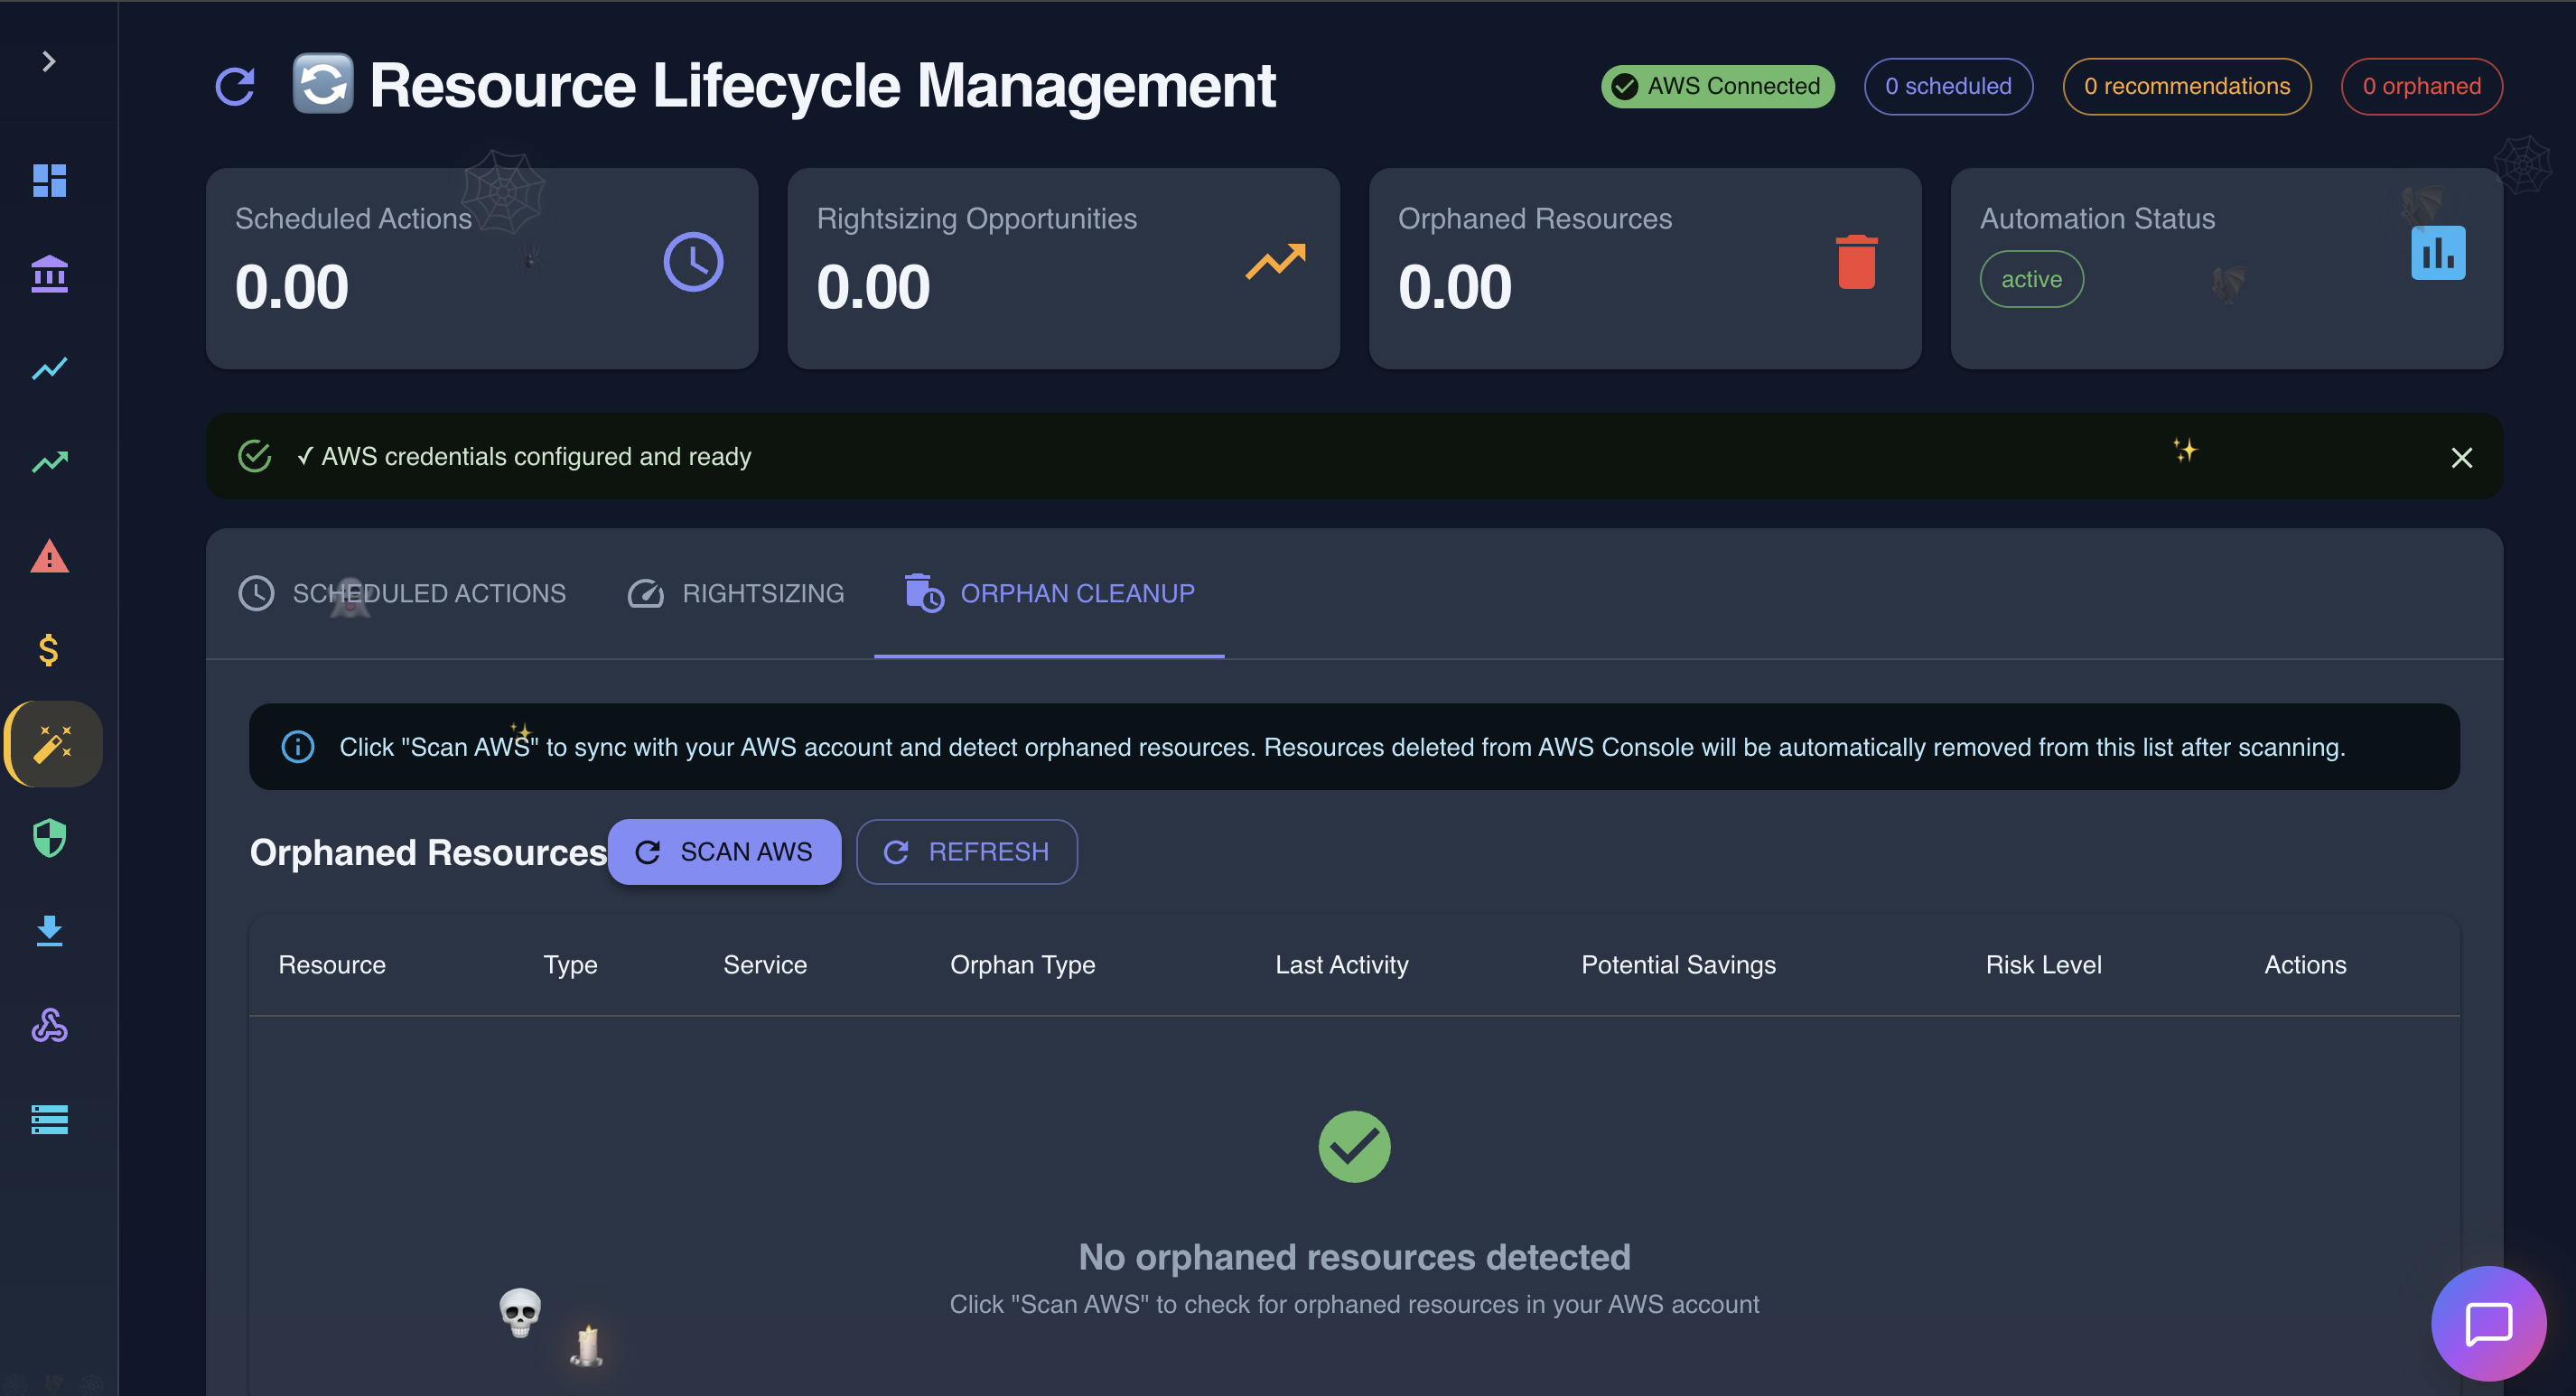
Resource Lifecycle Management in action
-
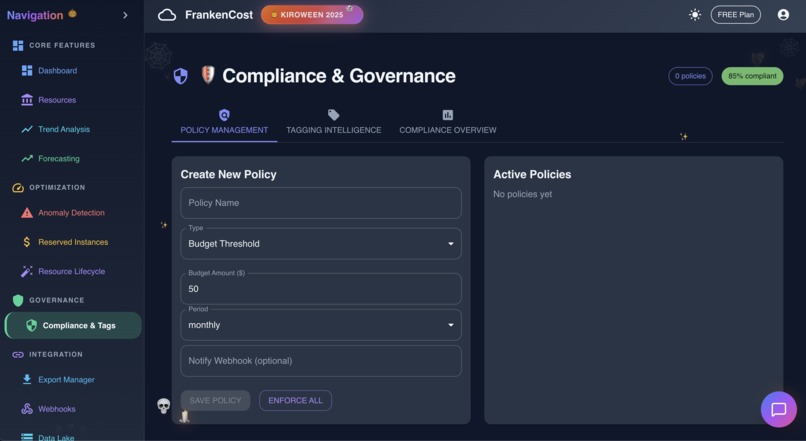
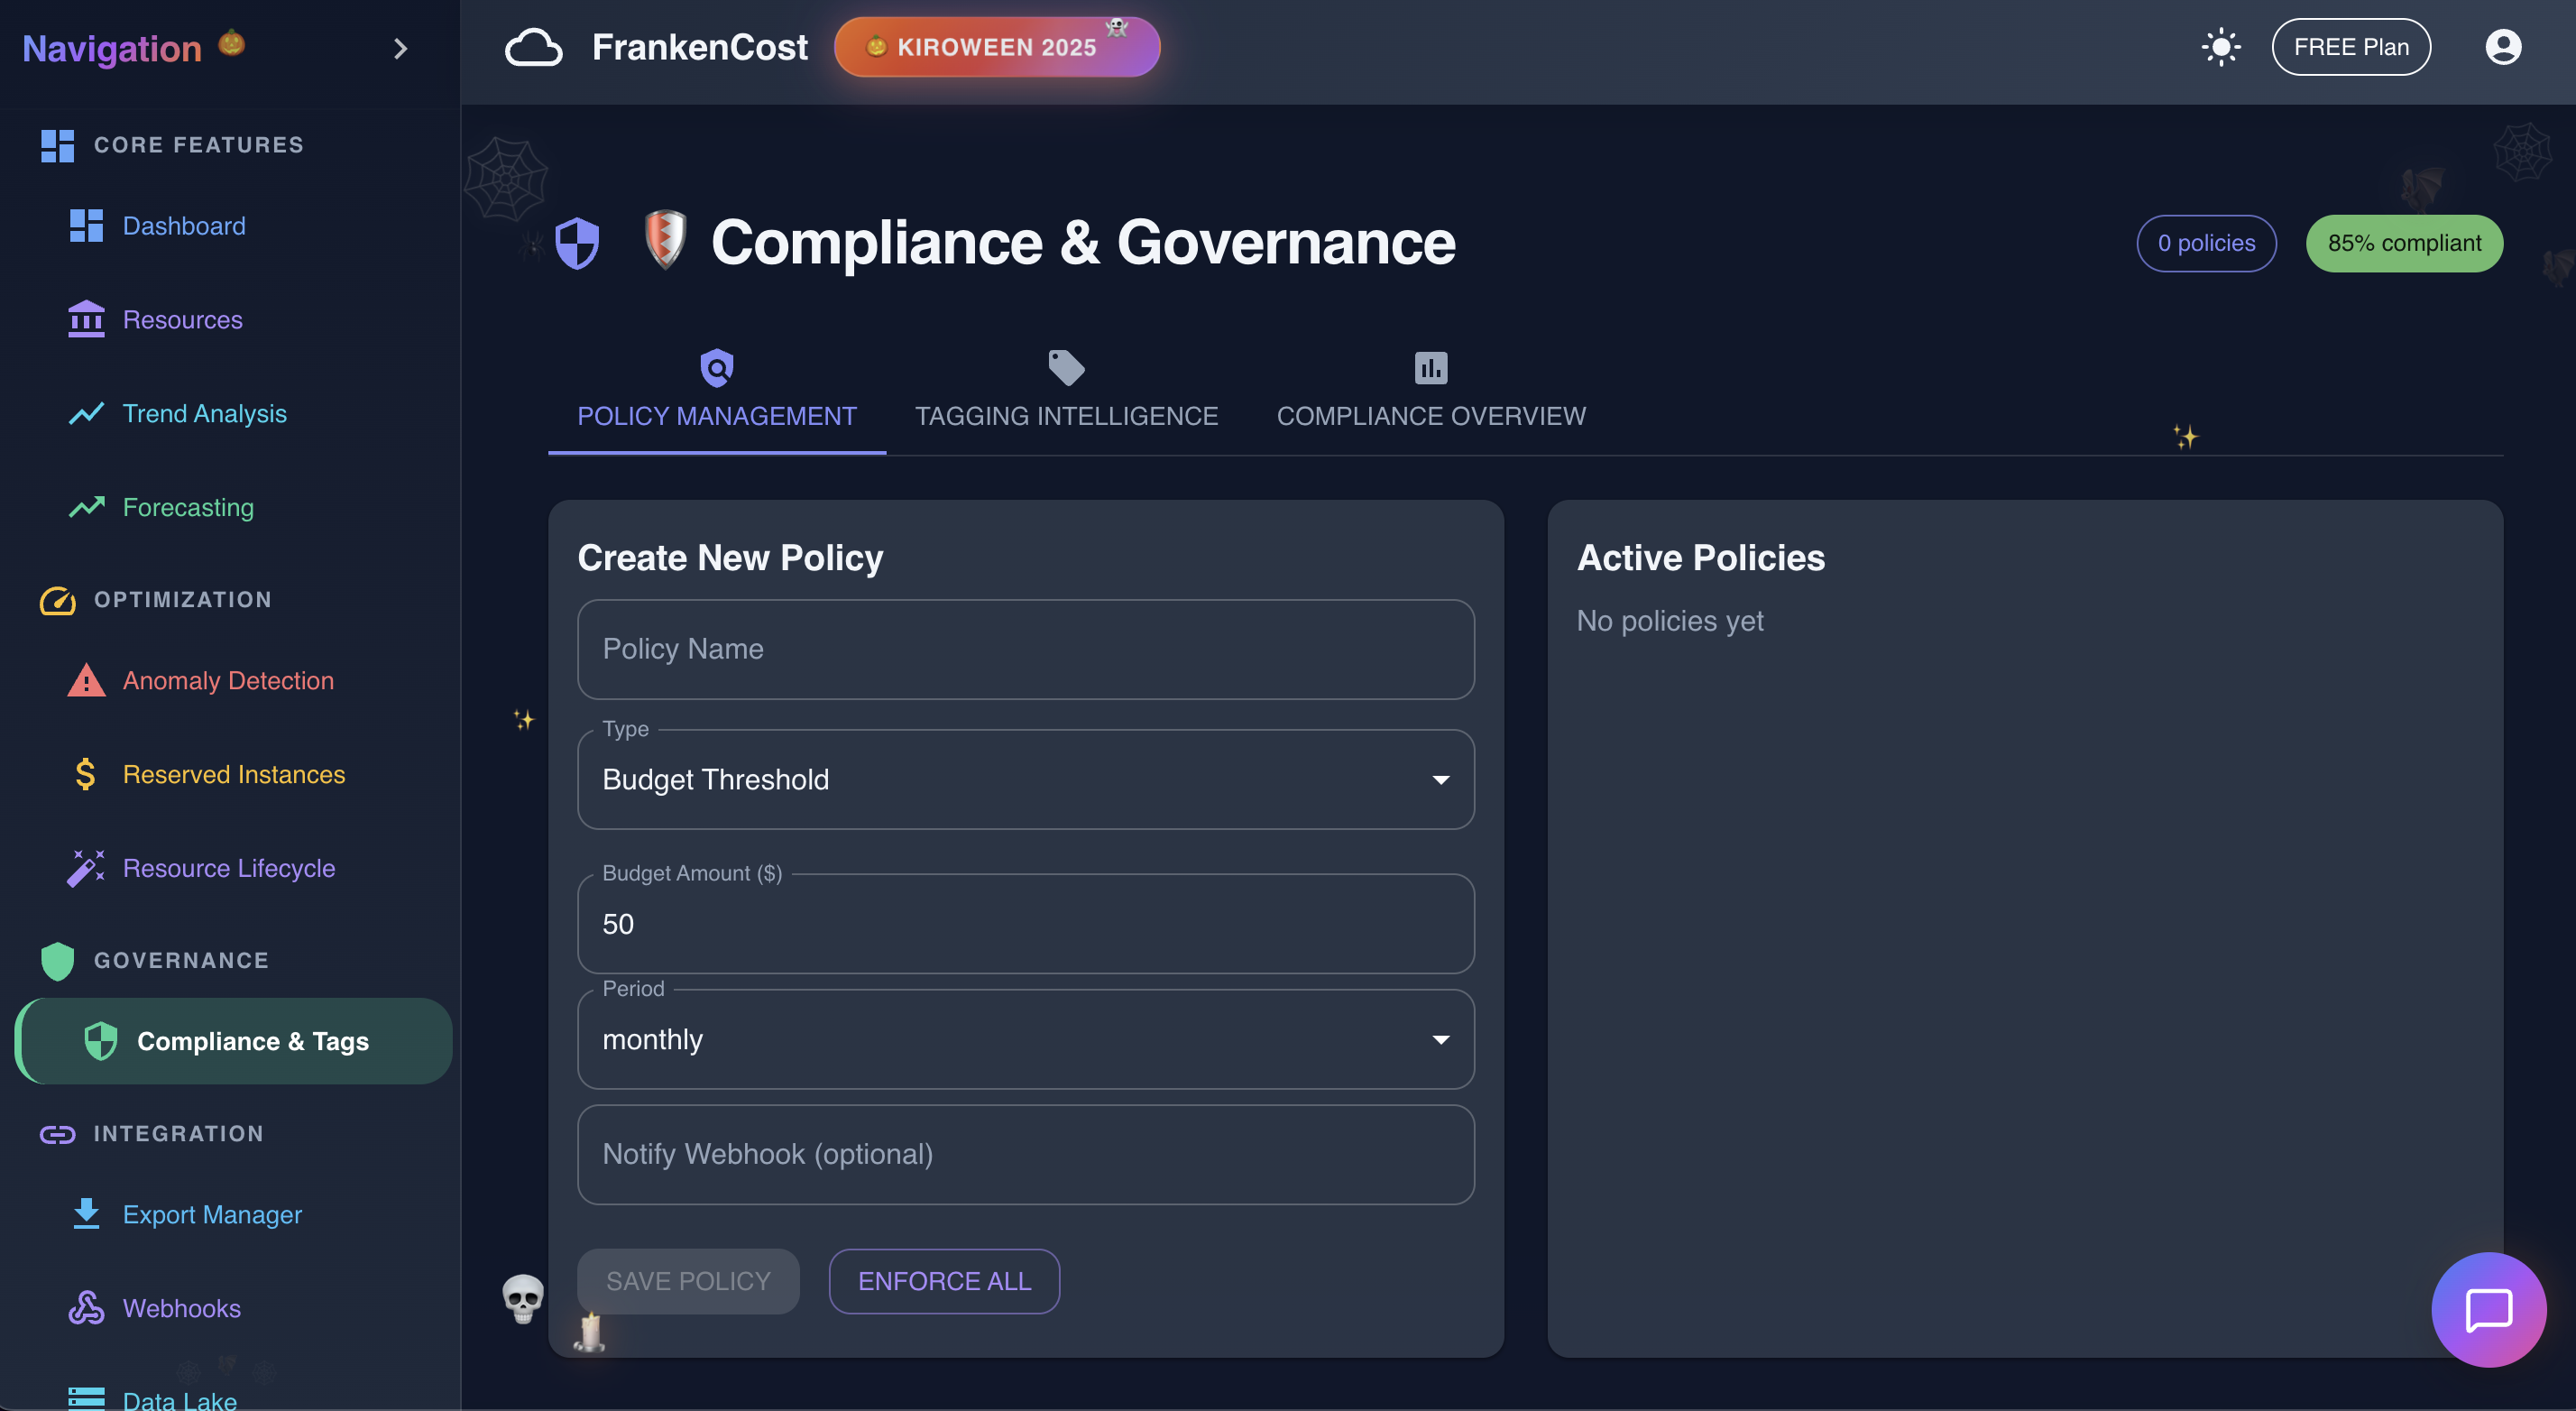
Compliance and Governance in action
-

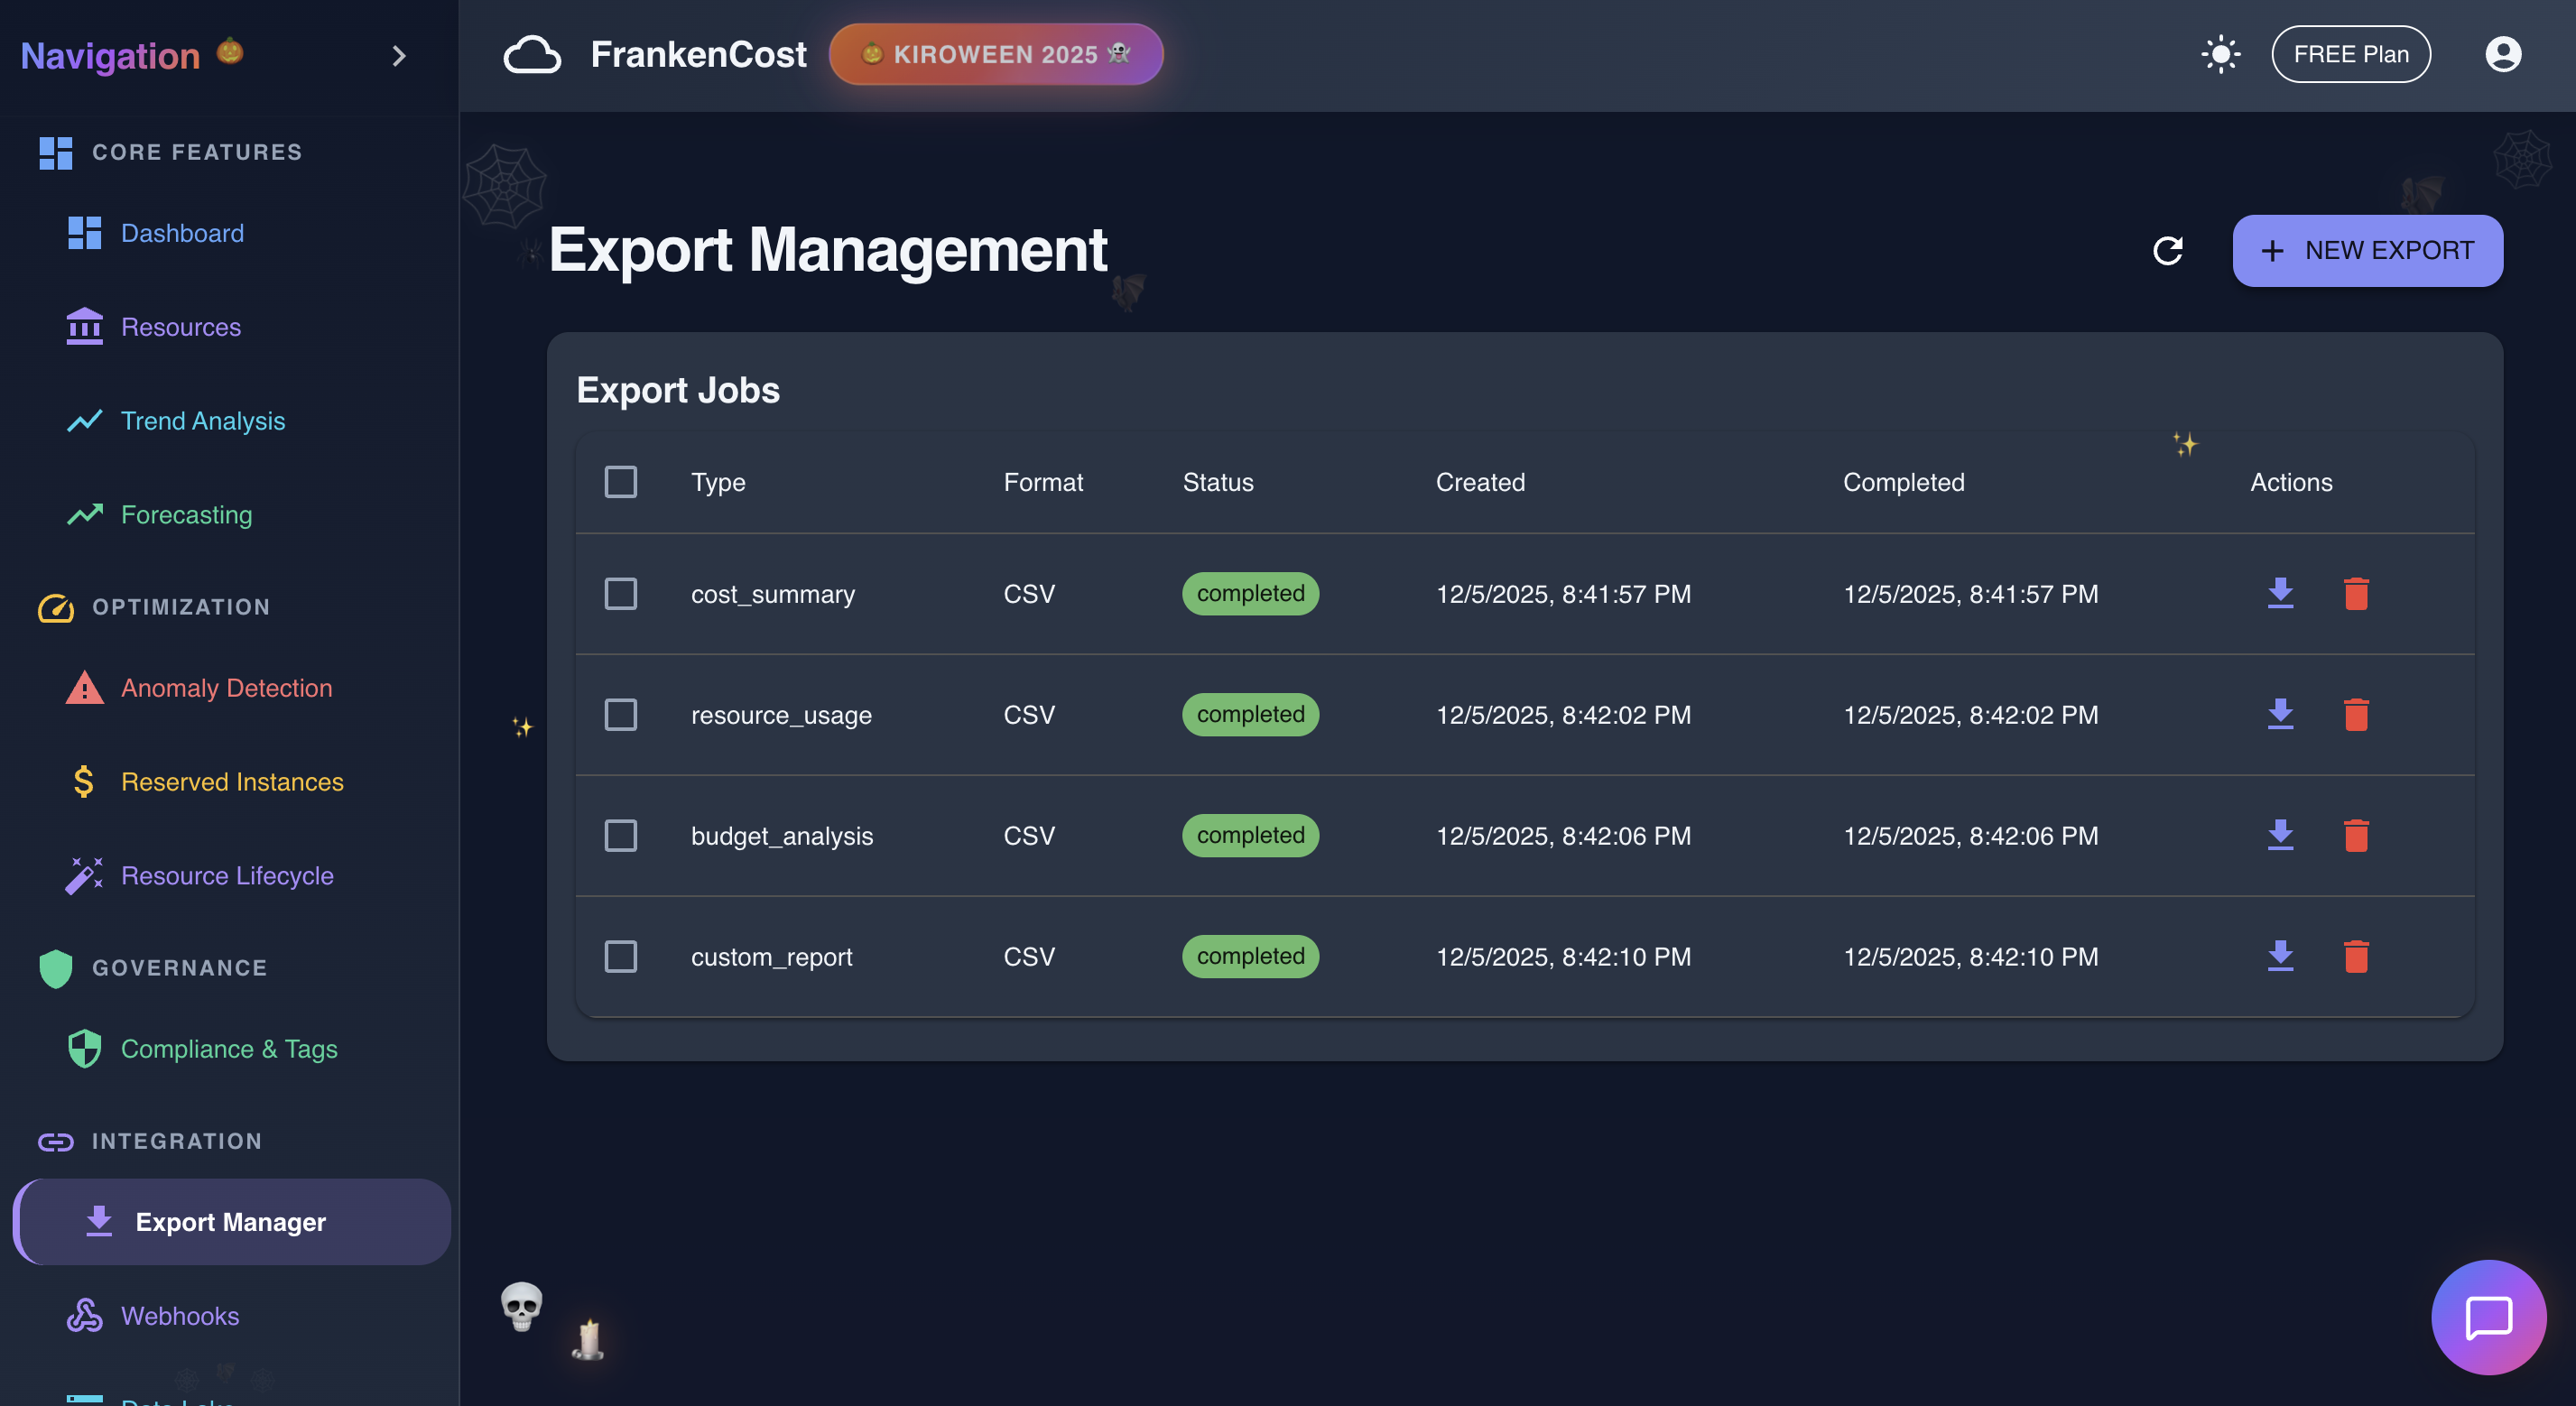
Export management in action
-
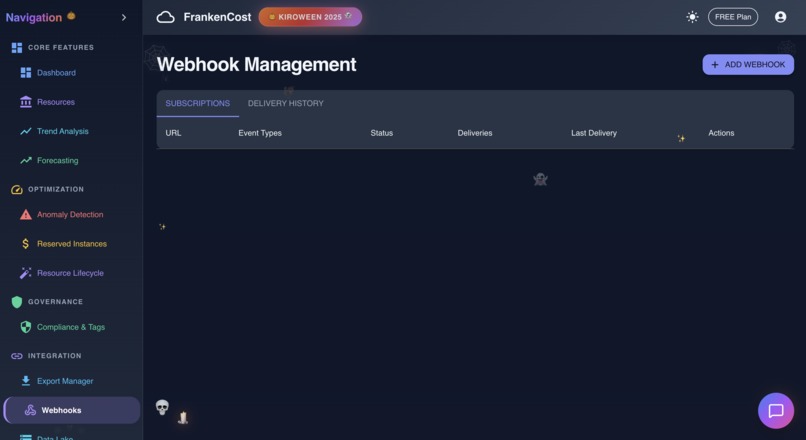
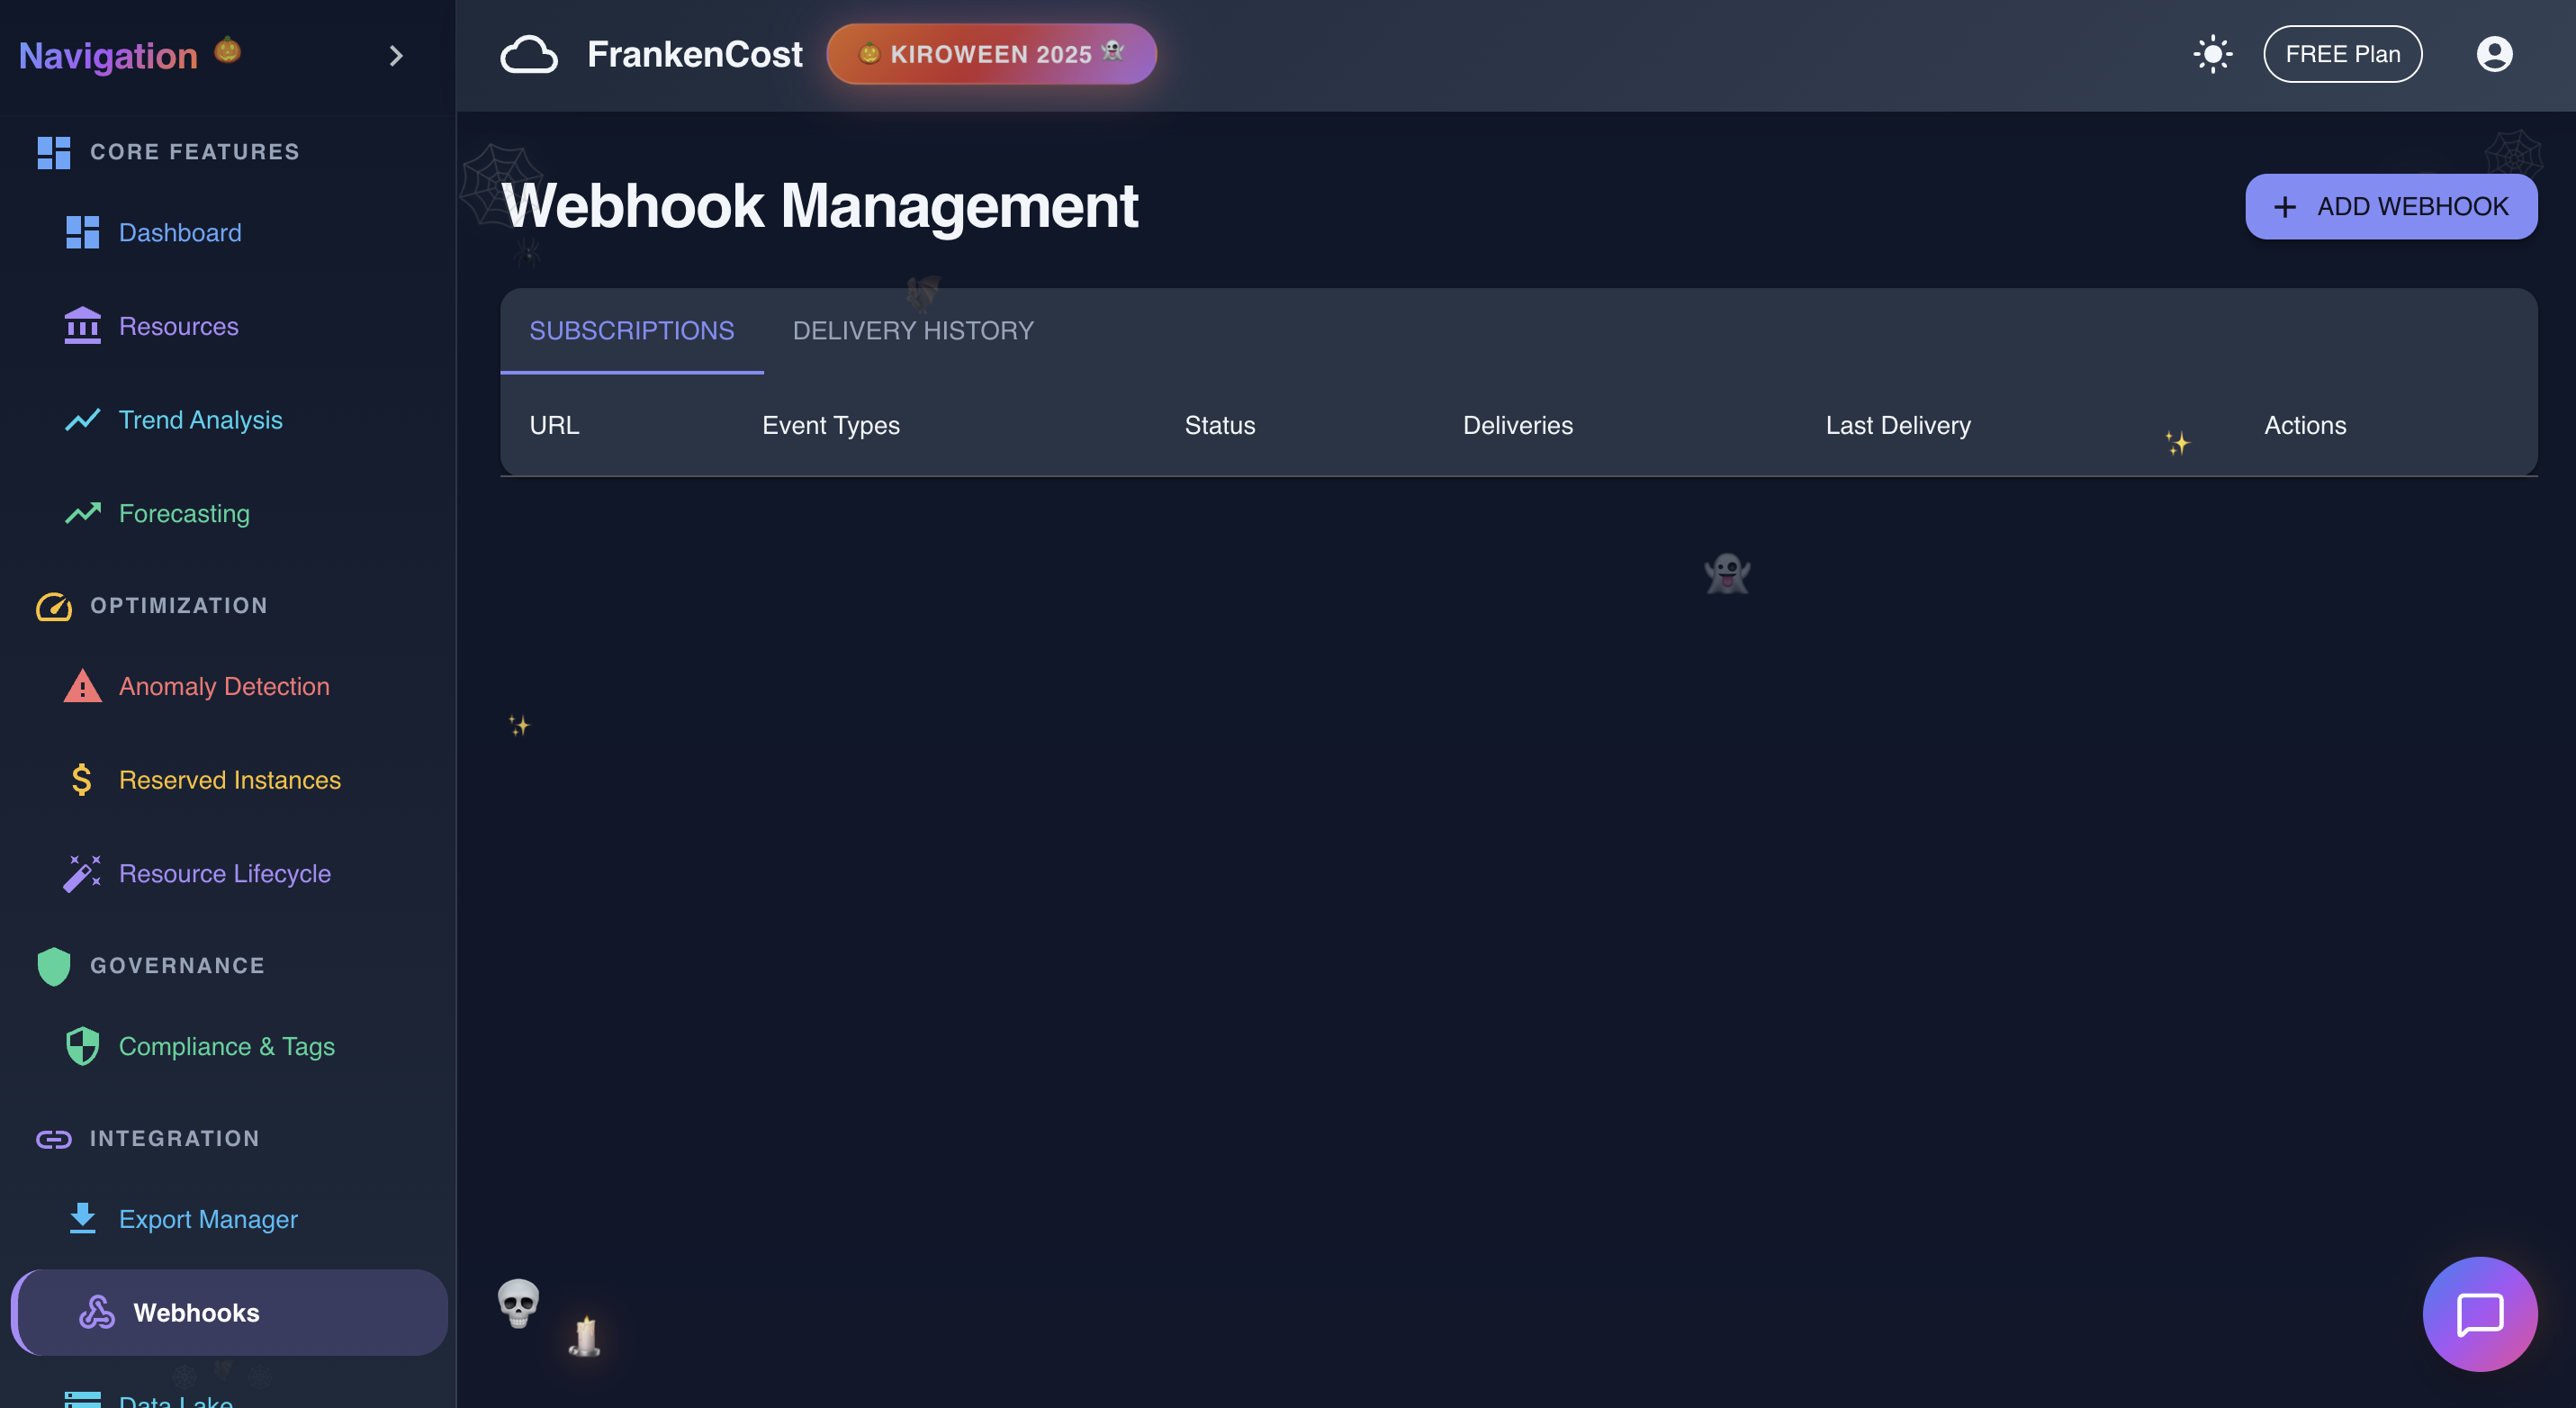
Webhook in action
-
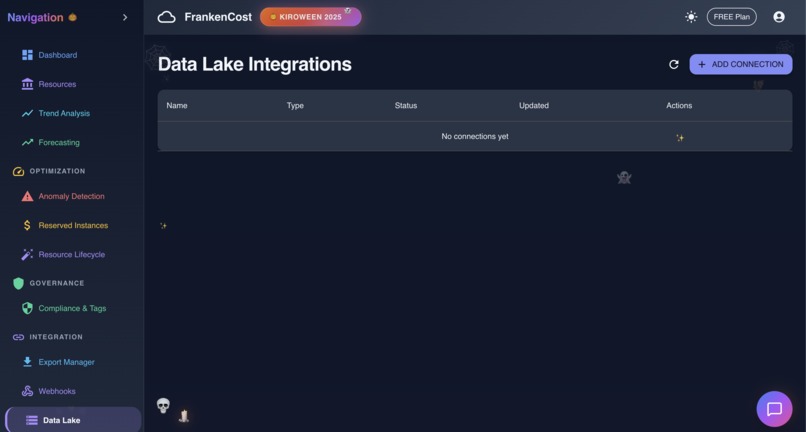
Datalake in Action
-
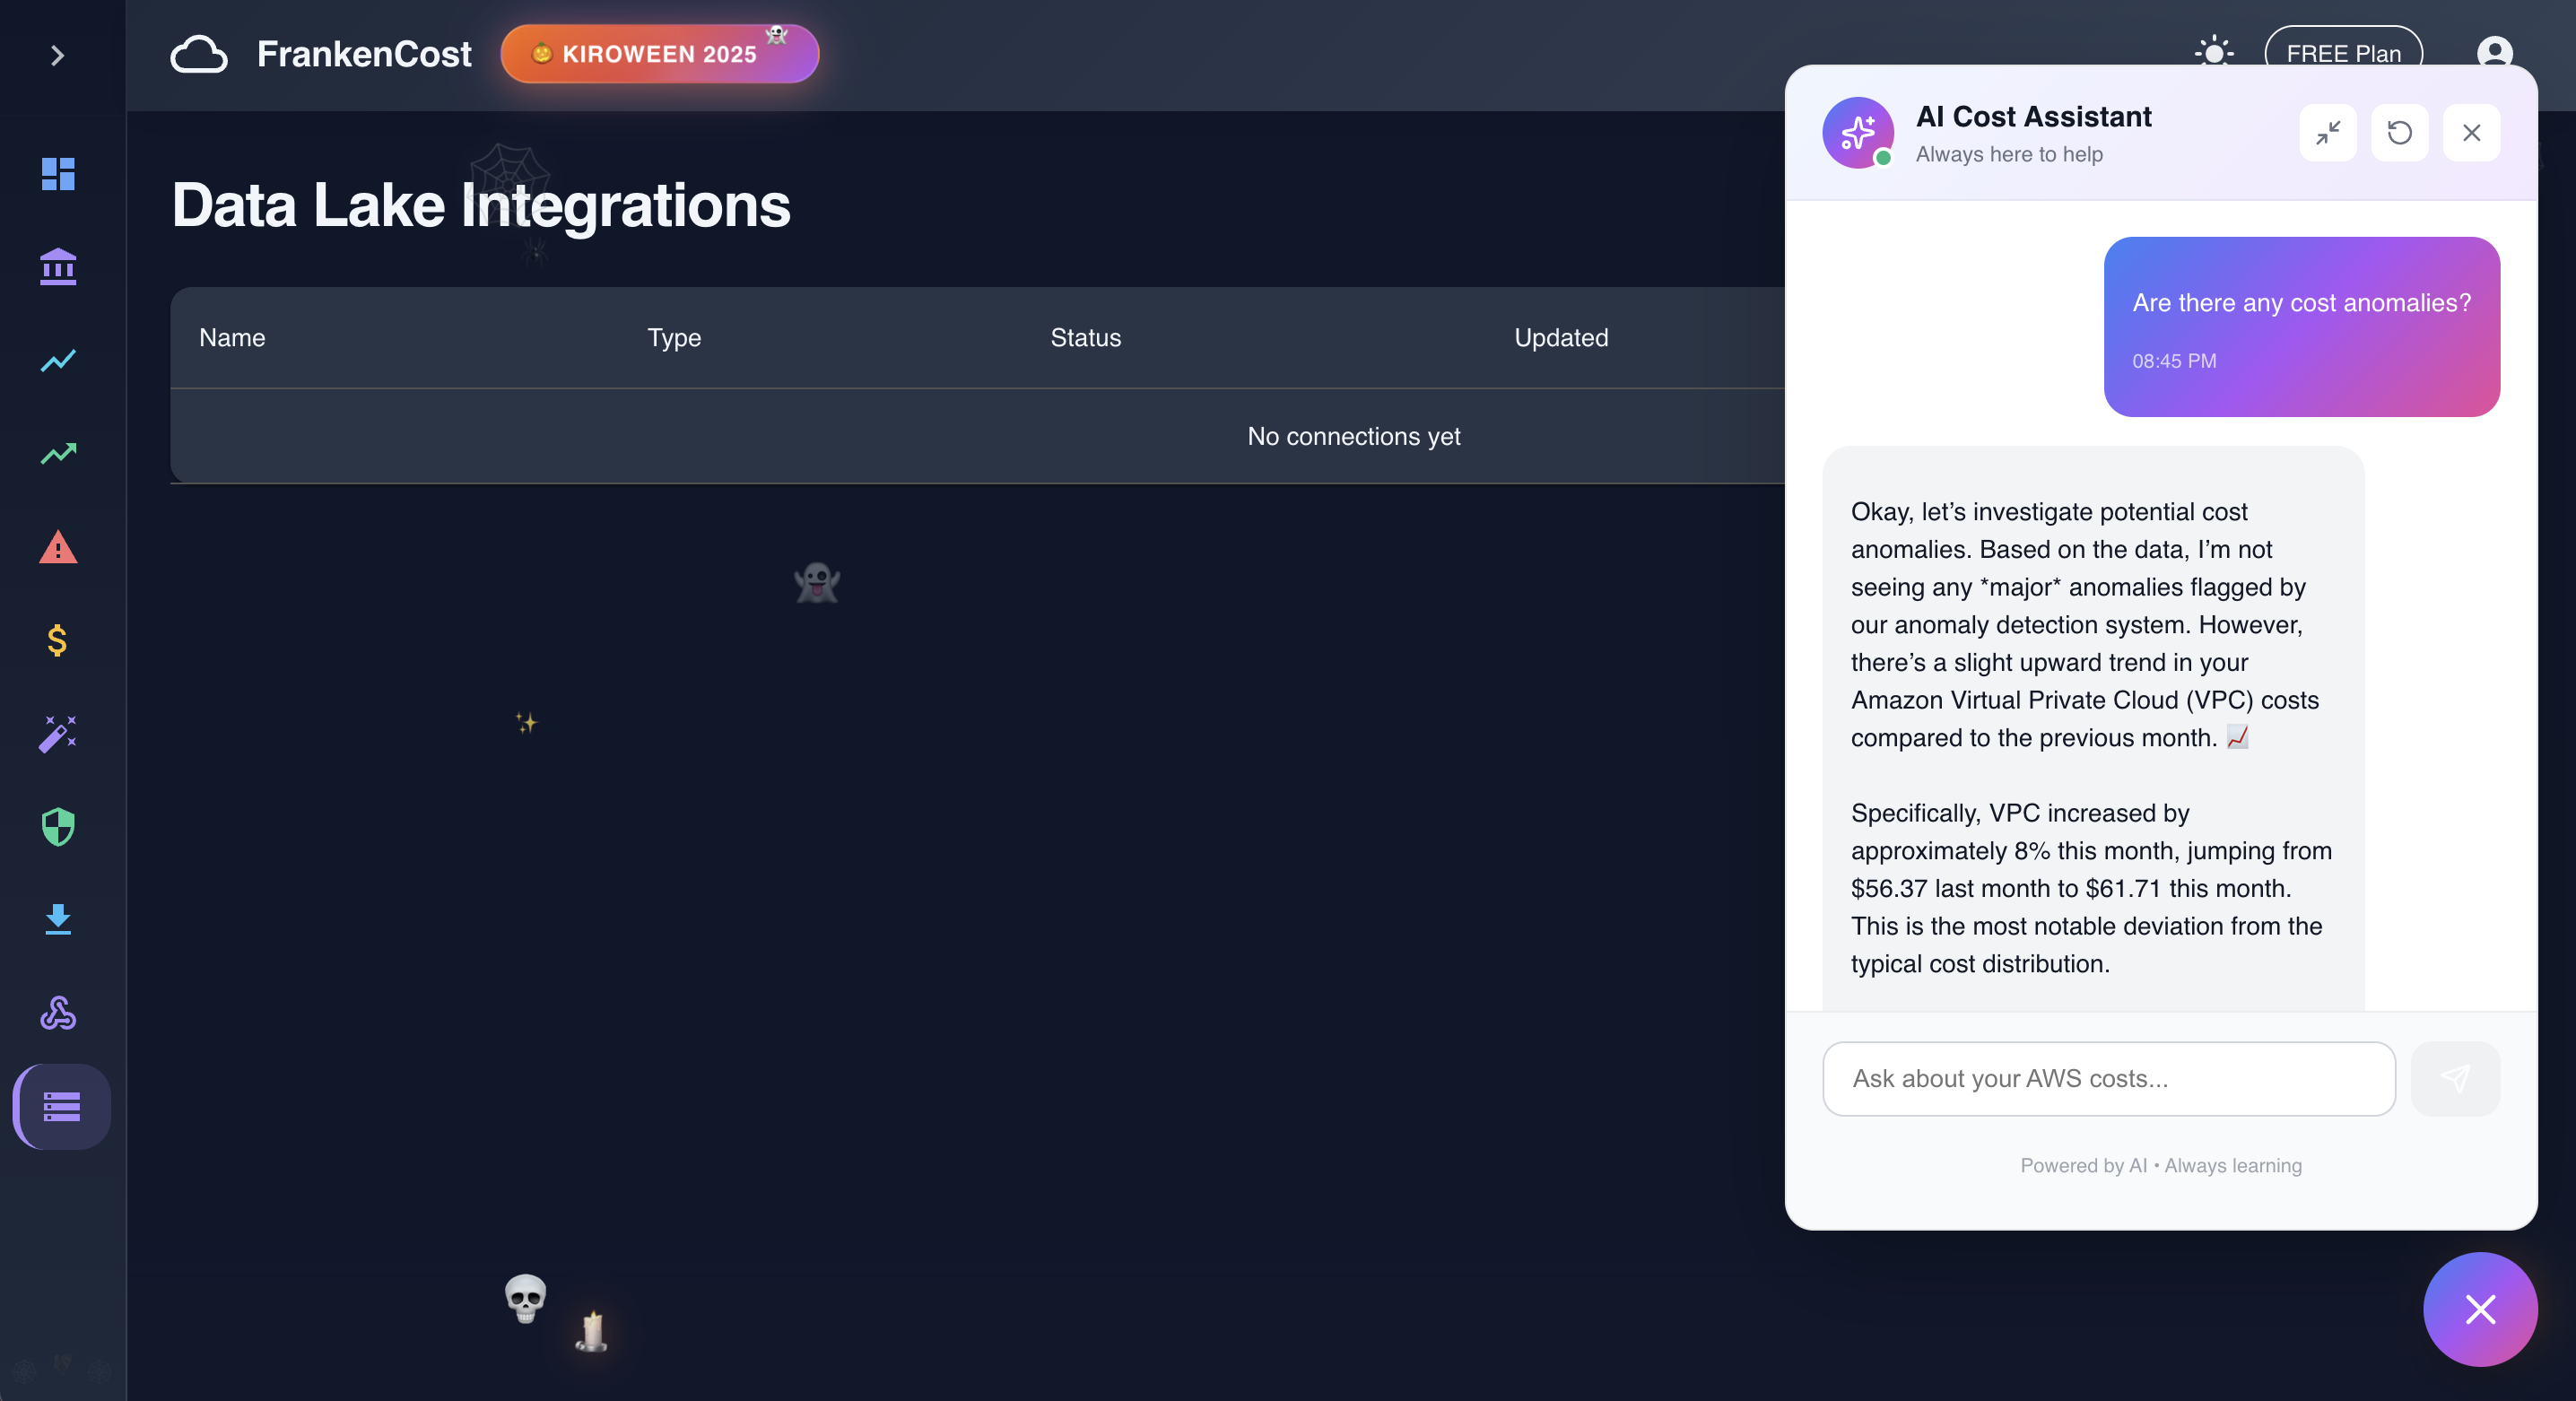
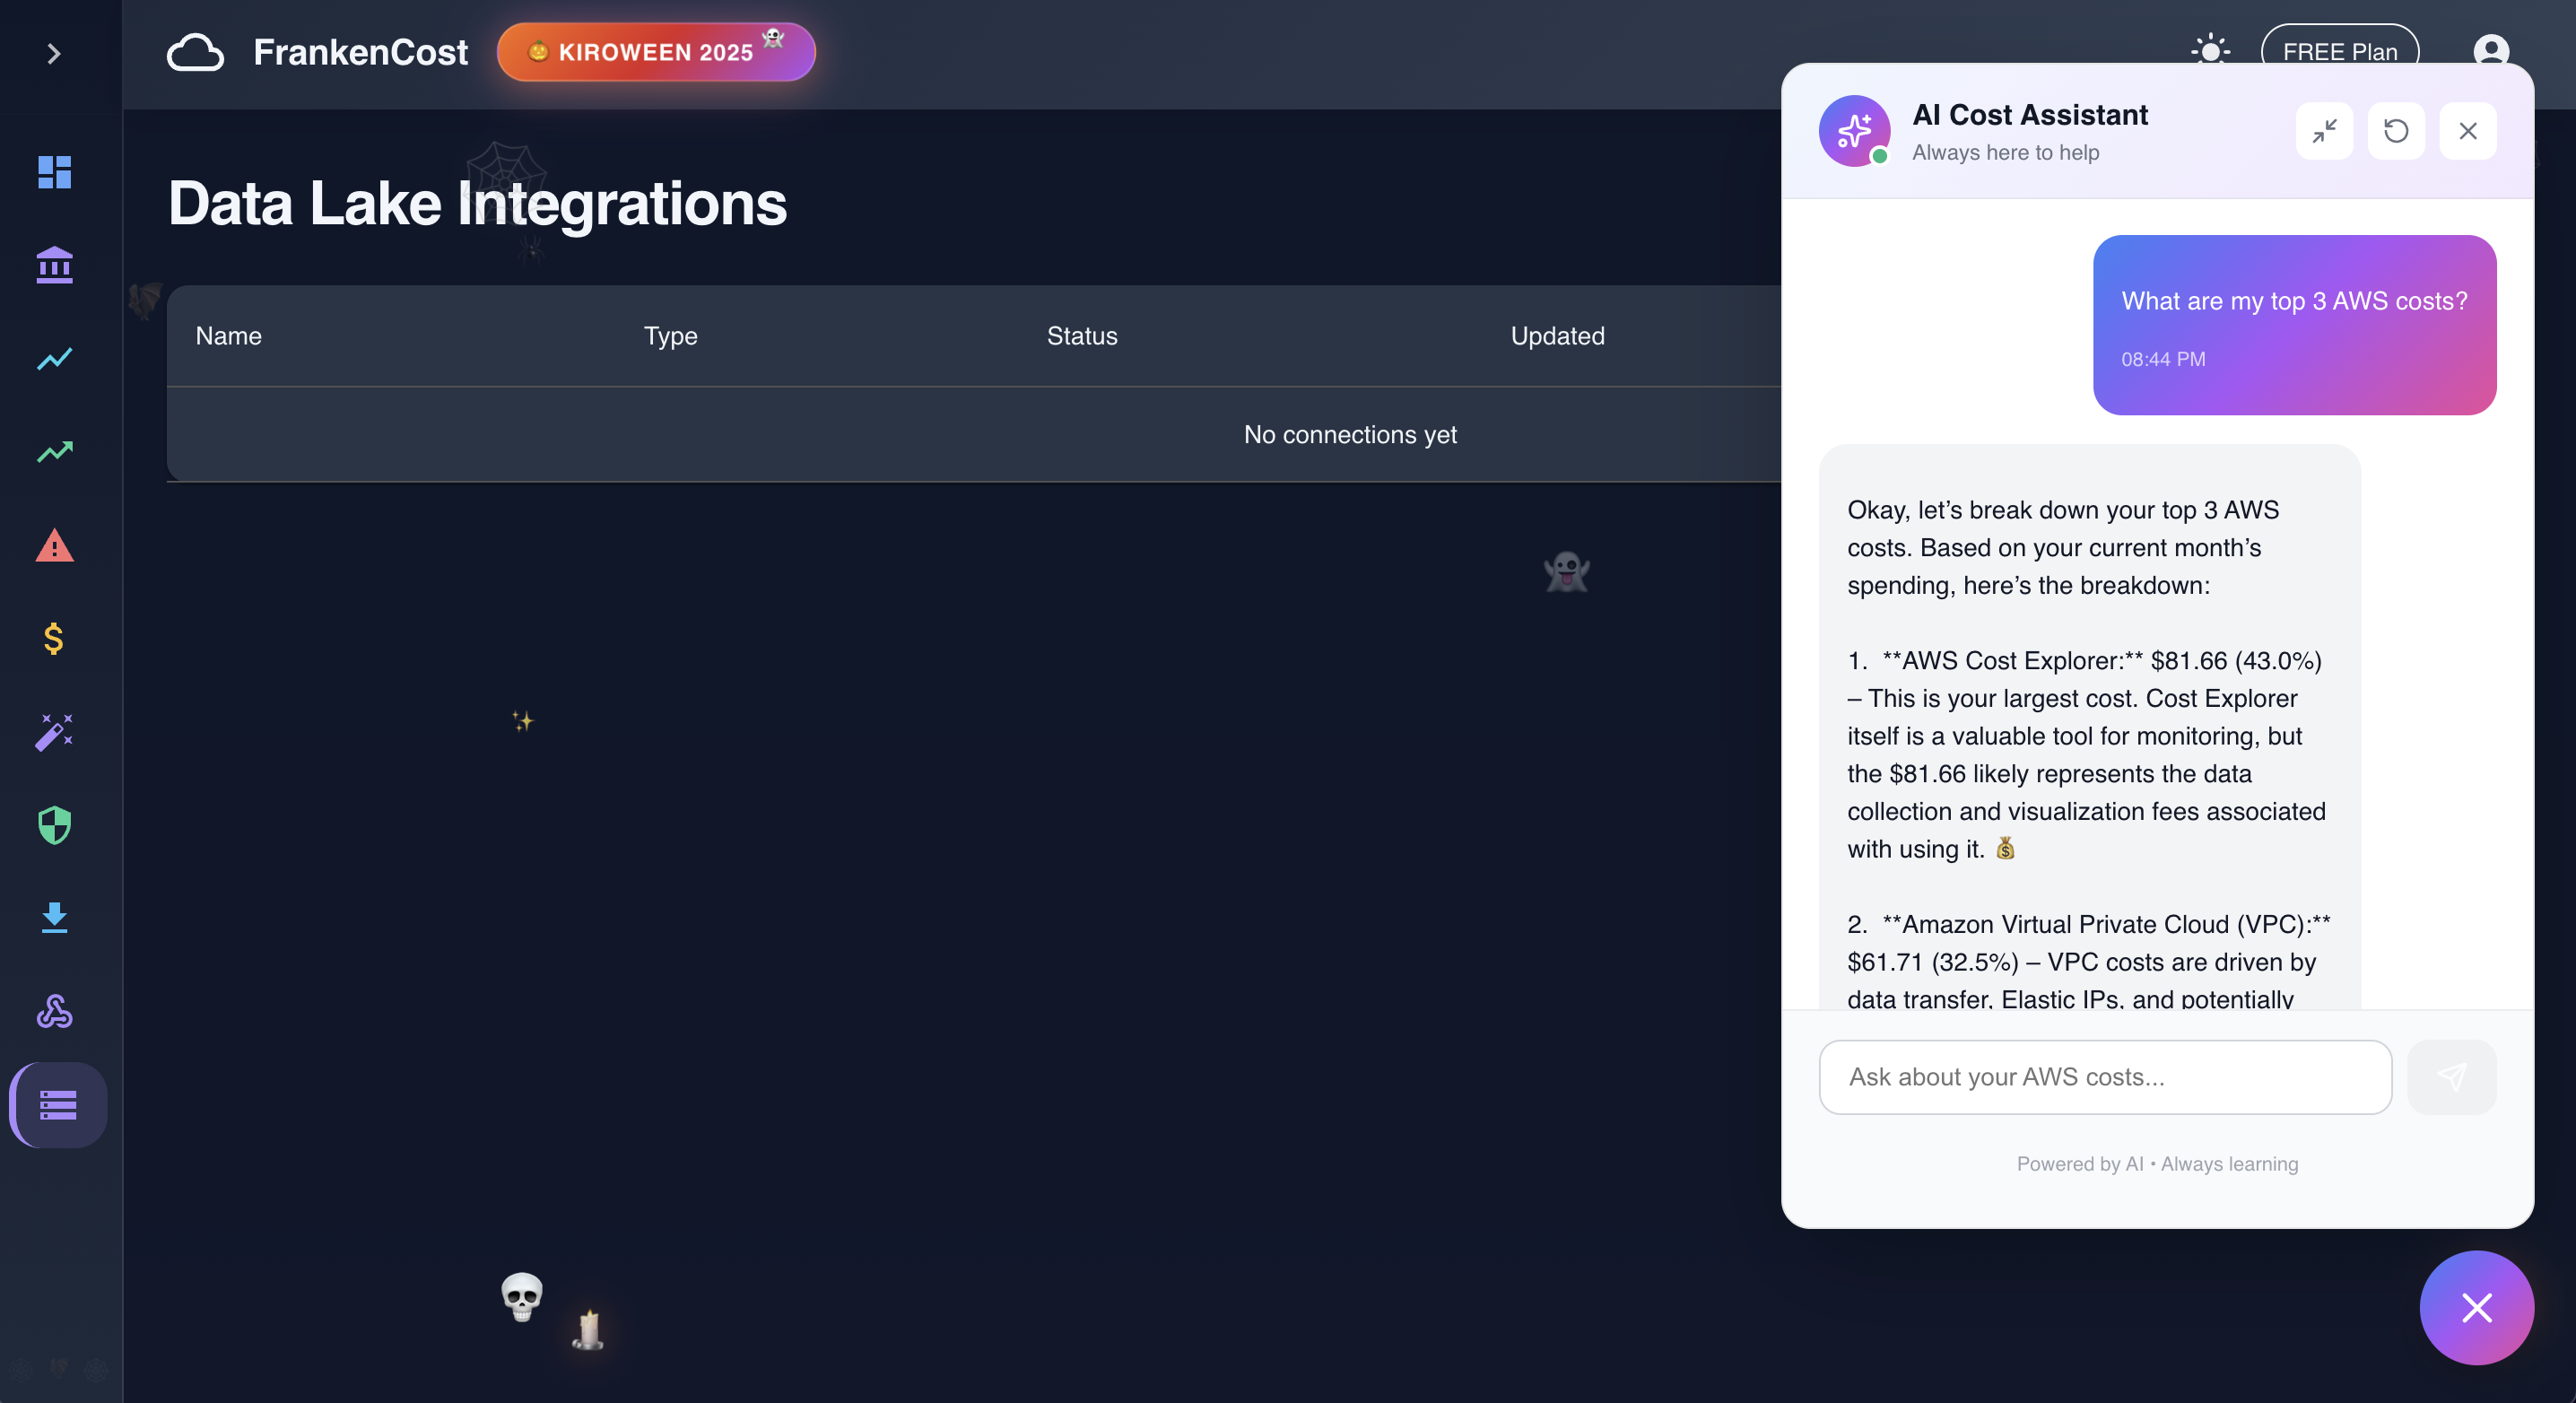
AI Assistance in action with real time answer backed by Gemini AI
-
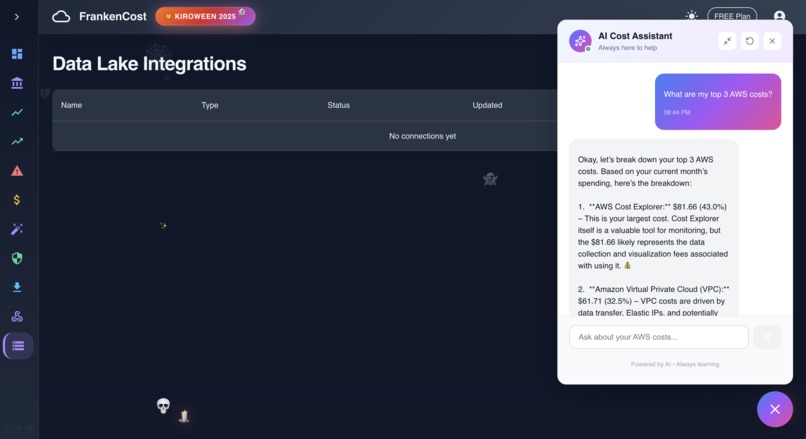
AI Assistance in action with real time answer backed by Gemini AI


Frankencost
Inspiration
It started with a $1500 AWS bill.
Not mine, thankfully. A friend's startup got hit with a surprise bill because someone left a few EC2 instances running over a long weekend. By the time they noticed, the damage was done.
That conversation stuck with me - how is it that in 2025, we still can't get a simple answer to "where is my cloud money going?"
AWS Cost Explorer exists, sure. But it's buried in the console, the data is delayed by hours, and good luck explaining those graphs to your finance team. I wanted something that could answer questions like a human would - "Why did my bill spike last Tuesday?" - and actually give me a useful answer.
When I saw the Kiroween hackathon with the Frankenstein category, it clicked. The best cost tracker wouldn't be a monolith - it would be a monster stitched together from the best tools for each job.
What it does
Frankencost tracks your AWS spending in real-time and tells you exactly where the money's going.
Core capabilities:
- Real-time Dashboard - Live cost monitoring with animated counters, period comparisons, and month-end projections
- AI Cost Assistant - Ask questions in plain English: "Why did EC2 costs increase?" and get specific answers based on your actual data
- Anomaly Detection - Statistical analysis catches unusual spending patterns before they become expensive problems
- ML Forecasting - Predicts your month-end bill using ARIMA and polynomial regression models
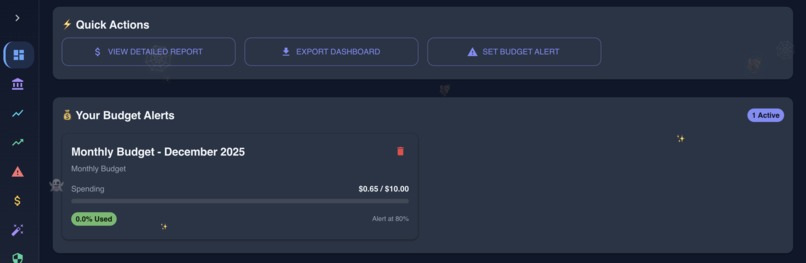
- Budget Alerts - Set thresholds, get notified via Slack, email, or webhooks when you're approaching limits
- Resource Lifecycle - Schedule EC2 start/stop times, detect orphaned resources wasting money
- Data Lake Export - Push cost data to S3 or external systems in CSV, JSON, or Parquet formats
The math behind our forecasting uses ARIMA (AutoRegressive Integrated Moving Average) for time-series prediction:
$$ \hat{y}t = c + \sum{i=1}^p \phi_i y_{t-i} + \sum_{j=1}^q \theta_j \epsilon_{t-j} + \epsilon_t $$
Combined with polynomial regression for trend analysis:
$$ y = \beta_0 + \beta_1 x + \beta_2 x^2 + ... + \beta_n x^n $$
This dual-model approach gives us both short-term accuracy and long-term trend visibility.
How we built it
I went full mad scientist on this one - true to the Frankenstein spirit.
The body parts we stitched together:
| Technology | Purpose | The "Stitch" |
|---|---|---|
| AWS Cost Explorer API | Raw cost data | Cloud billing $\to$ Local analytics |
| Google Gemini AI | Natural language queries | LLM $\to$ Financial insights |
| ARIMA + Polynomial Regression | ML Forecasting | Statistical models $\to$ Cost predictions |
| PostgreSQL | Persistent storage | Relational DB $\to$ Time-series cost data |
| Chart.js + Recharts | Visualization | Two chart libs $\to$ Unified dashboard |
| Slack + Webhooks | Notifications | Multiple channels $\to$ Single event system |
| JWT + AES-256 | Security | Auth + Encryption $\to$ Enterprise-grade protection |
Kiro was the secret weapon. I used:
- Spec-driven development for major features - wrote detailed specs, let Kiro implement, then iterated. The
ai-assistant.mdspec alone saved me 15+ hours. - Steering files kept code consistent across 40+ API endpoints. Security guidelines meant every database query got parameterized automatically.
- Hooks for automated quality gates - lint on save, type checking, security reminders when touching backend routes.
The architecture has 6 distinct layers: $$ \text{Data Acquisition} \to \text{Intelligence} \to \text{Persistence} \to \text{Notification} \to \text{Visualization} \to \text{Security} $$ Each layer can be modified independently. Swap Gemini for Claude? Change one service file. Replace PostgreSQL with MongoDB? The API layer doesn't care.
Challenges we ran into
Getting Gemini to give useful answers was harder than expected. Version 1 would say things like "Your costs increased due to increased usage" - technically true but completely useless.
The fix: I had to feed it structured context - actual cost breakdowns by service, historical trends, specific resource information. Now it can tell you "Your EC2 costs jumped 34% because you spun up 3 new m5.xlarge instances in us-east-1 on Tuesday."
Data isolation in a multi-tenant app kept me up at night. One user should never see another user's cost data. I added user_id filtering to every single database query:
SELECT * FROM cost_records WHERE user_id = $1 AND date BETWEEN $2 AND $3
Then wrote security tests that specifically try to access other users' data. Paranoid? Maybe. Necessary? Absolutely.
Integrating two charting libraries sounds crazy, but Chart.js handles simple charts beautifully while Recharts excels at complex compositions. Making them look consistent required a shared color palette and animation timing.
Accomplishments that we're proud of
- 15+ features shipped in 3 weeks - dashboard, AI chat, anomaly detection, forecasting, budgets, lifecycle management, webhooks, data lake exports, and more
- Zero security vulnerabilities - every route authenticated, every query parameterized, credentials encrypted with AES-256-GCM
- 70% faster development with Kiro's spec-driven approach compared to traditional coding
- The AI actually works - it doesn't give generic advice, it analyzes your specific cost data and gives actionable insights
- True Frankenstein architecture - 8+ technologies that shouldn't work together, working together beautifully
The anomaly detection uses z-score analysis to flag unusual spending:
$$ z = \frac{x - \mu}{\sigma} $$
Where $|z| > 2$ triggers a warning and $|z| > 3$ triggers a critical alert. Simple math, but it catches problems before they become expensive.
What we learned
- Spec-driven development is slower to start but faster to finish. Writing a spec for anomaly detection took an hour. But Kiro generated code that worked on the first try. Compare that to vibe coding where I'd write, test, fix, repeat for days.
- Frankenstein isn't just a hackathon category - it's a solid architecture pattern. Each component does one thing well. If Gemini's API goes down, the dashboard still works. If I want to swap Chart.js for D3 later, I can do it without touching the forecasting logic.
- Steering files are underrated. Having security guidelines automatically included in every Kiro conversation meant I never had to remember to ask for parameterized queries or input validation. It just happened.
- The 80/20 rule applies to AI assistants. 80% of the value comes from feeding the AI good context. The model itself is almost secondary - garbage in, garbage out.
What's next for Frankencost
- Multi-cloud support is the obvious next step. Azure Cost Management and GCP Billing APIs follow similar patterns - the architecture is ready for it.
- Slack slash commands so teams can query costs without leaving chat:
/frankencost why did costs spike yesterday? - Automated remediation - don't just detect orphaned resources, offer to terminate them with one click.
- Cost allocation tags - automatically suggest tags based on resource naming patterns and usage.
But honestly? I'm just happy the monster is alive and working. Dr. Frankenstein would be proud.
Built With
- aes-256-gcm-encryption
- arima-forecasting
- bcrypt
- chart.js
- cost-explorer-api
- ec2-api
- eslint
- express.js
- frontend:-react-18
- helmet.js-integrations:-slack-api
- hooks)
- material-ui-v5
- nodemailer-deployment:-vercel-(frontend)
- polynomial-regression-security:-jwt
- postgresql-aws-integration:-aws-sdk-v3
- recharts-backend:-node.js
- render-(backend-+-database)-development:-kiro-(specs
- s3-api-ai/ml:-google-gemini-ai
- steering
- typescript
- webhooks

Log in or sign up for Devpost to join the conversation.