-
-
Incident Recovery
-
Current Conditions
-
Bloom Favorability
-

Logo
-
X-Ray the Bay
-
Condition Severity
-
Analyst Review

Inspiration
An algal bloom is a rapid increase in algae or cyanobacteria in water. Some blooms produce toxins that can harm people and animals, while others block sunlight or reduce oxygen as they decay, damaging aquatic ecosystems. Learn more from the CDC.
With the Fox River and Green Bay in our backyard, this problem is local and immediate. Environmental measurements, satellite imagery, and scientific reports already exist, but they are spread across different systems and can be difficult to interpret without specialized knowledge.
That inspired FoxWatch: an evidence-first platform that brings environmental observations, satellite estimates, scientific research, and understandable AI explanations into one accessible dashboard.
We started with a simple question:
Could we make it easier for people to investigate changing water conditions while remaining honest about what the available evidence can, and cannot, tell us?
What it does
FoxWatch helps users investigate water quality and potential algal bloom activity in the Fox River and Green Bay area.
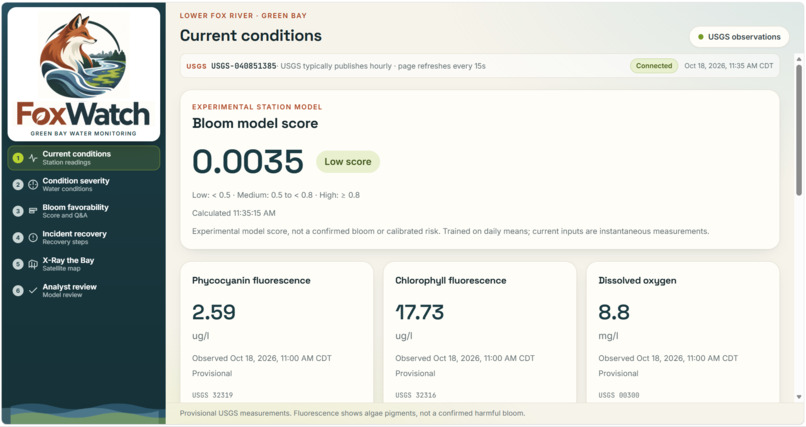
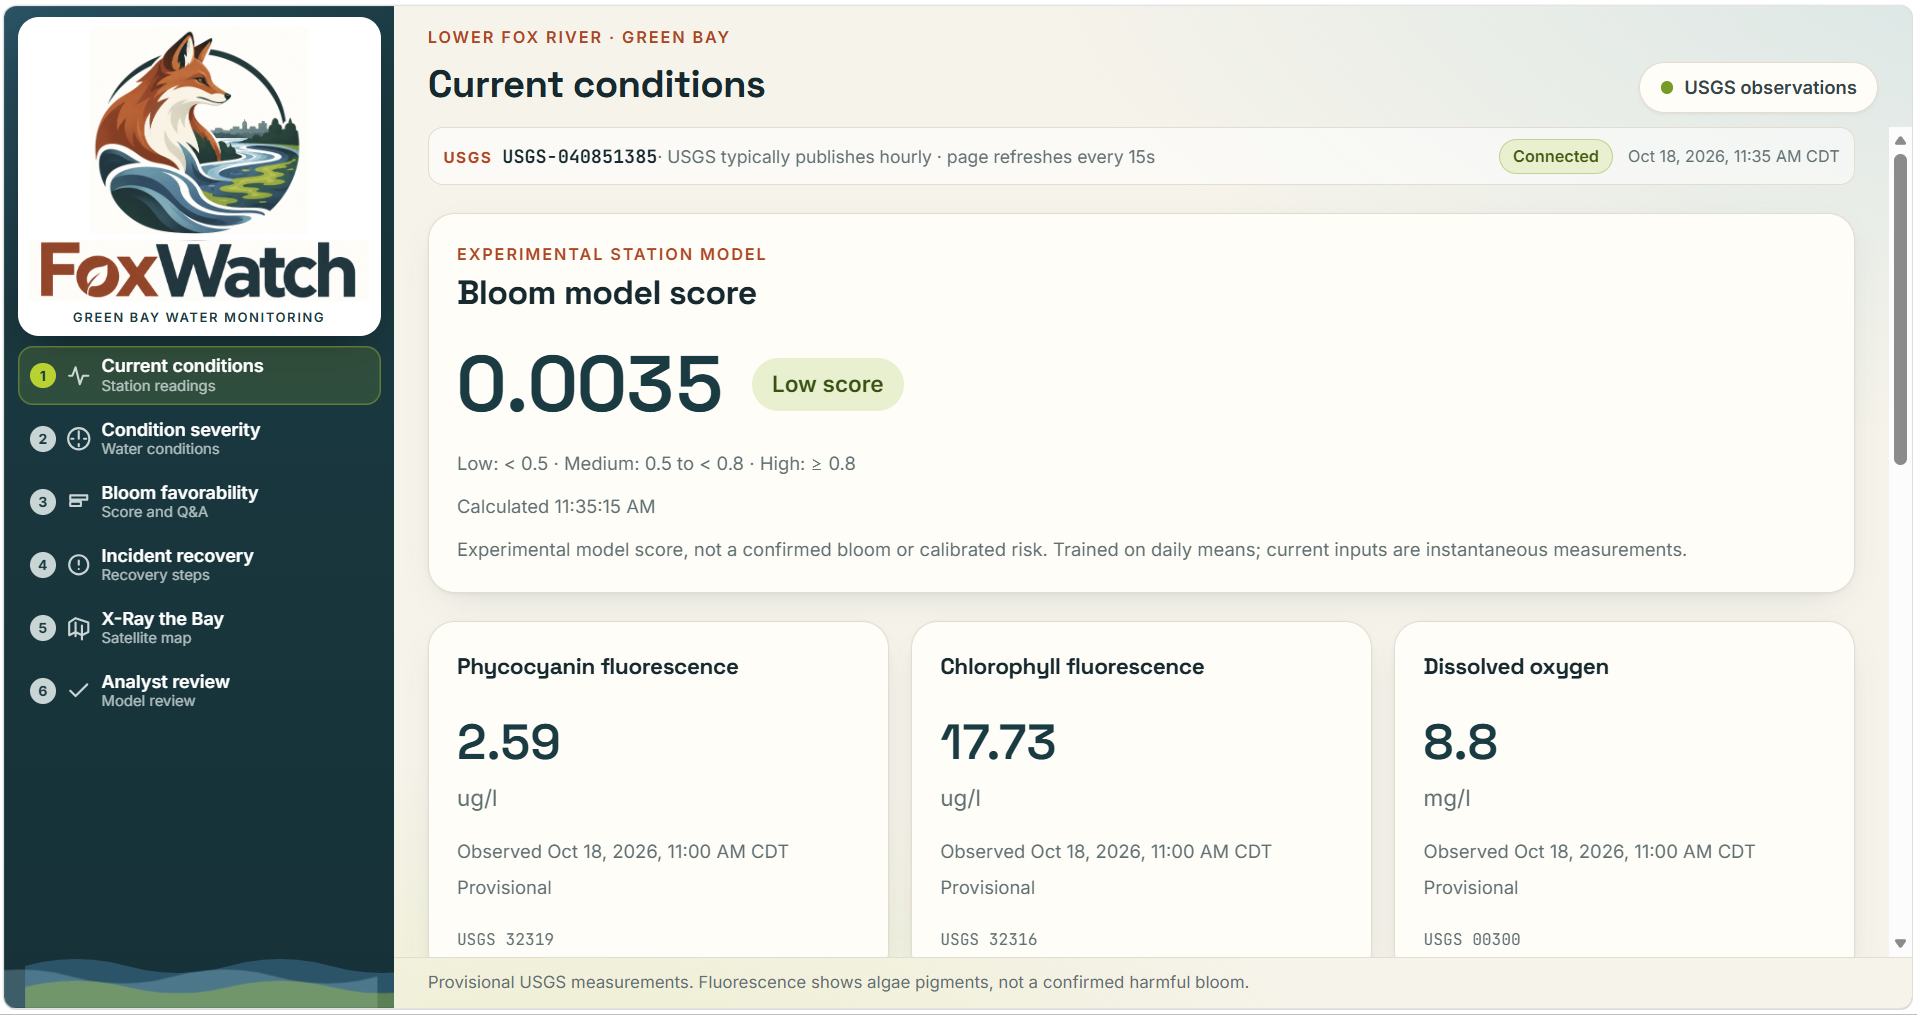
- Current conditions: Displays timestamped USGS measurements, including water temperature, turbidity, dissolved oxygen, conductivity, and algal pigment fluorescence. The dashboard refreshes every 15 seconds while preserving the actual measurement times.
- Experimental bloom classification: Runs a logistic regression model on available station measurements and displays a bloom probability score.
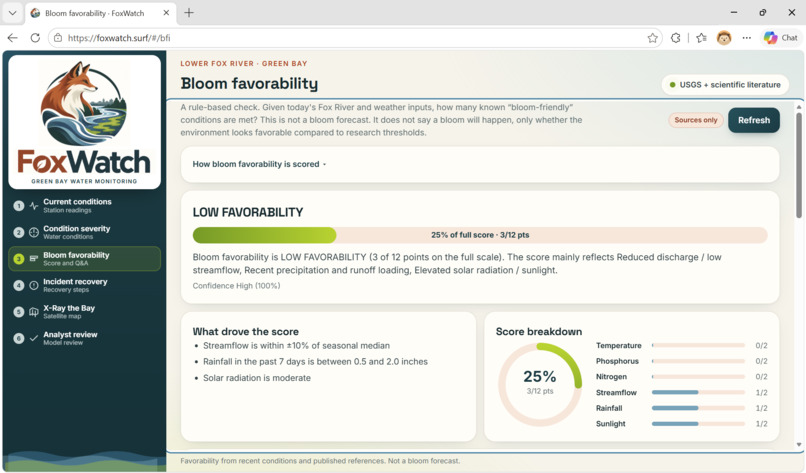
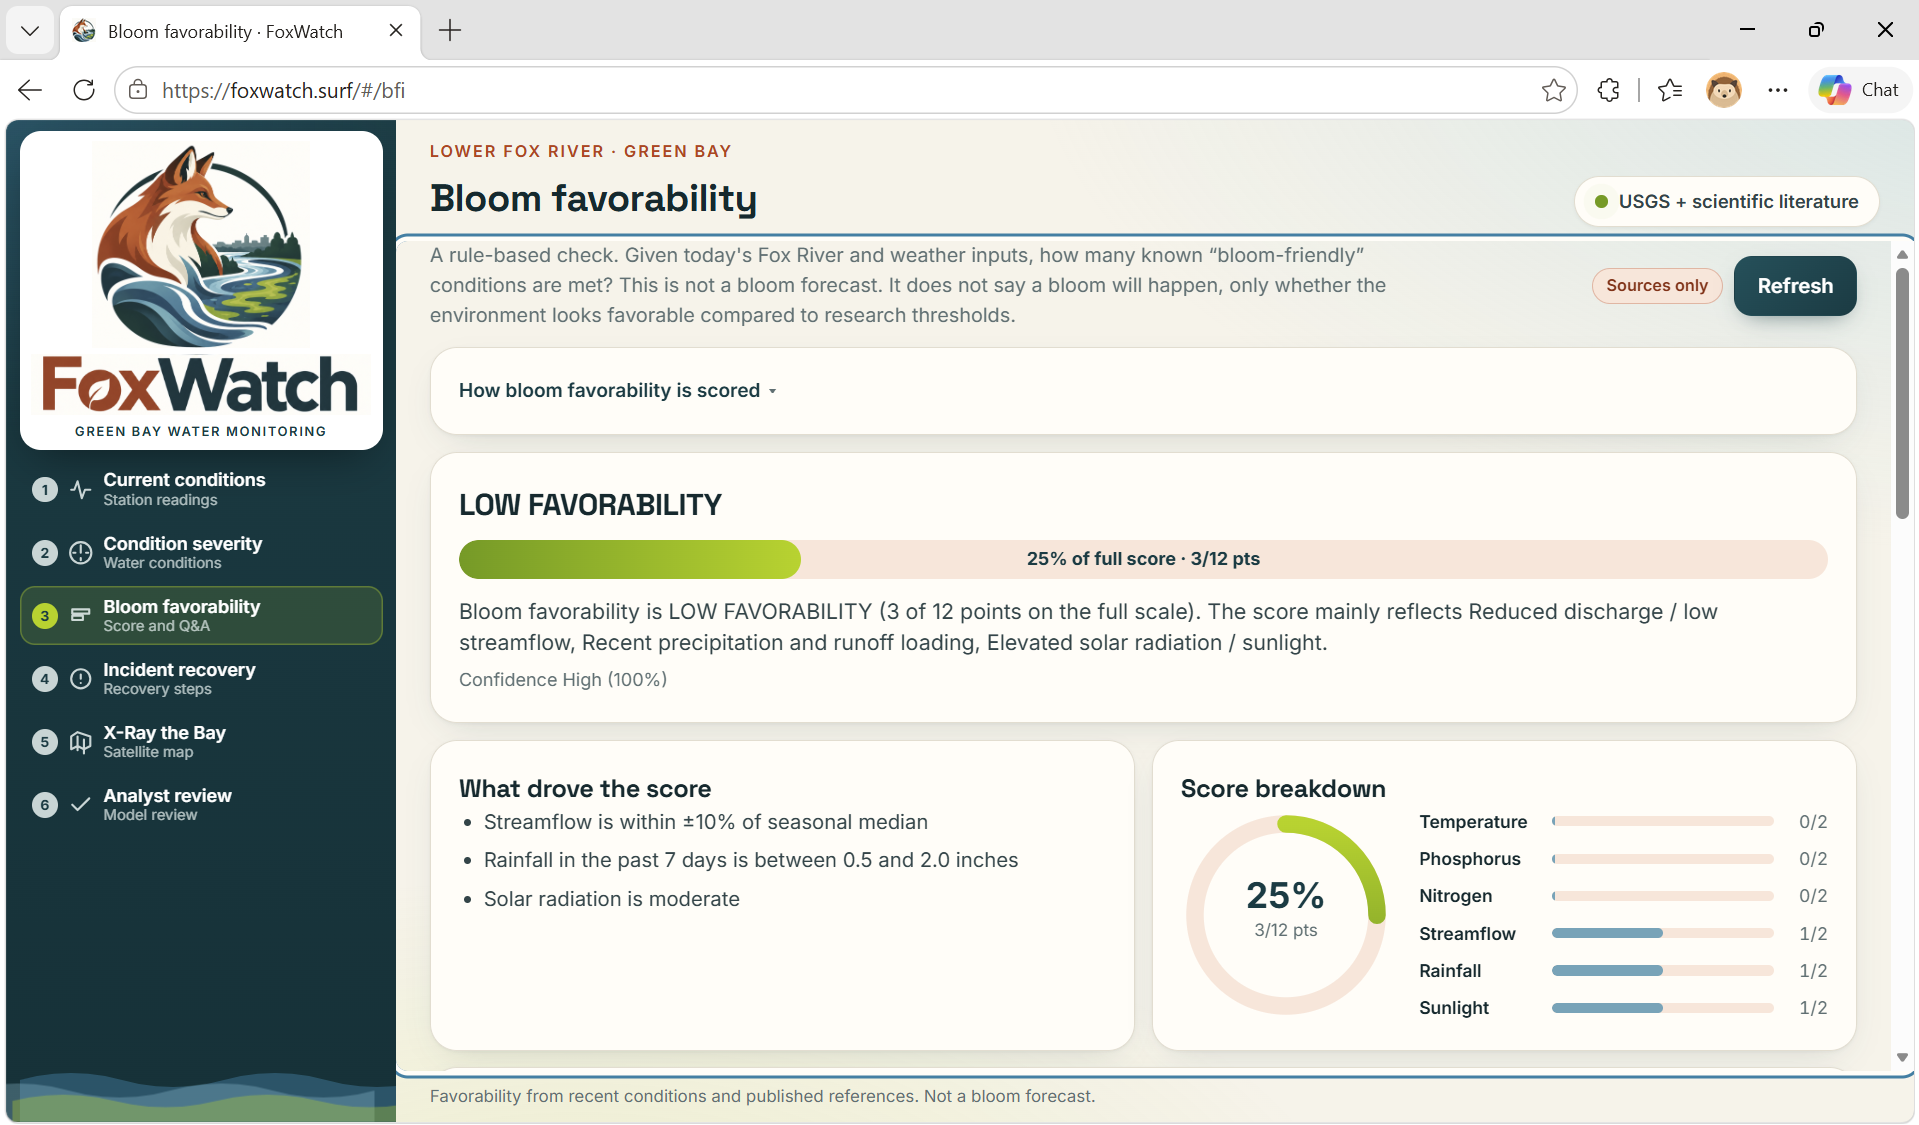
- Bloom favorability: Shows how environmental factors contribute to conditions that may favor algae growth.
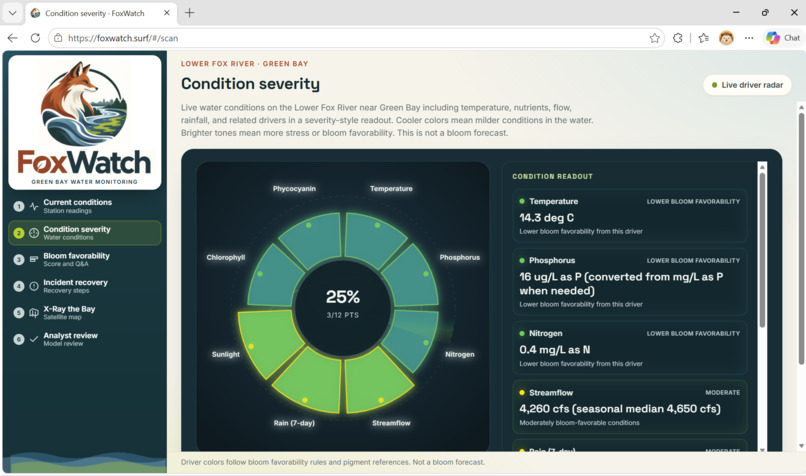
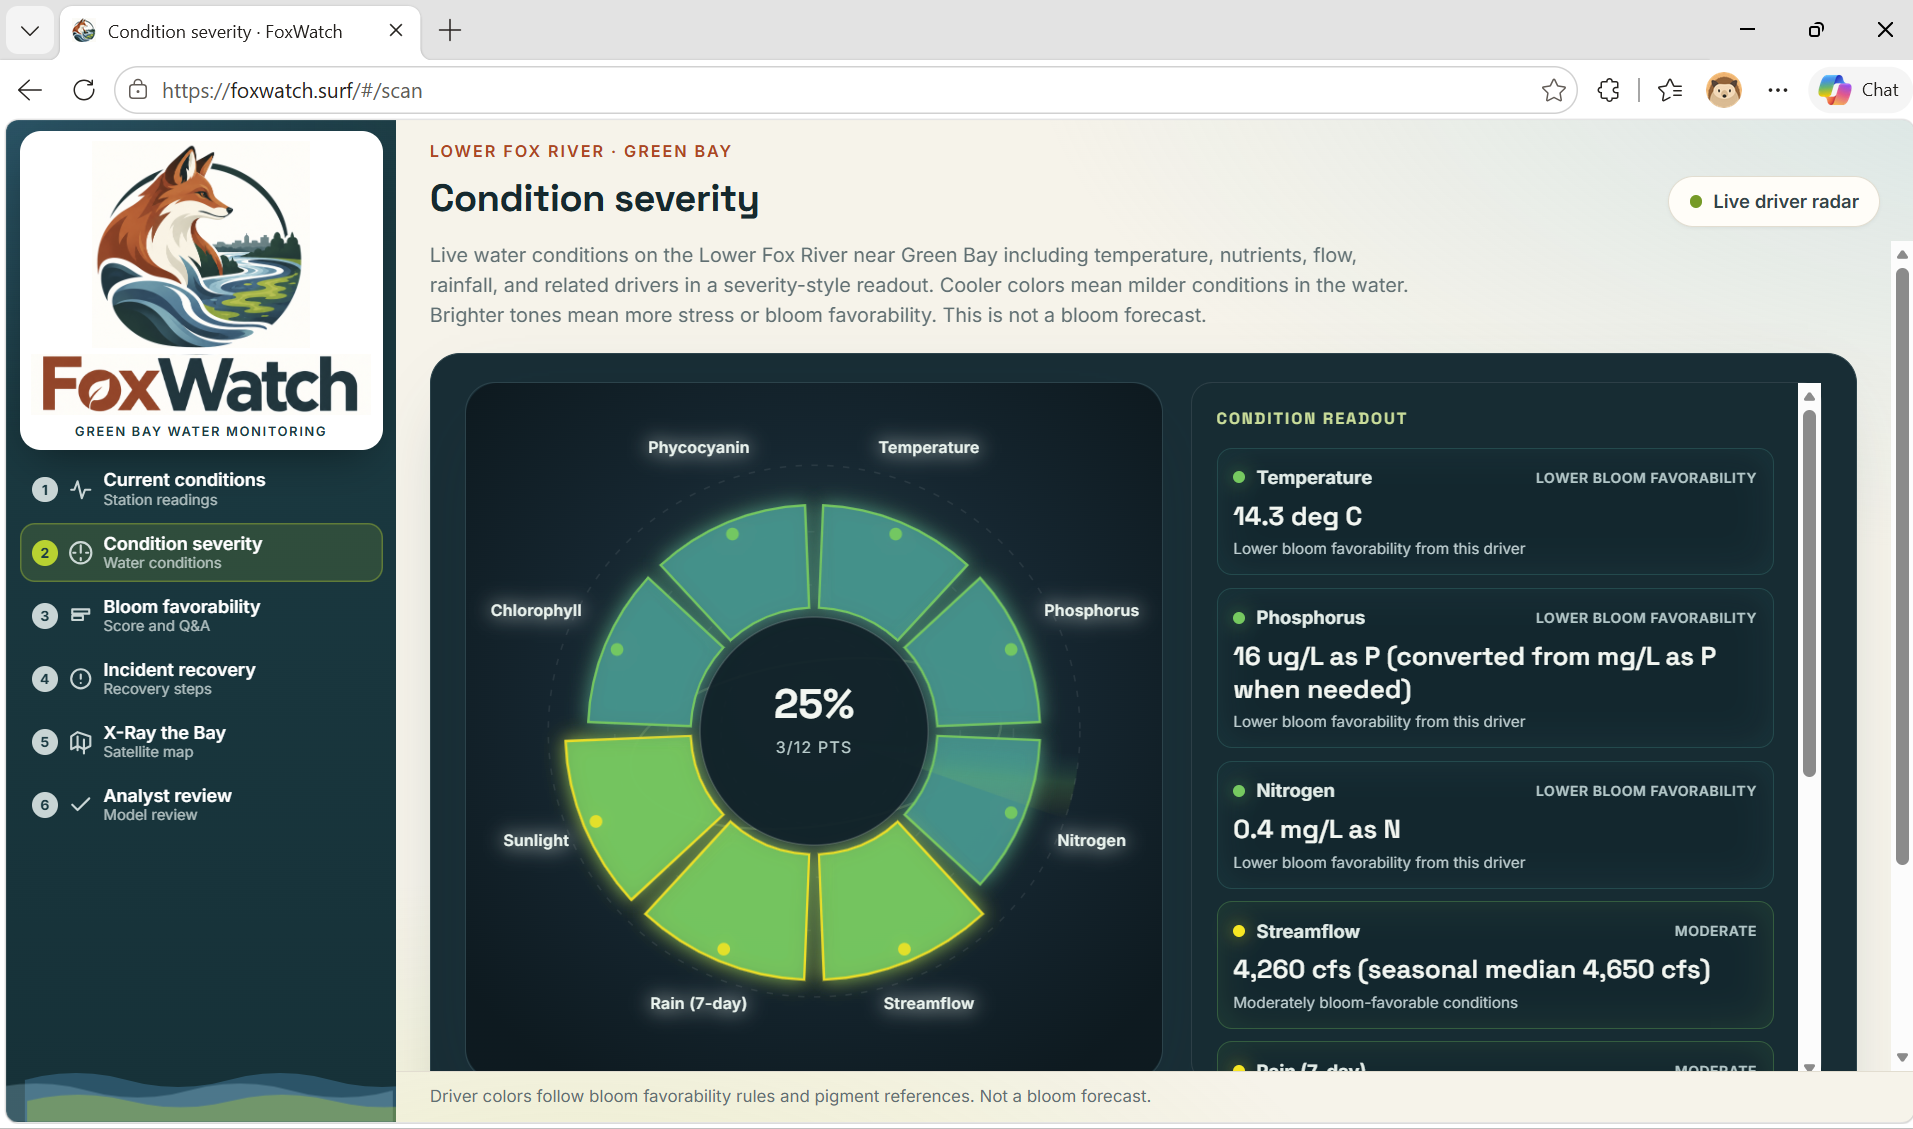
- Condition severity: Helps users compare water-quality drivers and identify which measurements may deserve closer attention.
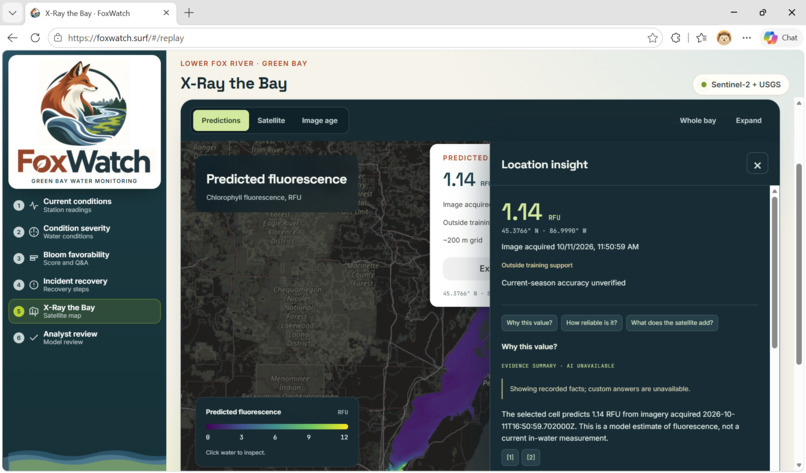
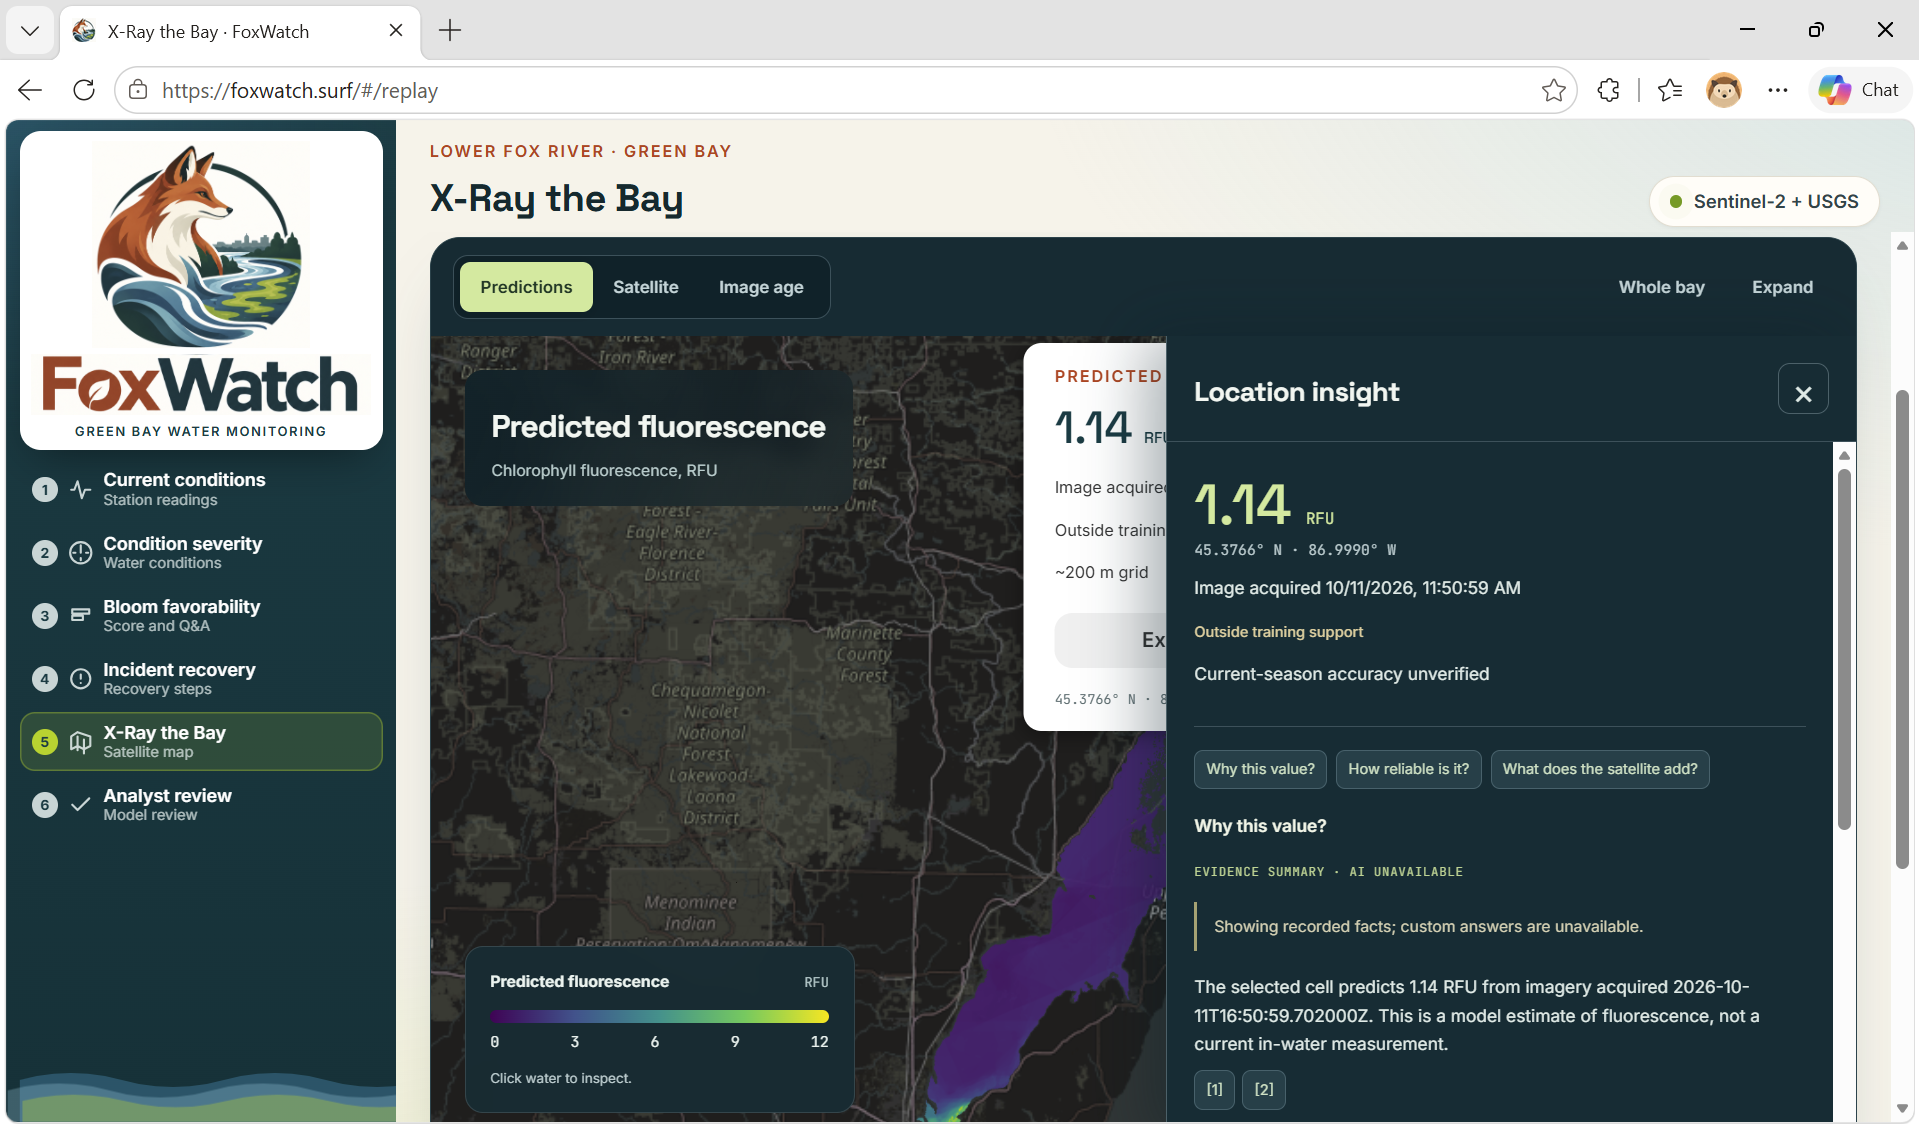
- X-Ray the Bay: Uses recent Sentinel-2 imagery and a model trained on historical USGS FLAMe research-vessel measurements to estimate chlorophyll fluorescence across Green Bay.
- Model validation: Compares spatial estimates against real boat measurements that were intentionally withheld during testing.
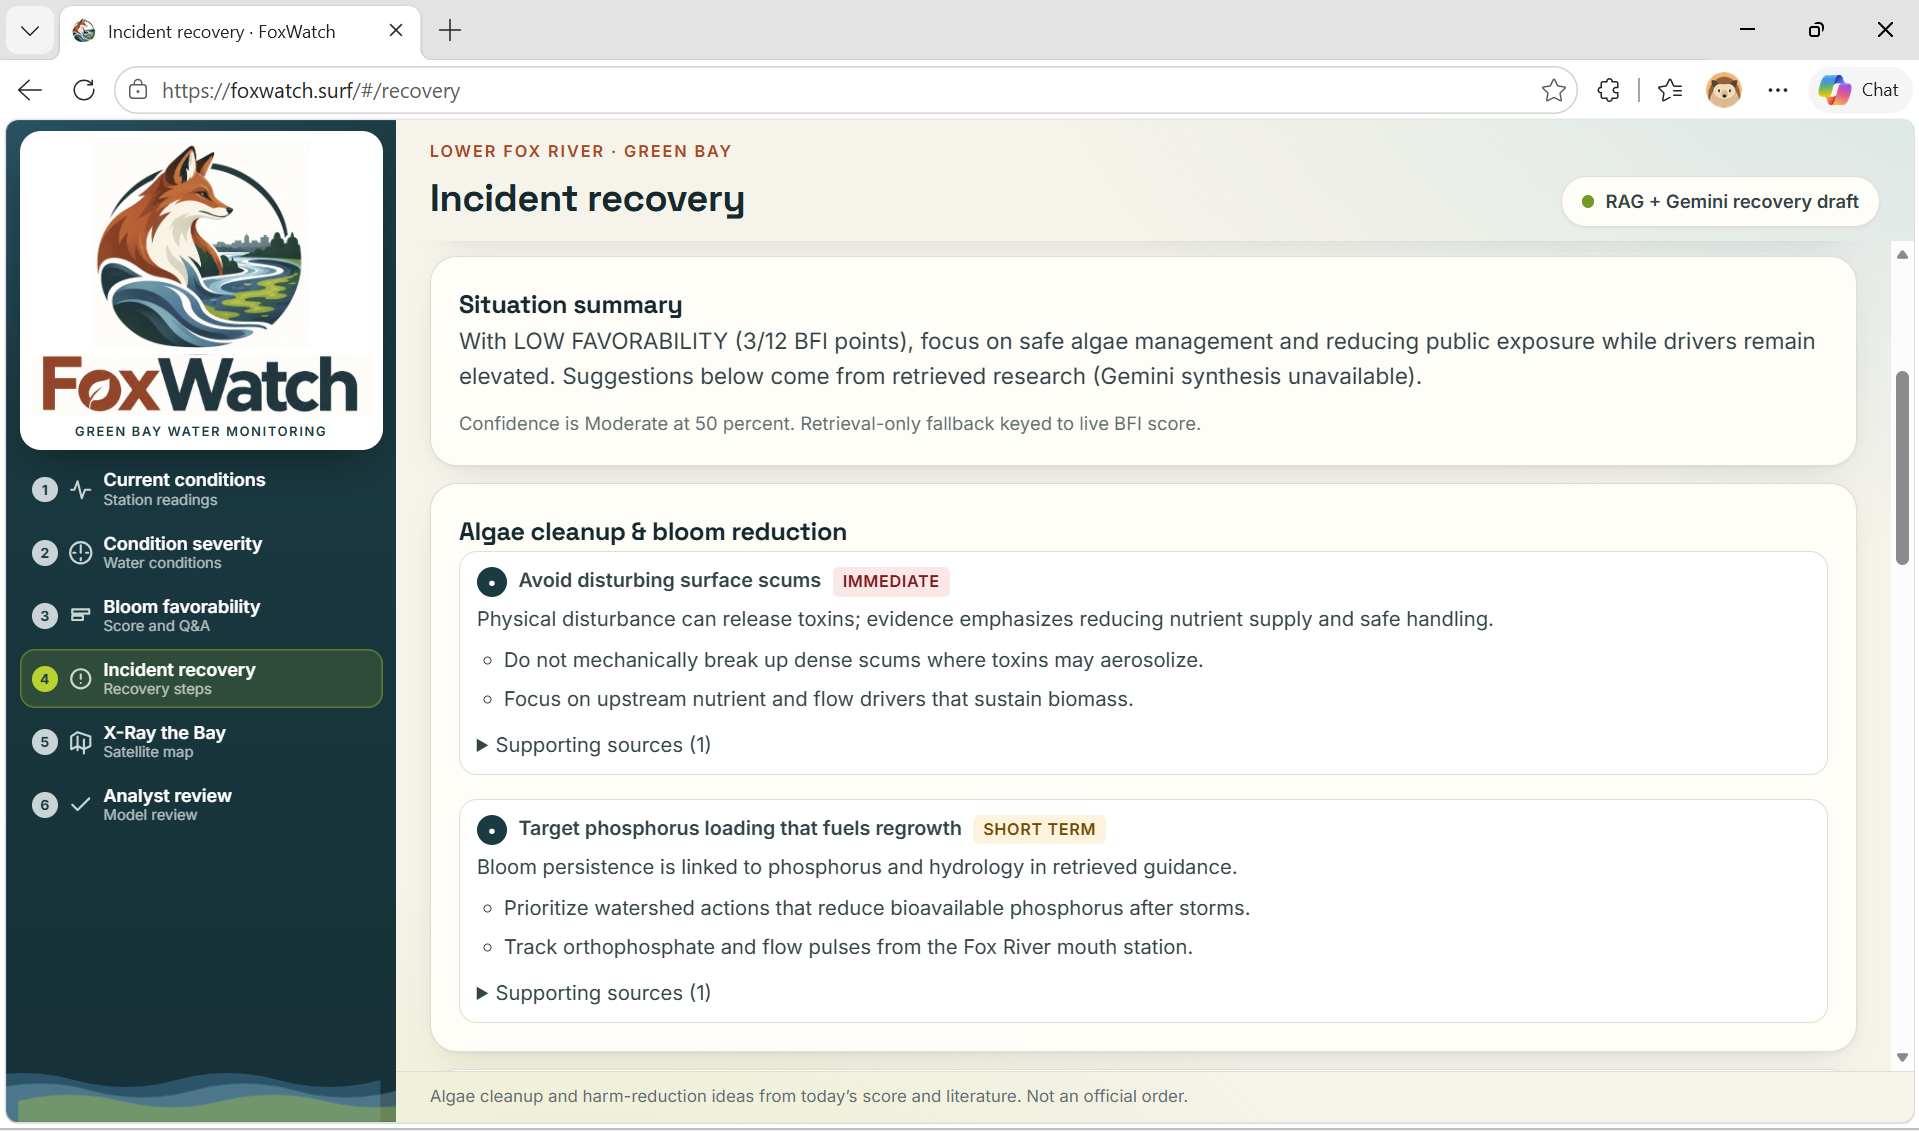
- AI explanations: Uses Gemini and retrieved scientific literature to explain observations while linking users back to supporting evidence.
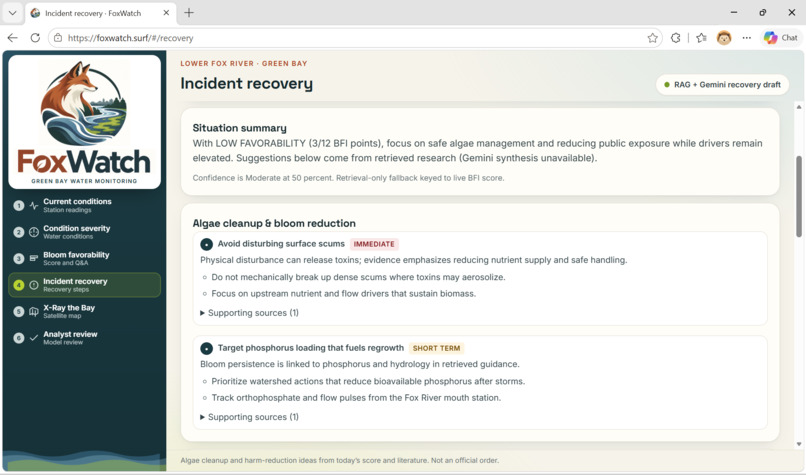
- Follow-up actions: Provides evidence-informed monitoring, prevention, and incident-recovery considerations.
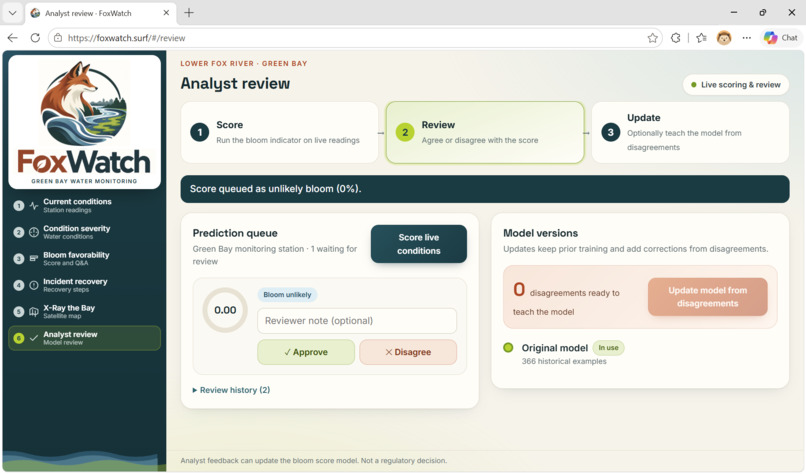
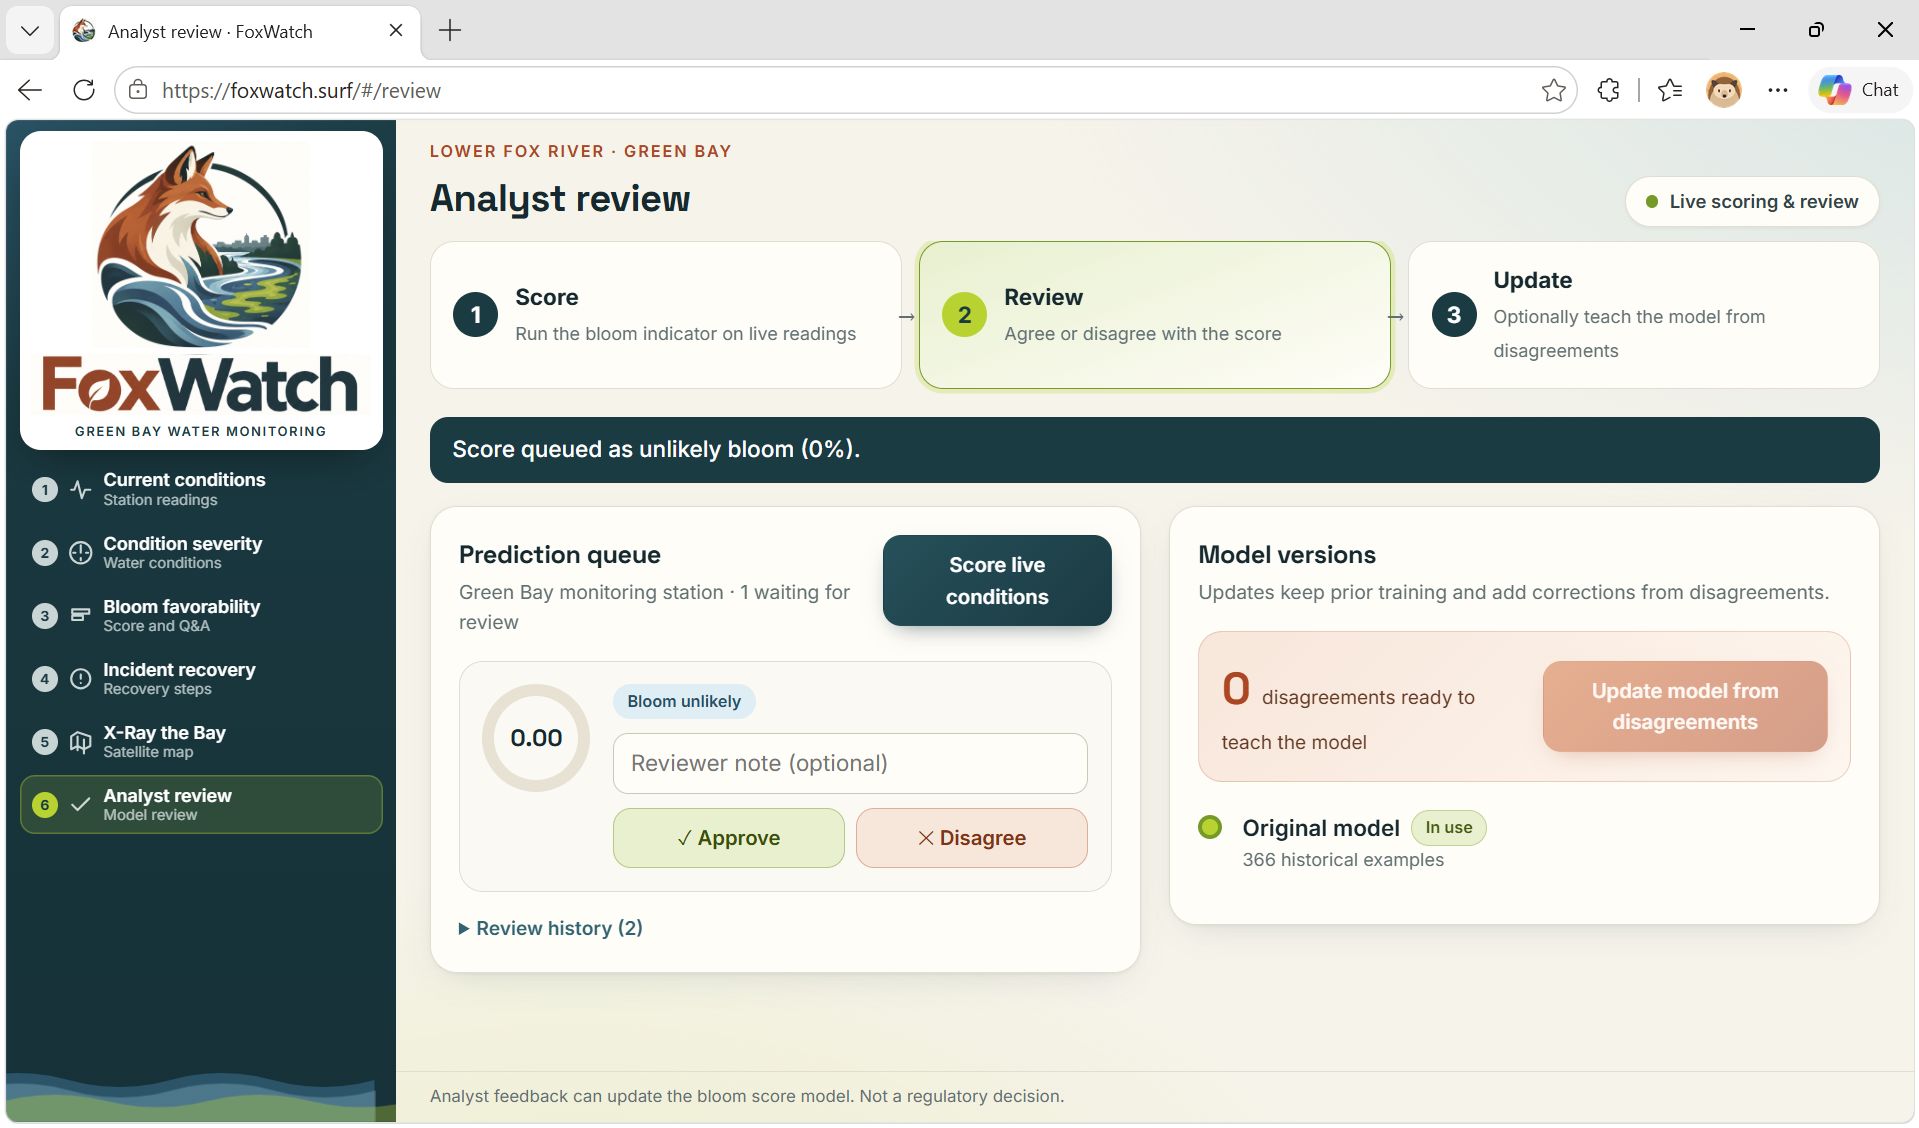
- Human feedback: Allows analysts to review predictions and use their corrections to refit the station model.
FoxWatch is designed to support investigation, not replace field testing or public-health guidance. Its fluorescence measurements, favorability scores, and satellite estimates do not establish toxin concentrations or confirm that a harmful algal bloom is present.
How we built it
We built FoxWatch as a full-stack application that connects live environmental data, machine learning, satellite processing, scientific literature, and cloud infrastructure.
Environmental data pipeline
USGS measurements flow into Tiger Data, where PostgreSQL and TimescaleDB store observation history for the dashboard and prediction services.
Our Python and FastAPI backend retrieves those observations, runs scoring and inference, and serves results to a React and TypeScript frontend. When a required measurement is temporarily unavailable, the prediction pipeline can use its most recent measured value while preserving the original timestamp so users can see how old the evidence is.
We also use:
- Open-Meteo for rainfall context.
- The Water Quality Portal for nutrient samples.
- Public scientific and public-health documents for evidence retrieval.
- Wisconsin DNR reports and advisories as context for experimental training labels.
Machine learning and experimental labels
Finding trustworthy daily bloom labels was difficult. Environmental sensors measure indicators such as chlorophyll and phycocyanin fluorescence, but a pigment spike alone does not prove that a harmful bloom occurred.
To create an experimental training dataset, we built an offline labeling workflow using the OpenAI Decisions API. For each daily USGS feature row, the API answered a structured bloom or no-bloom question using sensor measurements and supporting context.
The labeling instructions required decisions to be cross-referenced with:
- Wisconsin DNR public harmful algal bloom reports
- Wisconsin DNR beach advisories
- Green Bay and Fox River cyanobacteria updates
- Nearby ESP microcystin field-monitoring samples when available
The workflow was intentionally conservative: it favored periods supported by Wisconsin DNR reporting over isolated sensor spikes. Fluorescence and microcystin context were treated as supporting evidence, not automatic confirmation of a bloom or toxin hazard.
We used the resulting dataset to train a logistic-regression model. Live probability requests use the saved model artifact; they do not call OpenAI at runtime.
X-Ray the Bay
Alongside the station pipeline, we built X-Ray the Bay, a spatial water-quality research workflow based on real USGS FLAMe research-vessel measurements.
We evaluated the model using a hide, predict, reveal process:
- Hide part of a real boat-survey track.
- Train the model using the remaining measurements.
- Predict conditions along the hidden section.
- Reveal the withheld measurements.
- Compare the estimates with what was actually observed.
Our satellite worker processes recent Sentinel-2 L2A imagery, applies water and quality masks, and runs a random-forest model trained on FLAMe measurements. The resulting layers show:
- Estimated chlorophyll fluorescence
- Satellite reflectance
- Areas outside the model’s training support
- Satellite acquisition age
- Point-level values and source information
We use Leaflet to make these maps interactive. Because the live map transfers a model trained on historical field data to newer satellite scenes, we clearly label it as experimental rather than presenting it as a validated bloom forecast.
Evidence-backed AI
FoxWatch uses the Gemini API for environmental explanations and follow-up suggestions. Before Gemini receives a question, our retrieval pipeline finds relevant scientific passages and observations.
Generated responses are constrained to the supplied evidence. If Gemini is unavailable or its citations fail validation, FoxWatch returns a deterministic evidence-based fallback rather than an unsupported answer.
Infrastructure and deployment
Each technology supports a specific part of the platform:
- Tiger Data: Stores environmental observations and pgvector scientific-document embeddings.
- Vultr: Runs satellite processing and stores generated map images, manifests, and prediction samples.
- DigitalOcean: Hosts the React frontend and FastAPI backend.
- GoDaddy: Provides DNS for our custom domain.
- Google Gemini: Produces optional evidence-grounded explanations.
- OpenAI Decisions API: Supports offline experimental training-data labeling.
- Docker and Docker Hub: Package and distribute our services.
- GitHub Actions: Automates image builds and deployment steps.
This separation allows data ingestion, analysis, satellite processing, and visualization to operate independently while still contributing to one user experience.
Challenges we ran into
Our biggest challenge was finding trustworthy bloom labels. Government agencies publish extensive measurements, imagery, reports, and advisories, but they do not provide a simple daily bloom or no-bloom dataset for our monitoring station.
A pigment spike can indicate biological activity without proving that a harmful bloom occurred. We addressed this with a conservative experimental labeling process using the OpenAI Decisions API, USGS measurements, Wisconsin DNR reporting, and nearby field-monitoring context. Even with these safeguards, independent field validation is still necessary.
Another challenge was combining sources collected on different schedules. The dashboard may refresh every 15 seconds, but that does not mean every measurement is new. USGS sensors, weather data, nutrient samples, and satellites all operate on different timelines. We preserved their actual timestamps and made stale or missing evidence visible.
Satellite processing created additional challenges:
- Clouds and missing pixels
- Sun glint
- Shoreline contamination
- Differences between seasons
- Areas outside the model’s training coverage
Producing a colorful map was relatively easy. Making sure users could see where that map was uncertain was much harder and more important.
Finally, connecting ingestion, inference, mapping, retrieval, human review, and several cloud platforms required every component to agree on measurement units, timestamps, model versions, and output formats.
Accomplishments that we're proud of
- Connected real USGS observations to a working dashboard and continuous ingestion pipeline.
- Built a repeatable offline labeling workflow using the OpenAI Decisions API.
- Cross-referenced experimental labels with Wisconsin DNR bloom reports, beach advisories, and local field-monitoring context.
- Trained and deployed a traditional machine-learning bloom probability model.
- Built X-Ray the Bay using satellite imagery and real USGS boat-survey measurements.
- Evaluated spatial reconstruction against measurements withheld from model training.
- Made satellite age, model support, extrapolation, and other limitations visible in the interface.
- Built a Bloom Favorability Index that explains how individual environmental drivers affect the result.
- Integrated source-backed Gemini explanations with citation validation and non-generative fallbacks.
- Created an analyst-feedback workflow that can use human corrections to refit the station model.
- Deployed the frontend, API, database, satellite worker, object storage, and custom domain using sponsor technologies.
- Brought measurements, predictions, research, and explanations together into one experience.
We are especially proud that users can move from seeing a prediction to inspecting the observations and research behind it.
What we learned
Having environmental data is not the same as having confirmed bloom evidence.
We learned to clearly separate:
- What was directly measured
- What was estimated by a model
- What was generated as an explanation
- What remains unknown
We also learned that model accuracy depends heavily on label quality. Historical performance does not automatically establish reliability under current conditions, during another season, or in another watershed.
Spatial validation requires more than randomly splitting nearby measurements. Withholding geographically distinct boat-survey segments gave us a more realistic view of how the model performs in areas it has not seen.
We learned that explainability is most useful when users can inspect the underlying evidence themselves. AI-generated environmental explanations need retrieved sources, citation checks, visible limitations, and safe fallback behavior.
Building FoxWatch gave us practical experience with time-series data, machine learning, geospatial analysis, satellite processing, retrieval-augmented generation, cloud infrastructure, deployment automation, and human-in-the-loop review.
Most importantly, we learned that communicating uncertainty is not a weakness. It is essential when building tools that help people understand environmental conditions.
What's next for FoxWatch
We want to strengthen FoxWatch’s local reliability before expanding across Lake Michigan and eventually the other Great Lakes.
Our next steps include:
- Validating predictions against independently confirmed field observations and laboratory measurements.
- Improving training and inference consistency.
- Improving the handling and display of stale measurements.
- Adding historical timelines and before-and-after satellite comparisons.
- Evaluating the satellite model across additional seasons and FLAMe survey campaigns.
- Improving cloud, glint, shoreline, and water-quality screening.
- Expanding coverage to additional monitoring stations.
- Using analyst feedback to improve future training datasets and model versions.
- Calibrating uncertainty and model-support estimates.
- Partnering with environmental researchers and agencies for scientific evaluation.
- Investigating forecasting and alerts only after their reliability has been demonstrated.
Our long-term goal is to help communities manage their waterways more proactively through accessible measurements, visual evidence, scientific context, and understandable explanations.
Built With
- ci/cd
- devops
- digitalocean
- fastapi
- gemini
- godaddy
- ml
- python
- react
- tigerdata
- typescript
- vultr

Log in or sign up for Devpost to join the conversation.