-
-
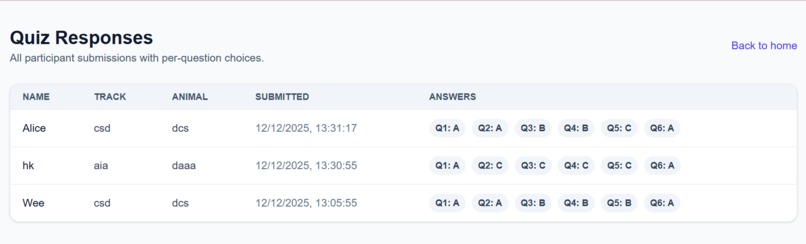
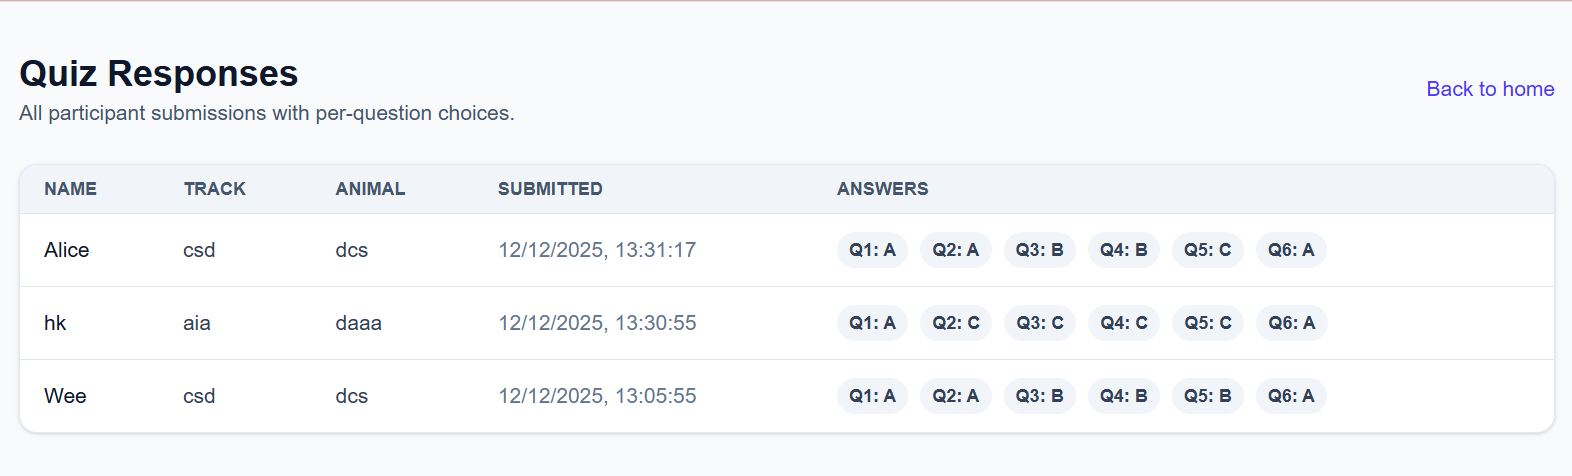
Responses View
-

Sorting Quiz
-

Statistic Panel
-
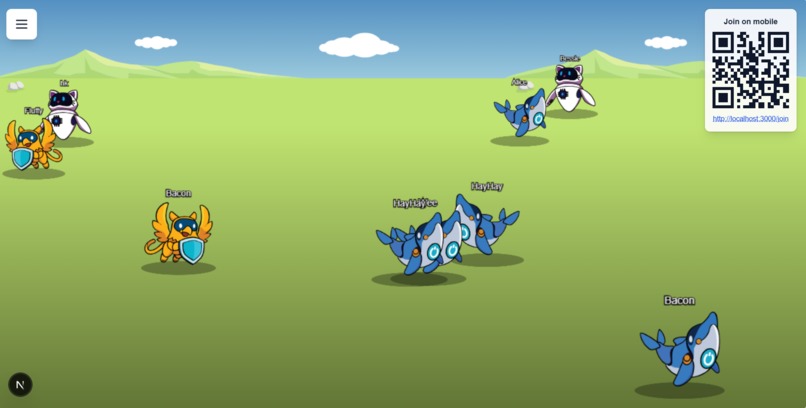
Live Big Screen Polling
-
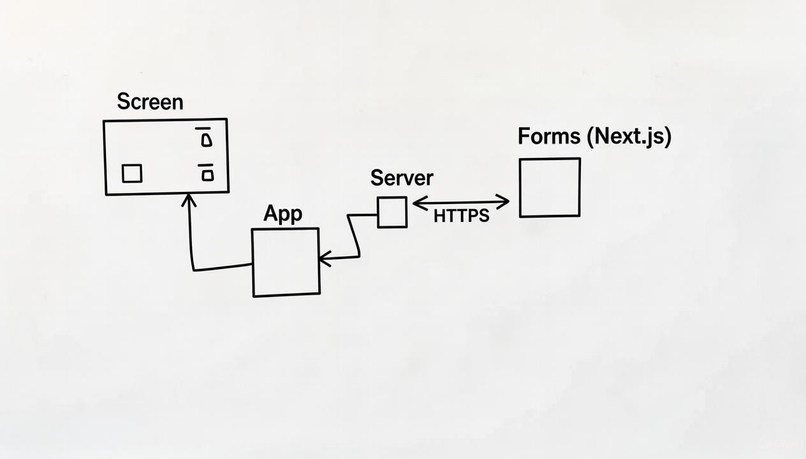
System Diagram

💡 Inspiration
While students wait for the Showcase to begin, we aim to keep them engaged with meaningful conversations and activities. This is a great opportunity for the School of Computing (SoC) to understand which courses they are interested in and better support their learning journey.
Ultimately, we hope to:
- Inspire more secondary school students to consider joining SoC.
- Help them explore their strengths and understand their options.
- Guide them to choose the course that best fits their goals and passions.
🚀 What it does: The FourSight Experience
FourSight: Farm Animal Scene is a full-stack interactive activity that serves as both an engaging Showcase center-piece and a powerful data collection tool.
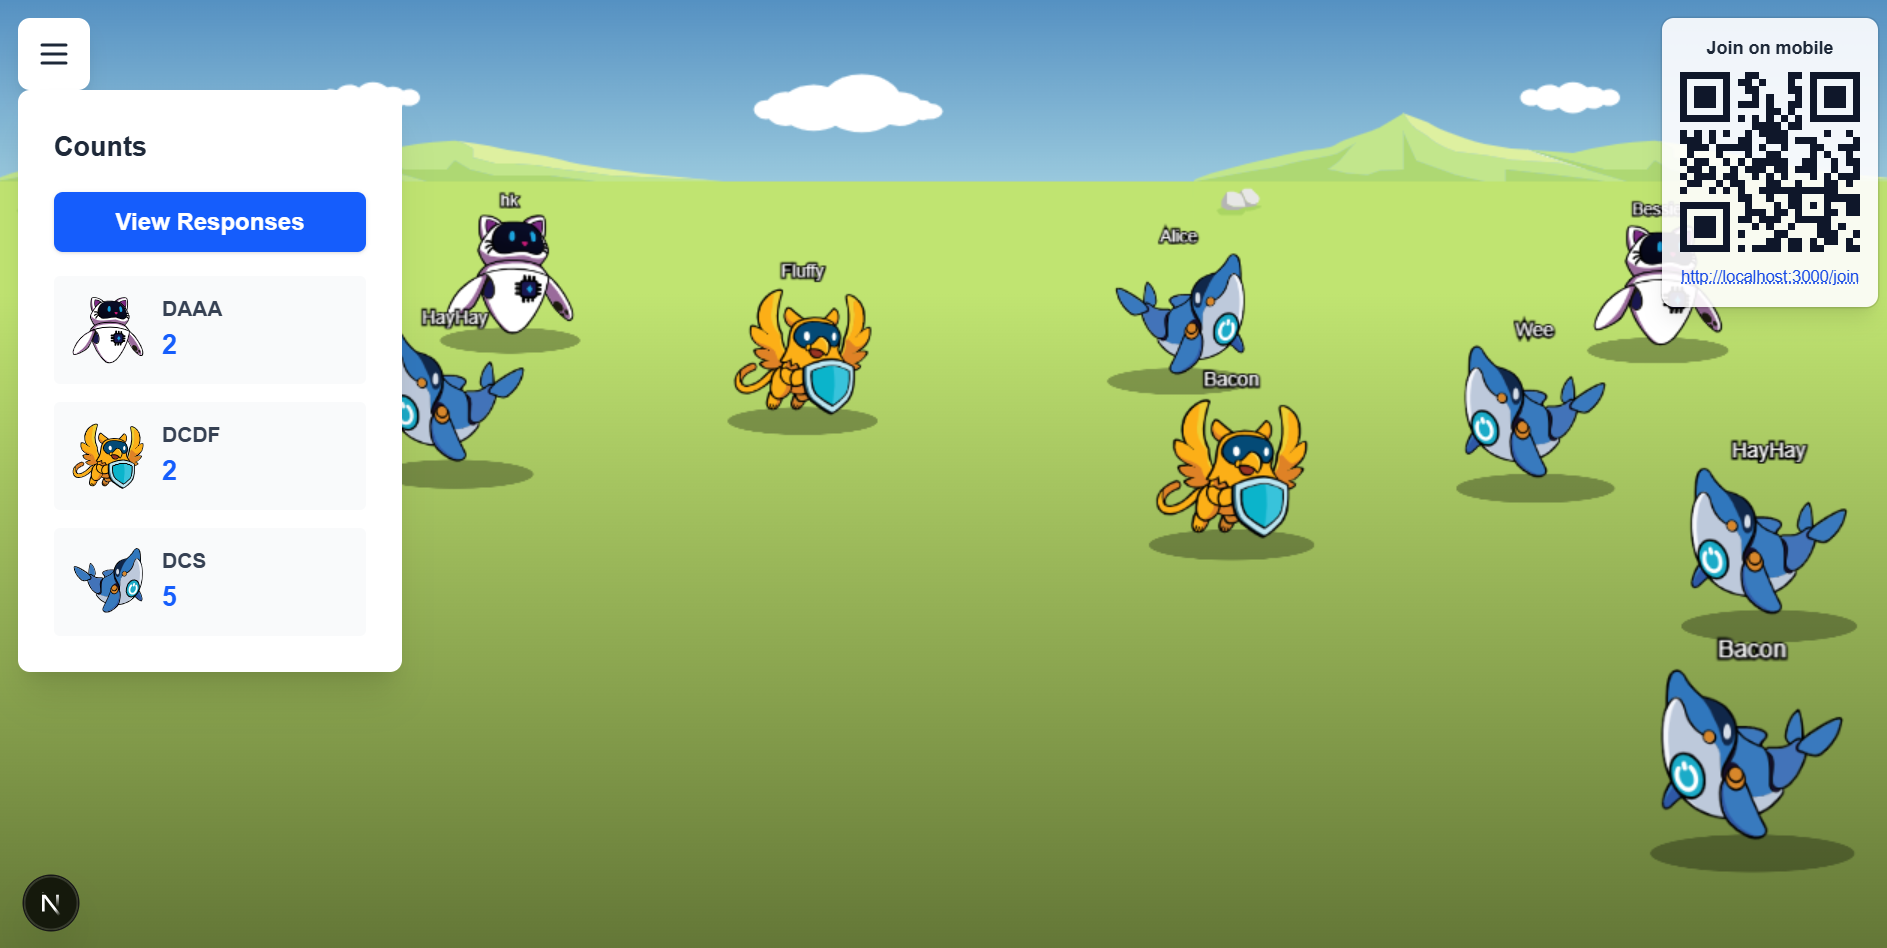
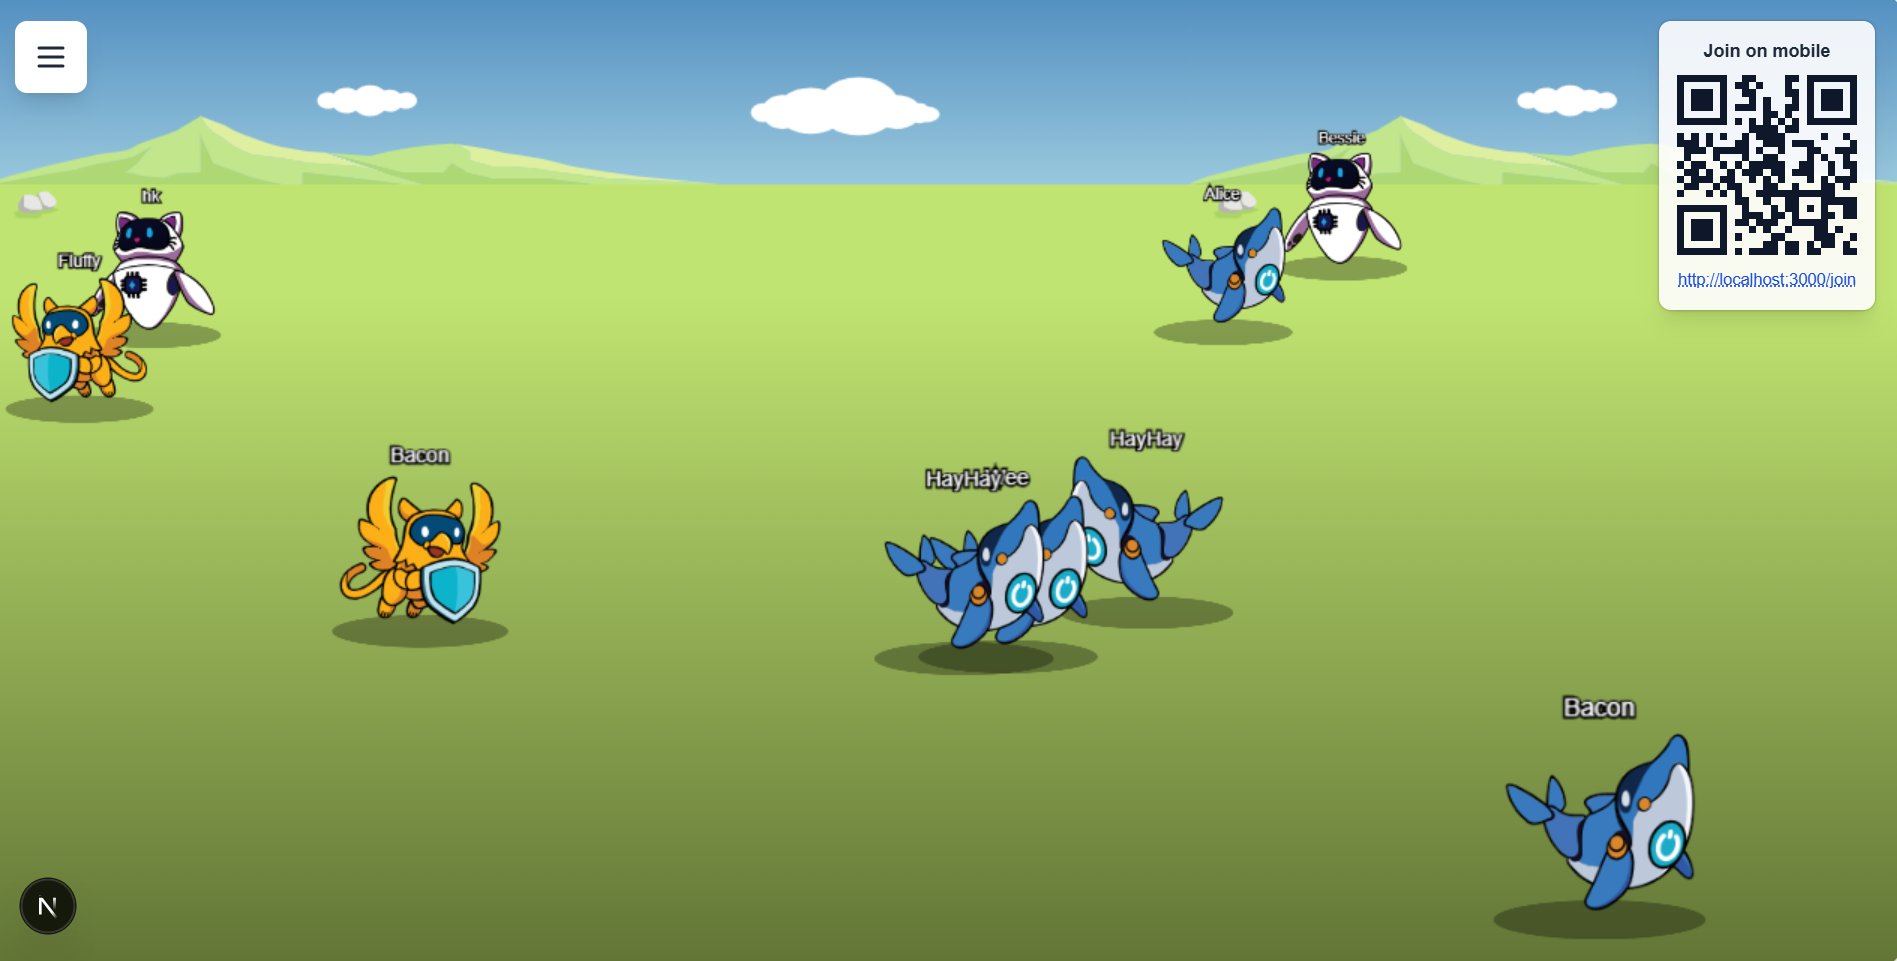
1. The Interactive big Screen Polling (Main Page /)
This is the "SoC Live" component, providing a collective, energetic atmosphere.
- PixiJS Animation: Features a 2D WebGL-rendered farm scene with smooth animations.
- Real-Time Data: The farm displays animated Course Characters that correspond to the three main SoC course tracks: DAAA, DCDF, and DCS.
- Live Counts Panel: A panel on the farm scene shows the real-time count of each animal type, reflecting live submissions from the quiz via a 30-second database polling mechanism.
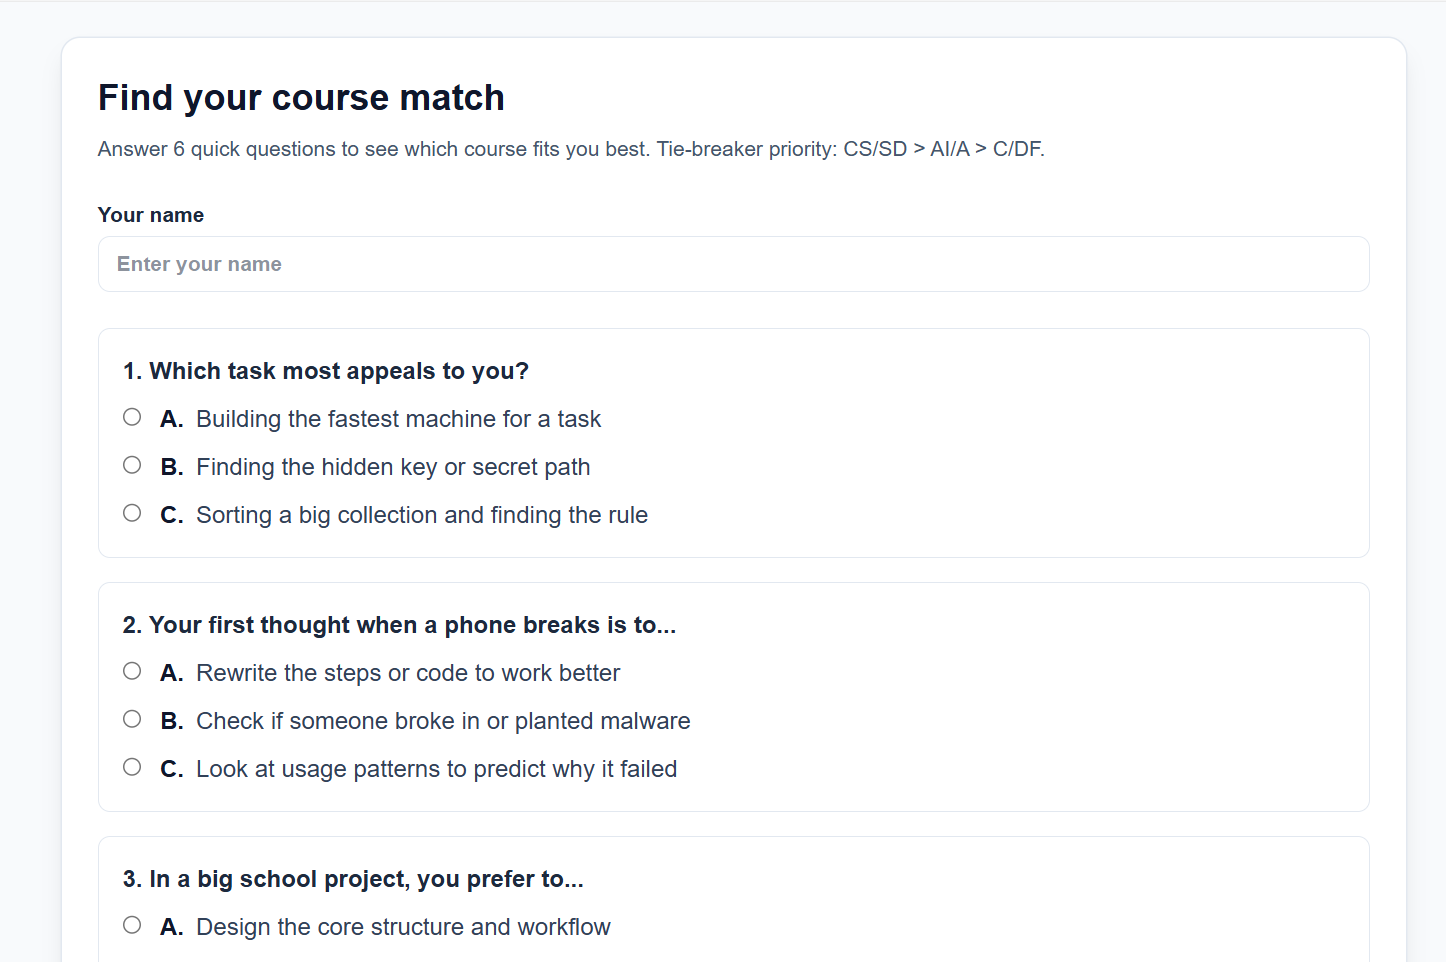
2. The "Tech Personality" Sorting Quiz (/join)
- Quiz Page: A 6-question multiple-choice quiz that determines a participant's preferred SoC track (Tech Personality).
- Smart Assignment: Participants are instantly assigned an animal (and thus a course track) based on a custom scoring and tie-breaker logic.
- Data Persistence: The full quiz response and per-question answers are immediately saved to a MySQL database.
3. The Responses Dashboard (/responses)
- Provides organizers with a live dashboard to view all quiz submissions, enabling immediate aggregate analysis of student interests.
💻 How we built it
This project is a high-performance full-stack application built with a robust architecture to handle real-time engagement and data persistence.
Frontend & Animation
- Next.js 16 (App Router): Provides the fast, modern framework for the application.
- PixiJS 8 (WebGL): Used for the interactive farm scene to achieve smooth, performant 2D animations and visual effects, including:
- Perspective Scaling: Animals lower on the screen appear larger (closer), and depth sorting handles realistic overlaps.
- Realistic Behaviors: Animals alternate between Idle and Walking States with random movement, direction changes, and boundary detection.
- SVG Sprites: Used for clean, scalable animal graphics.
Backend & Data
- MySQL Database: The relational database of choice for storing persistent data, including animals, quiz responses, and per-question answers.
- RESTful API Endpoints: Built into the Next.js App Router (
/api/animals,/api/responses,/api/animals/counts) to manage data and serve the frontend efficiently, supporting features like pagination. - mysql2: Used for efficient database interaction with connection pooling.
Development Workflow
- VScode + GitHub Copilot and Gemini: We leveraged AI assistants extensively for rapid prototyping, debugging, and content generation, significantly overcoming the challenge of the short timeline.
🚧 Challenges we ran into
Short of time was the primary challenge, necessitating heavy use of AI tools for rapid development. Specific technical hurdles included:
- Real-Time Polling: Ensuring the farm scene's animal counts panel refreshed reliably every 30 seconds without excessive load on the database.
- PixiJS Performance: Optimizing the layered depth rendering and perspective scaling to maintain a smooth frame rate across various devices.
- Quiz Logic: Developing and testing the complex scoring and tie-breaker logic to accurately match a student's responses to the most appropriate course track (DCS, DAAA, or DCDF).
✨ Accomplishments that we're proud of
- Full-Stack Data Integration: Successfully implementing a reliable MySQL database as the heart of the application, connecting the interactive front-end with persistent data storage.
- High-Fidelity Animation: Achieving realistic, engaging animal behaviors using PixiJS, including perspective scaling and complex random movement.
- Actionable Data Collection: Building a complete system (Quiz > Database > Dashboard) that delivers immediate, valuable insights to organizers about student interest in specific SoC courses.
- Robust Architecture: Establishing a clear project structure with dedicated API routes, database scripts, and a scalable Next.js framework.
🧠 What we learned
- The Synergy of Next.js and PixiJS: We learned how to effectively combine a modern React framework with a high-performance WebGL engine to deliver complex interactive experiences.
- The Value of Good Schema Design: A well-normalized MySQL schema was crucial for storing both aggregate (animal counts) and detailed (per-question answers) data efficiently.
- Efficiency Through AI: Our reliance on GitHub Copilot and Gemini proved indispensable for tackling the project's ambitious scope within the hackathon timeframe.
🚀 What's next for FourSight
- Enhance Gamification: Introduce elements like in-scene leaderboards or rare animal appearances based on total submission milestones.
- Admin Tools: Develop a more sophisticated admin dashboard to allow filtering quiz responses by time, aggregating scoring metrics, and exporting the data.
- Mobile Optimisation: Refine the PixiJS scene and UI to provide a perfectly seamless experience on mobile devices for the
/joinquiz page.
Built With
- good
- will


Log in or sign up for Devpost to join the conversation.