-
-
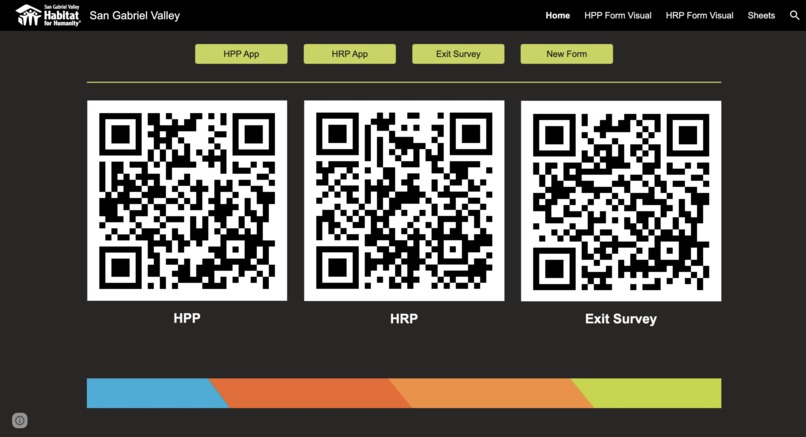
Home page with QR code to survey links
-
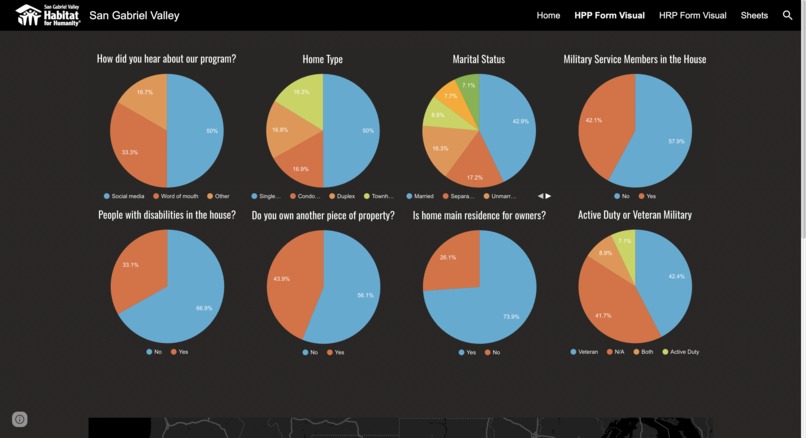
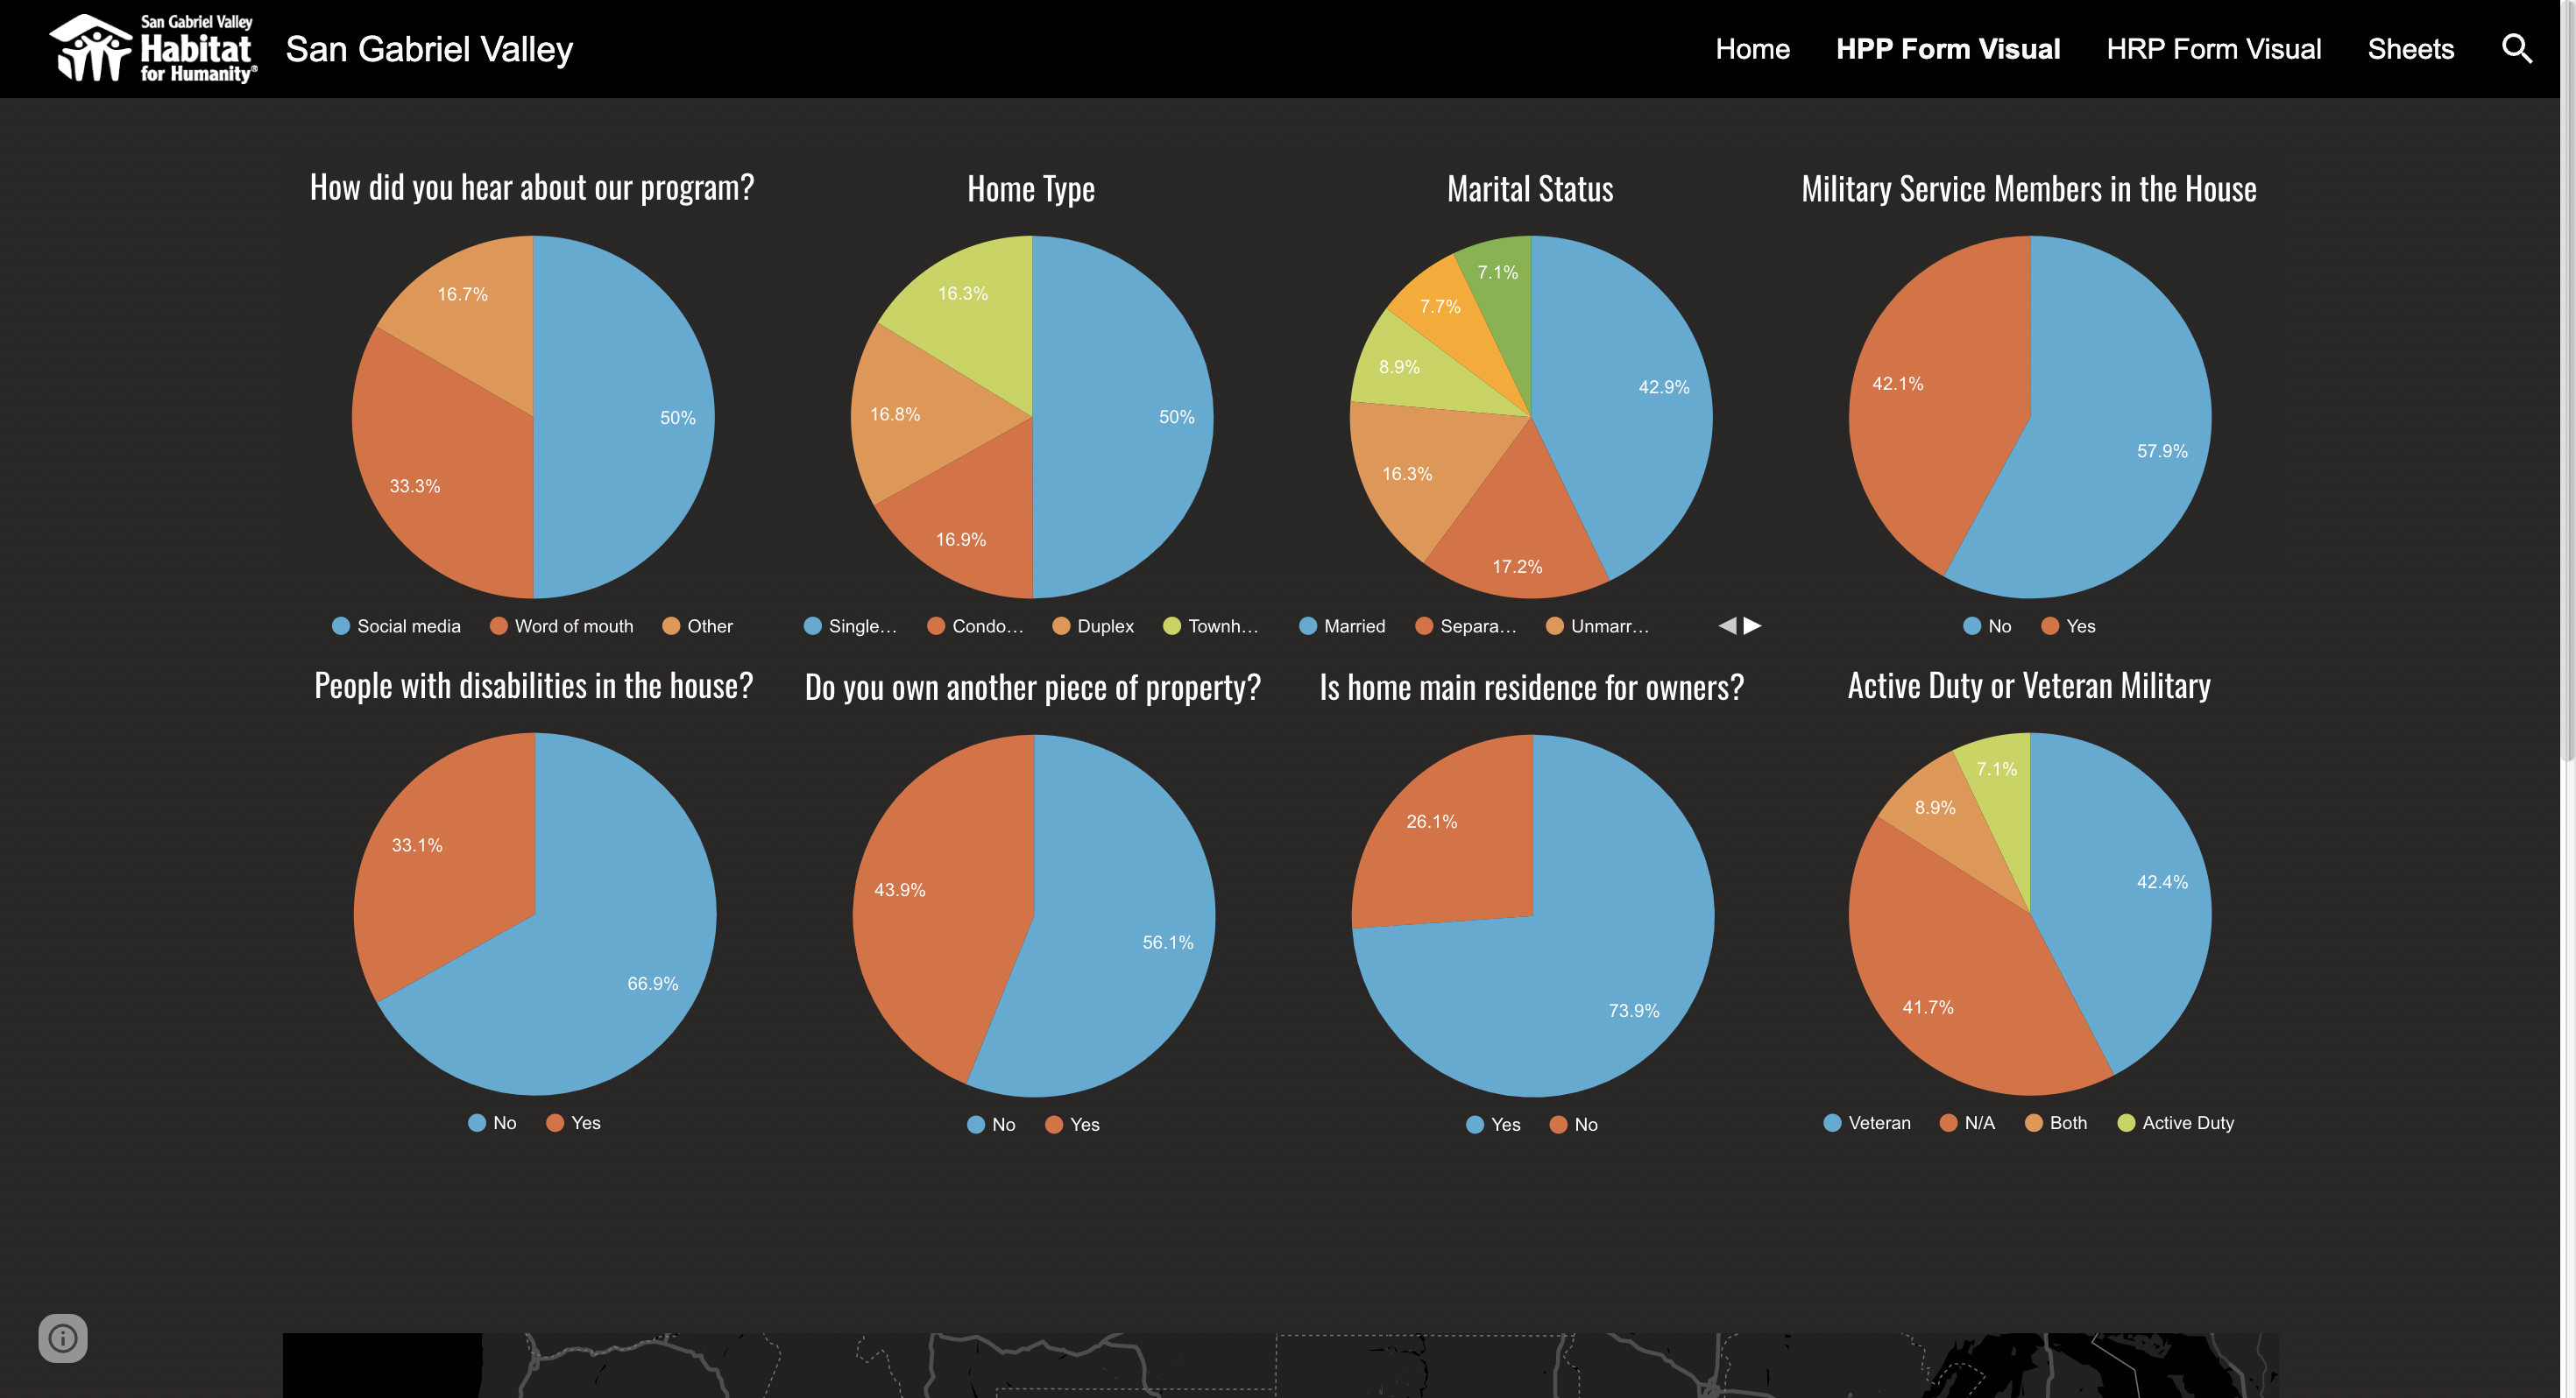
Home Preservation Program data visuals
-

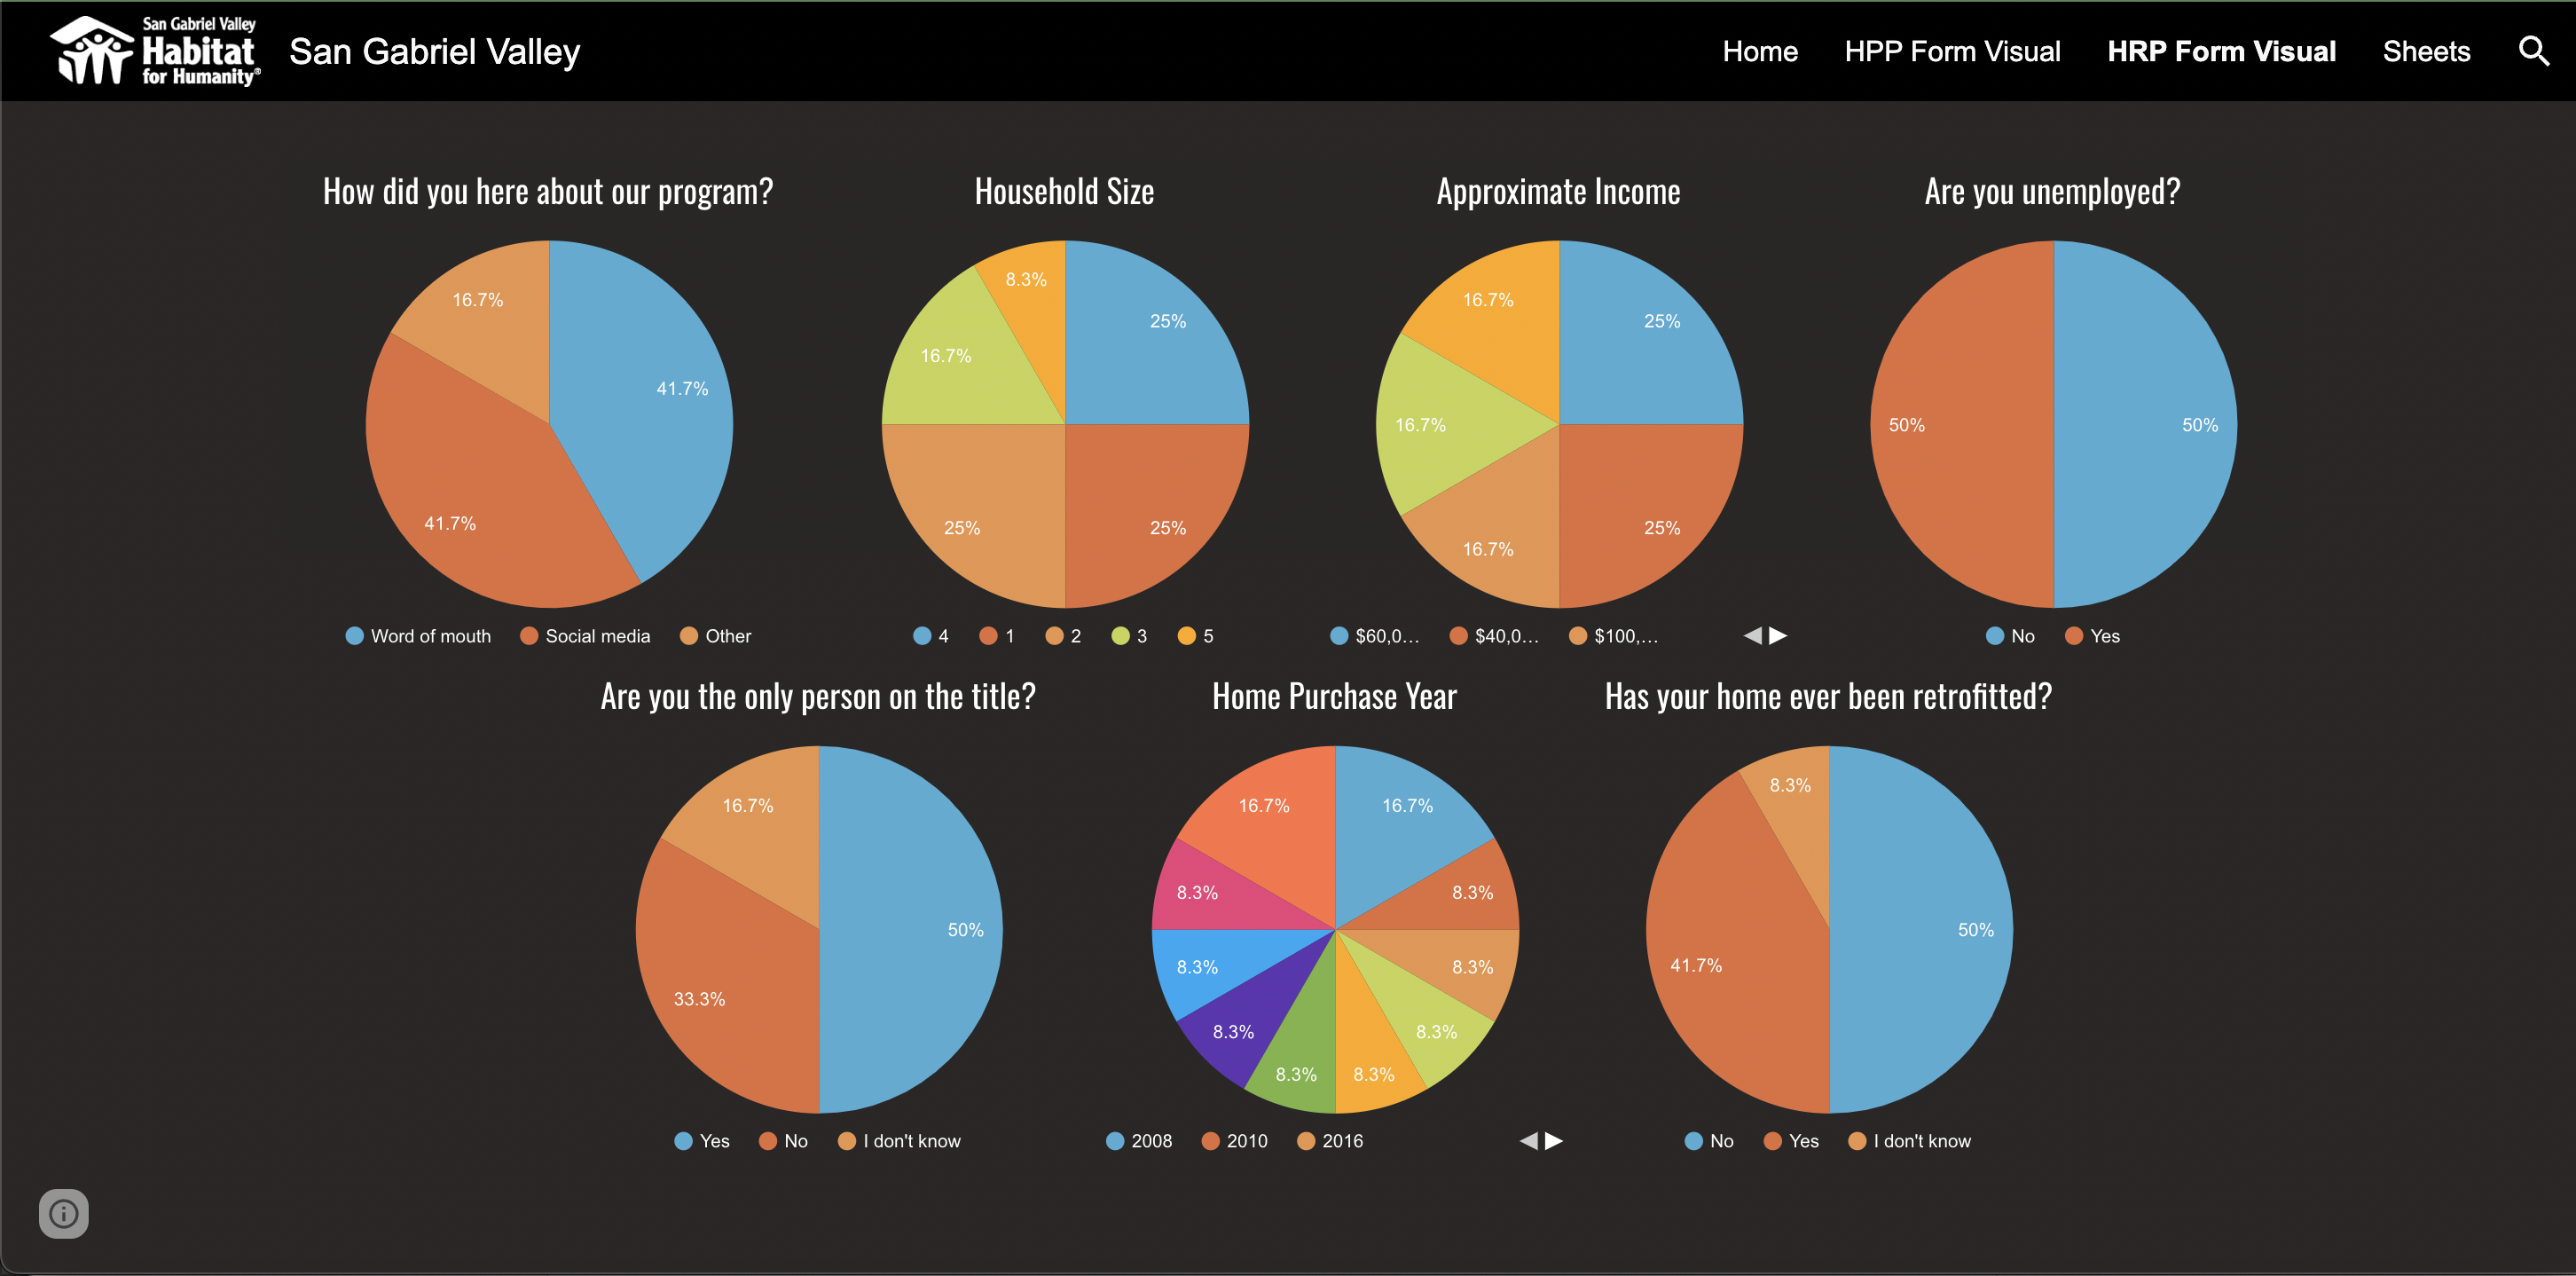
Home Repair Program data visuals
-
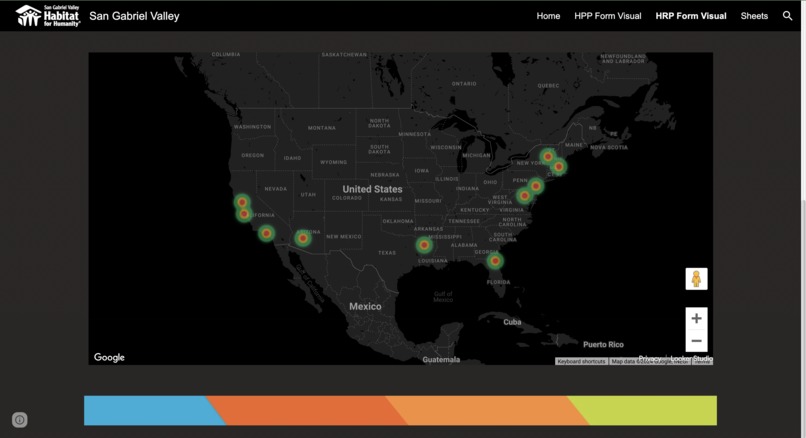
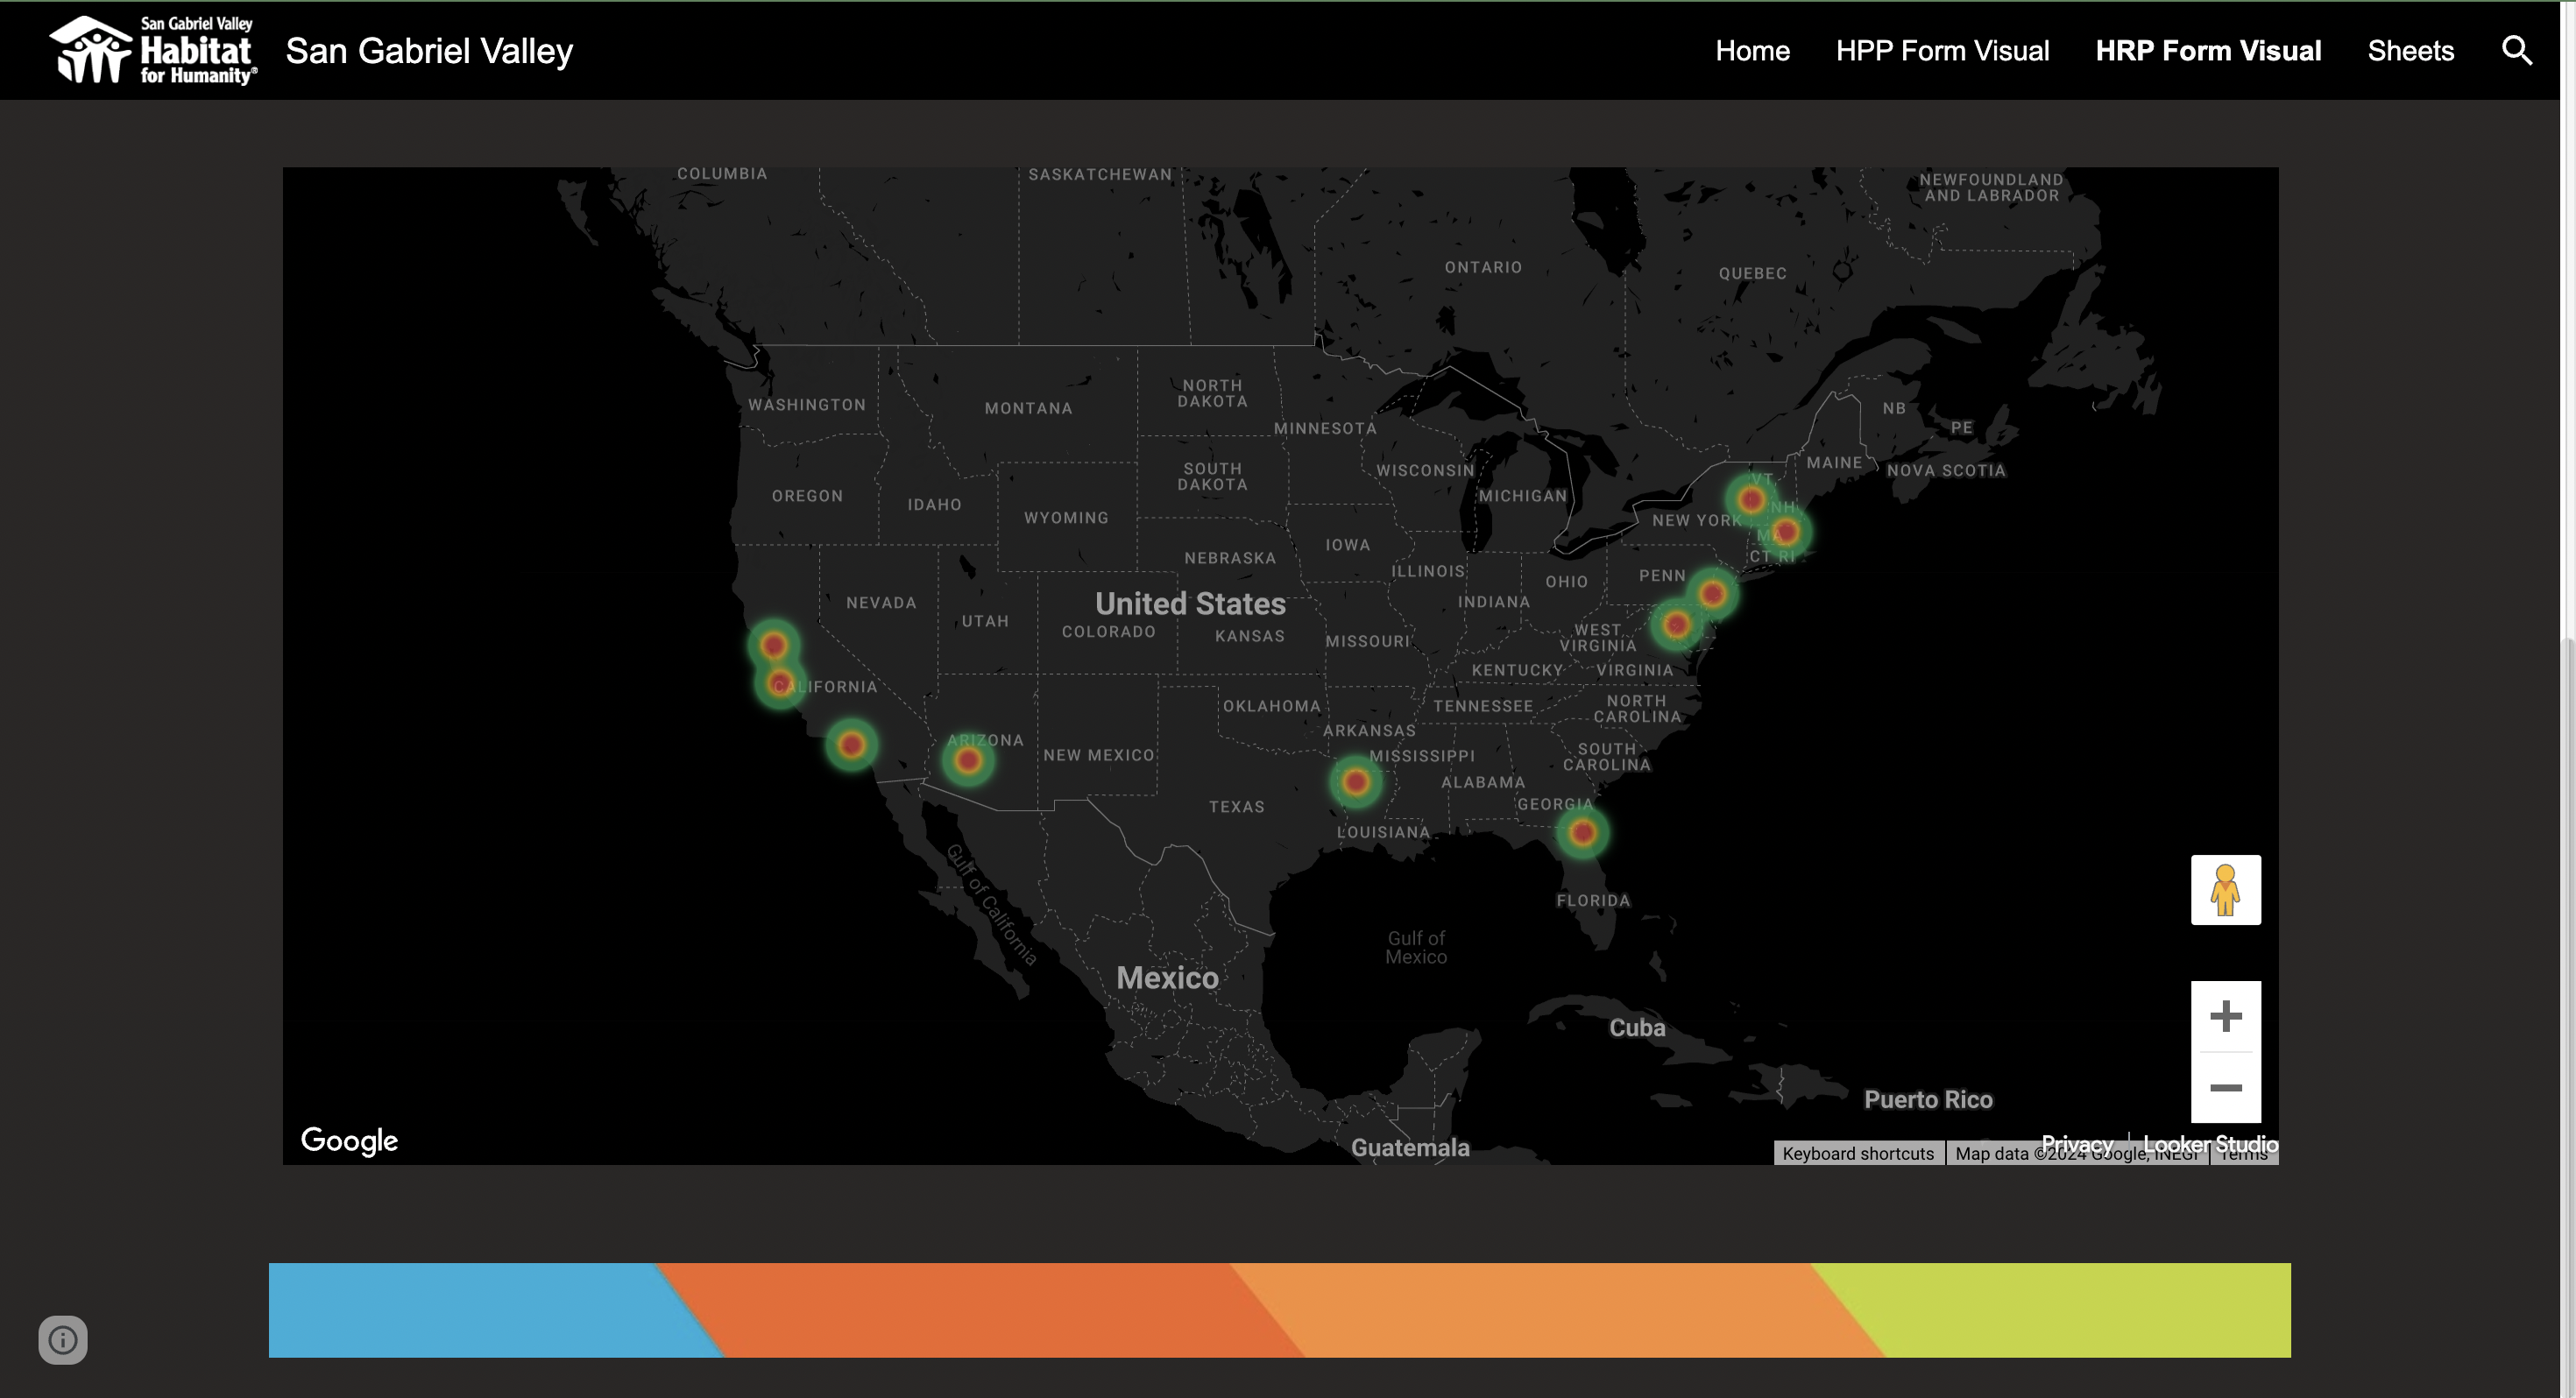
Geo-heatmap of survey responders by location
-
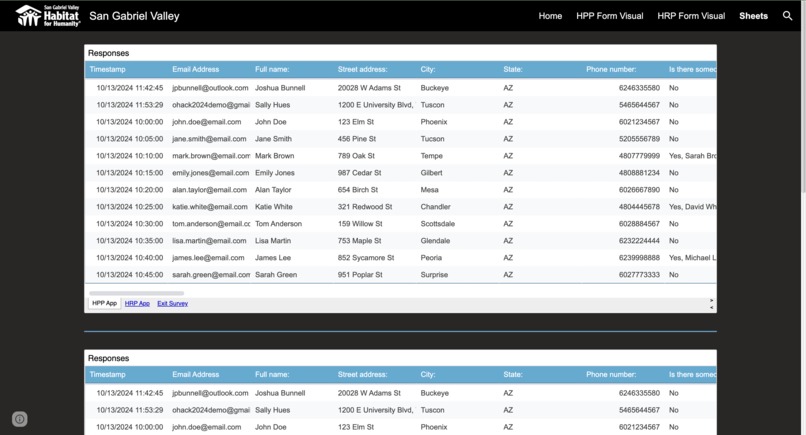
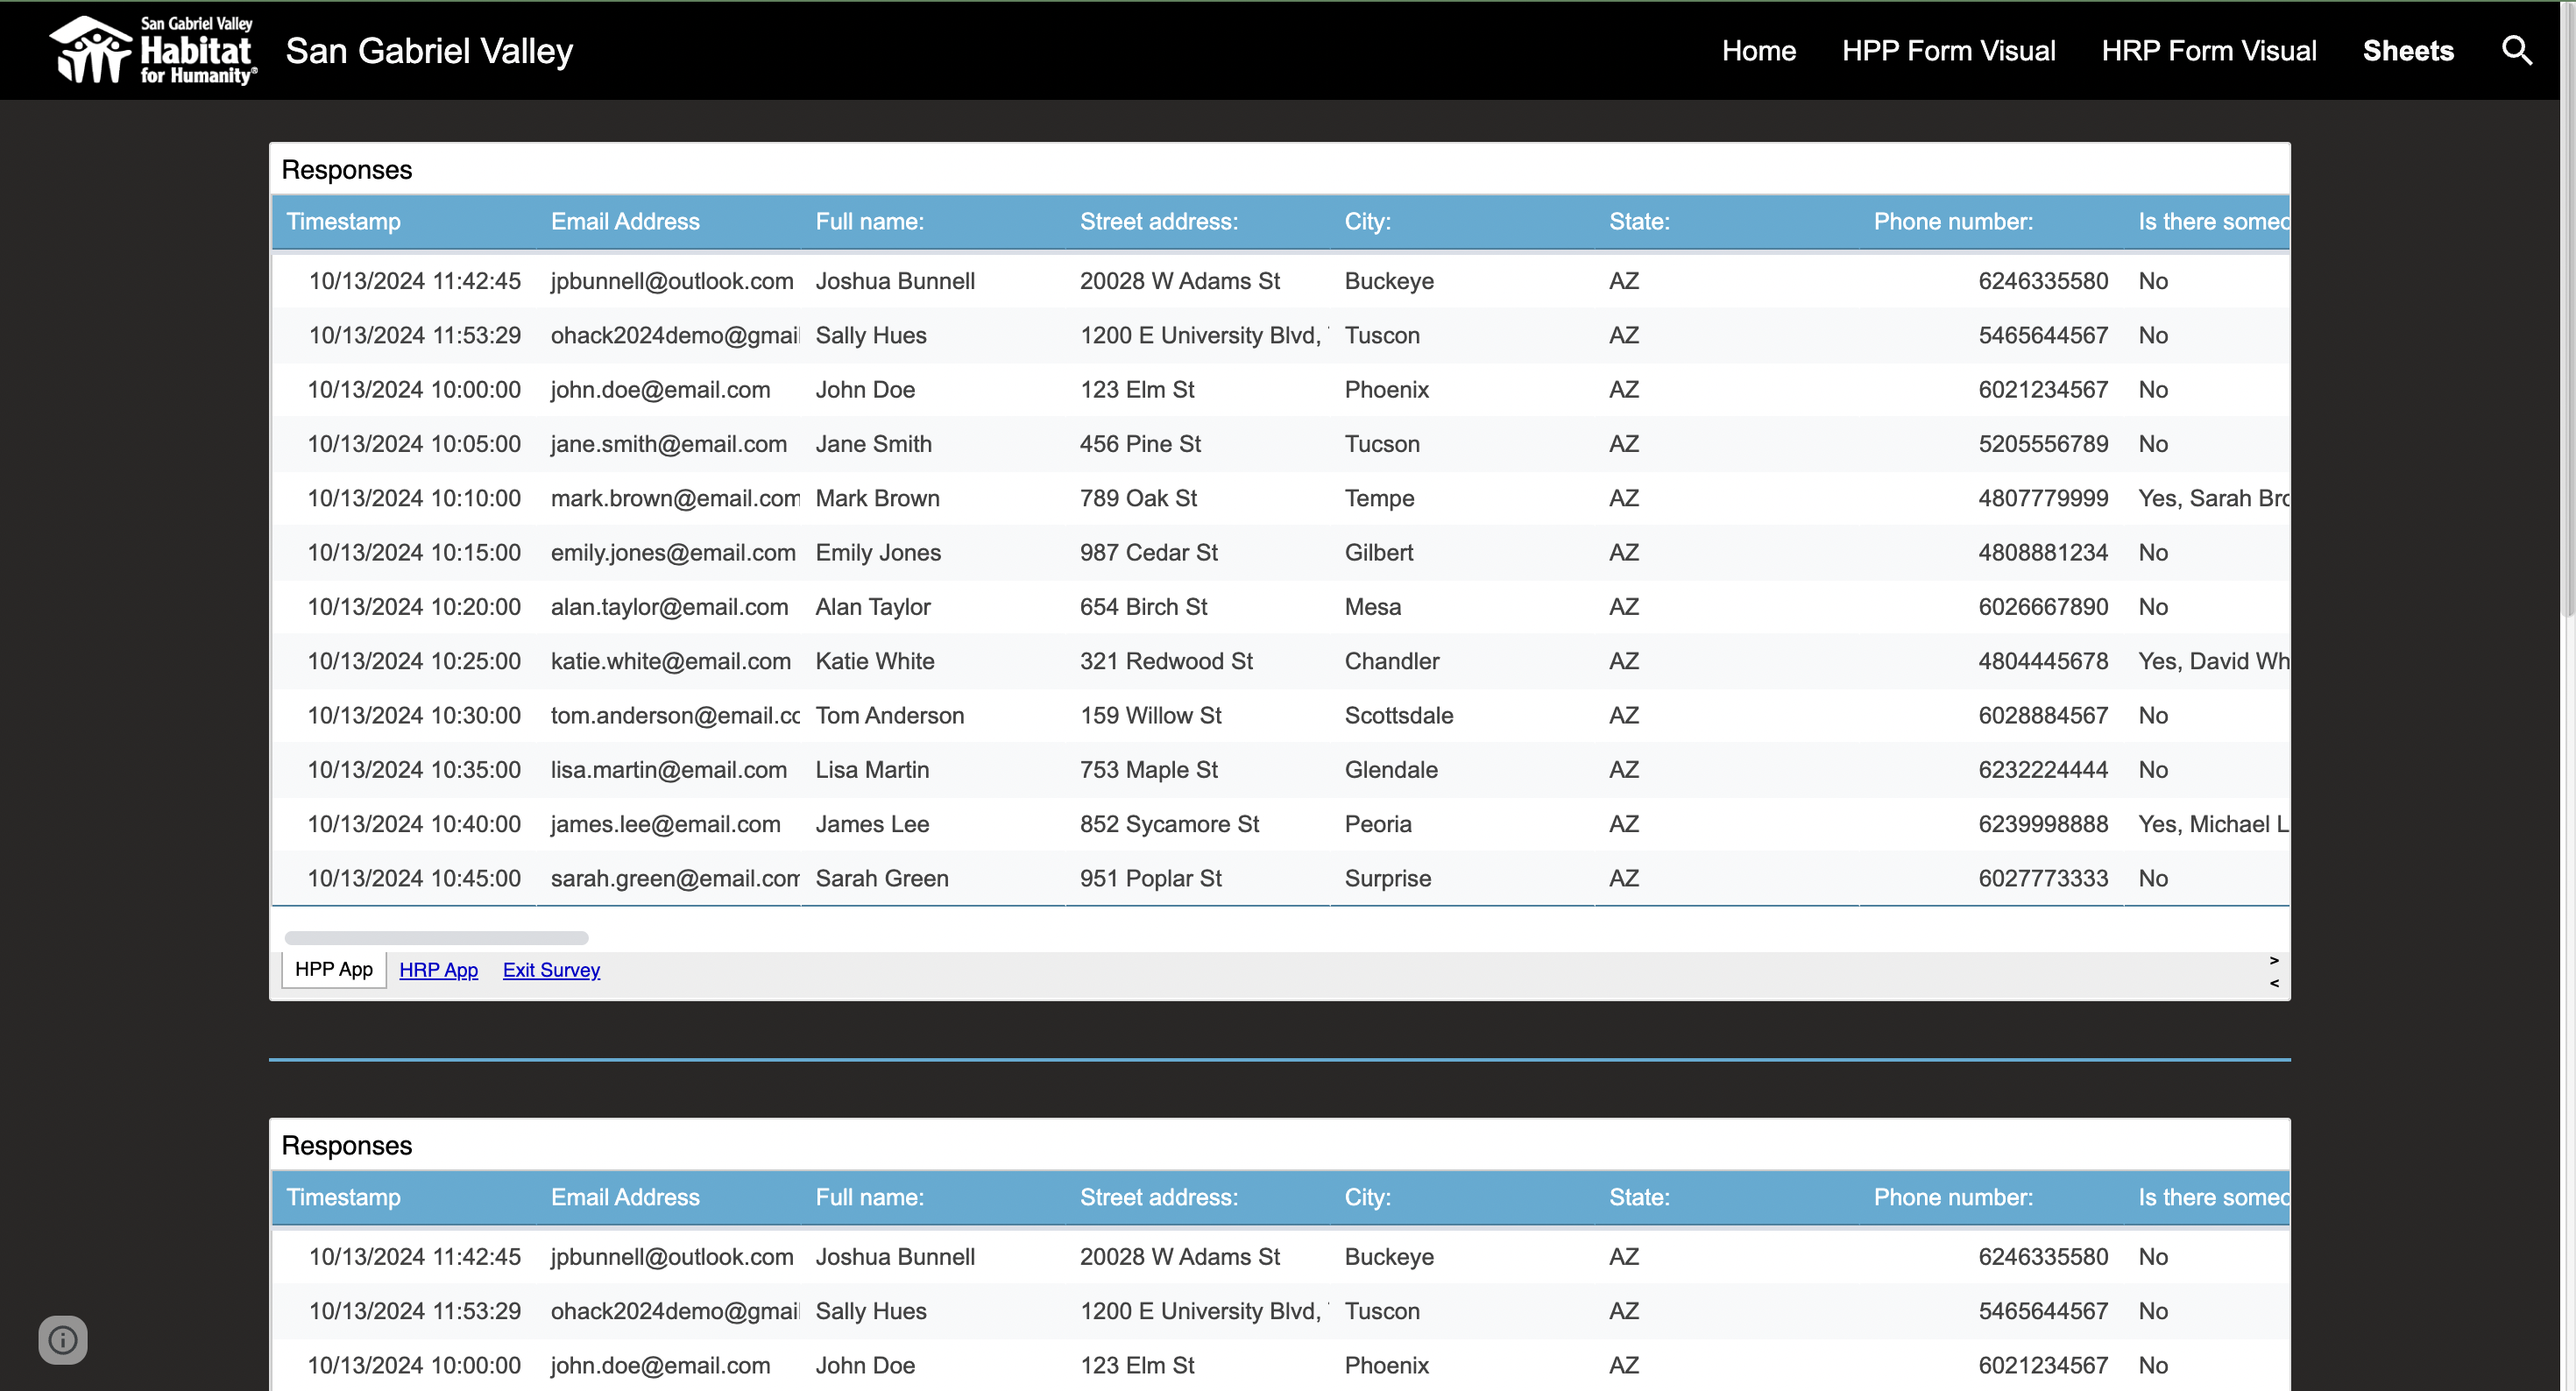
Google Sheets is embedded into website
-
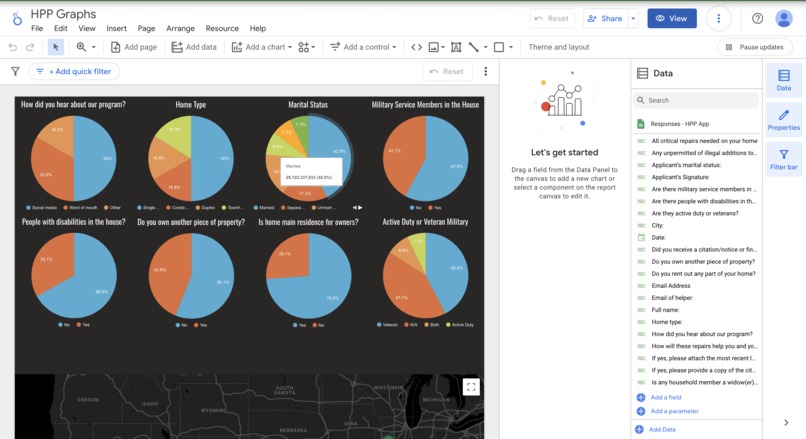
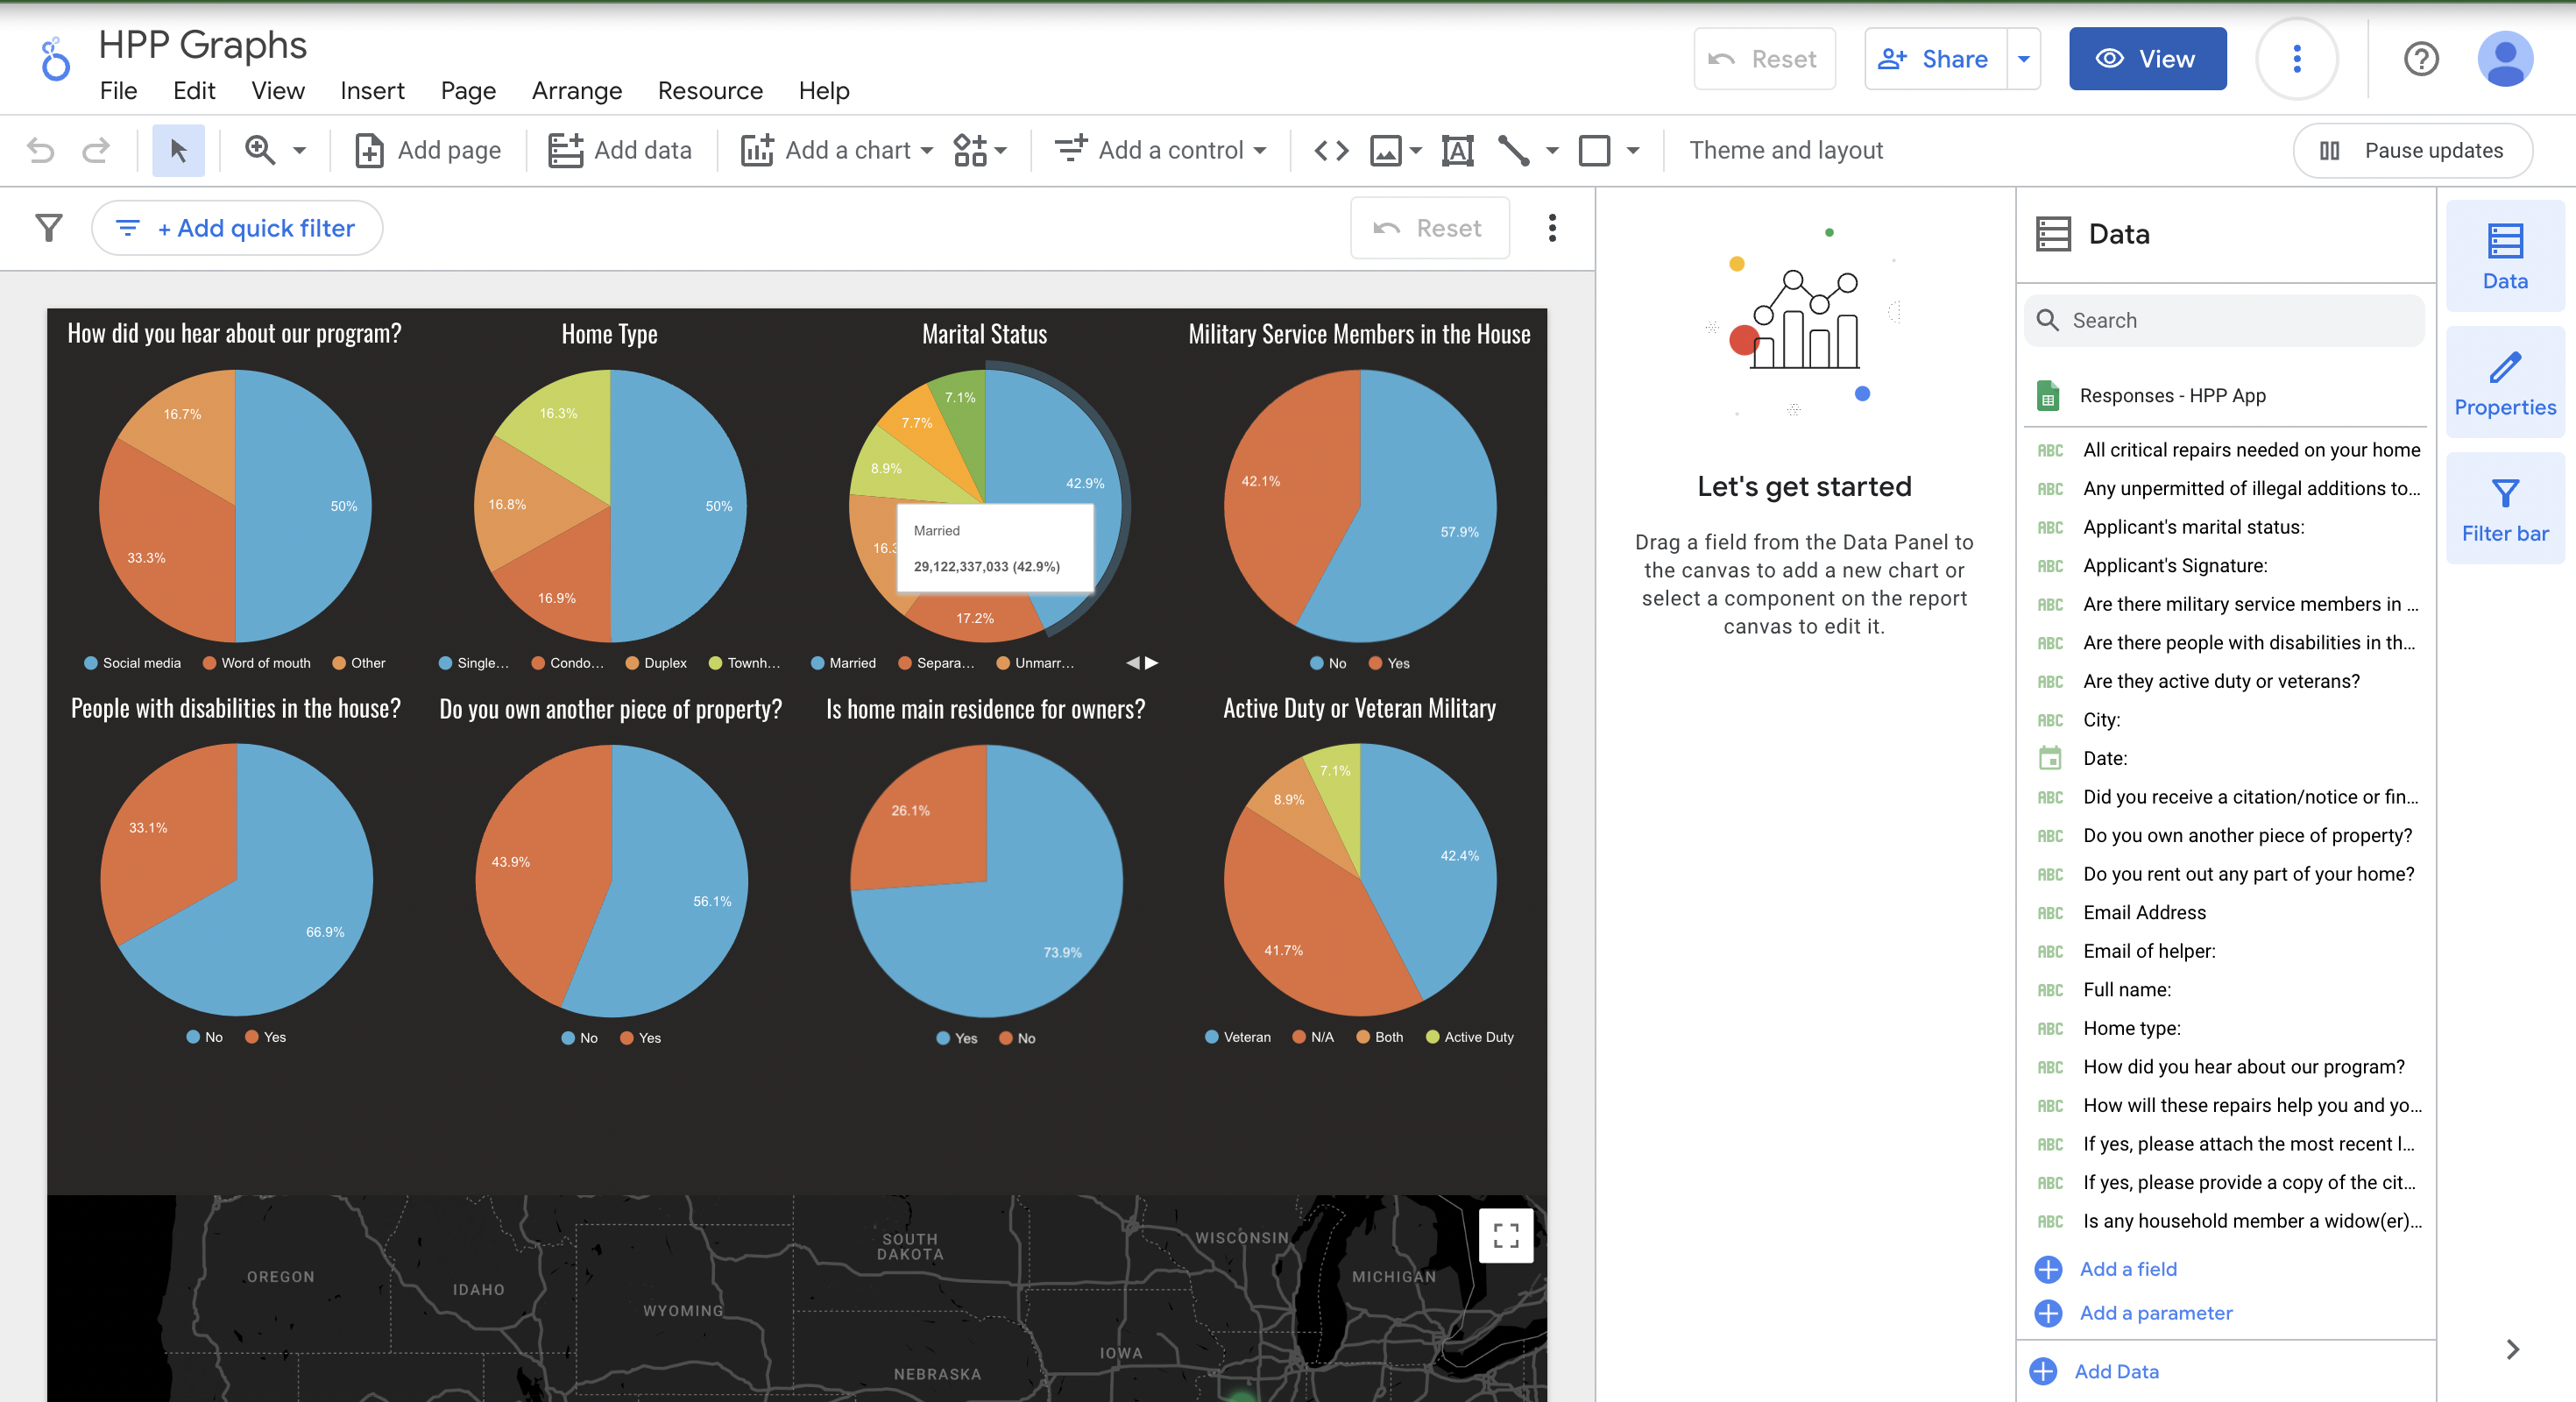
Looker Studio utilizes Google Sheets to create visuals
-
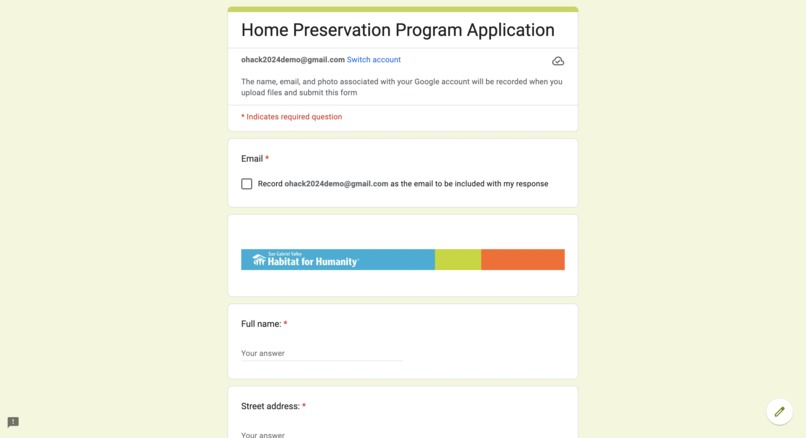
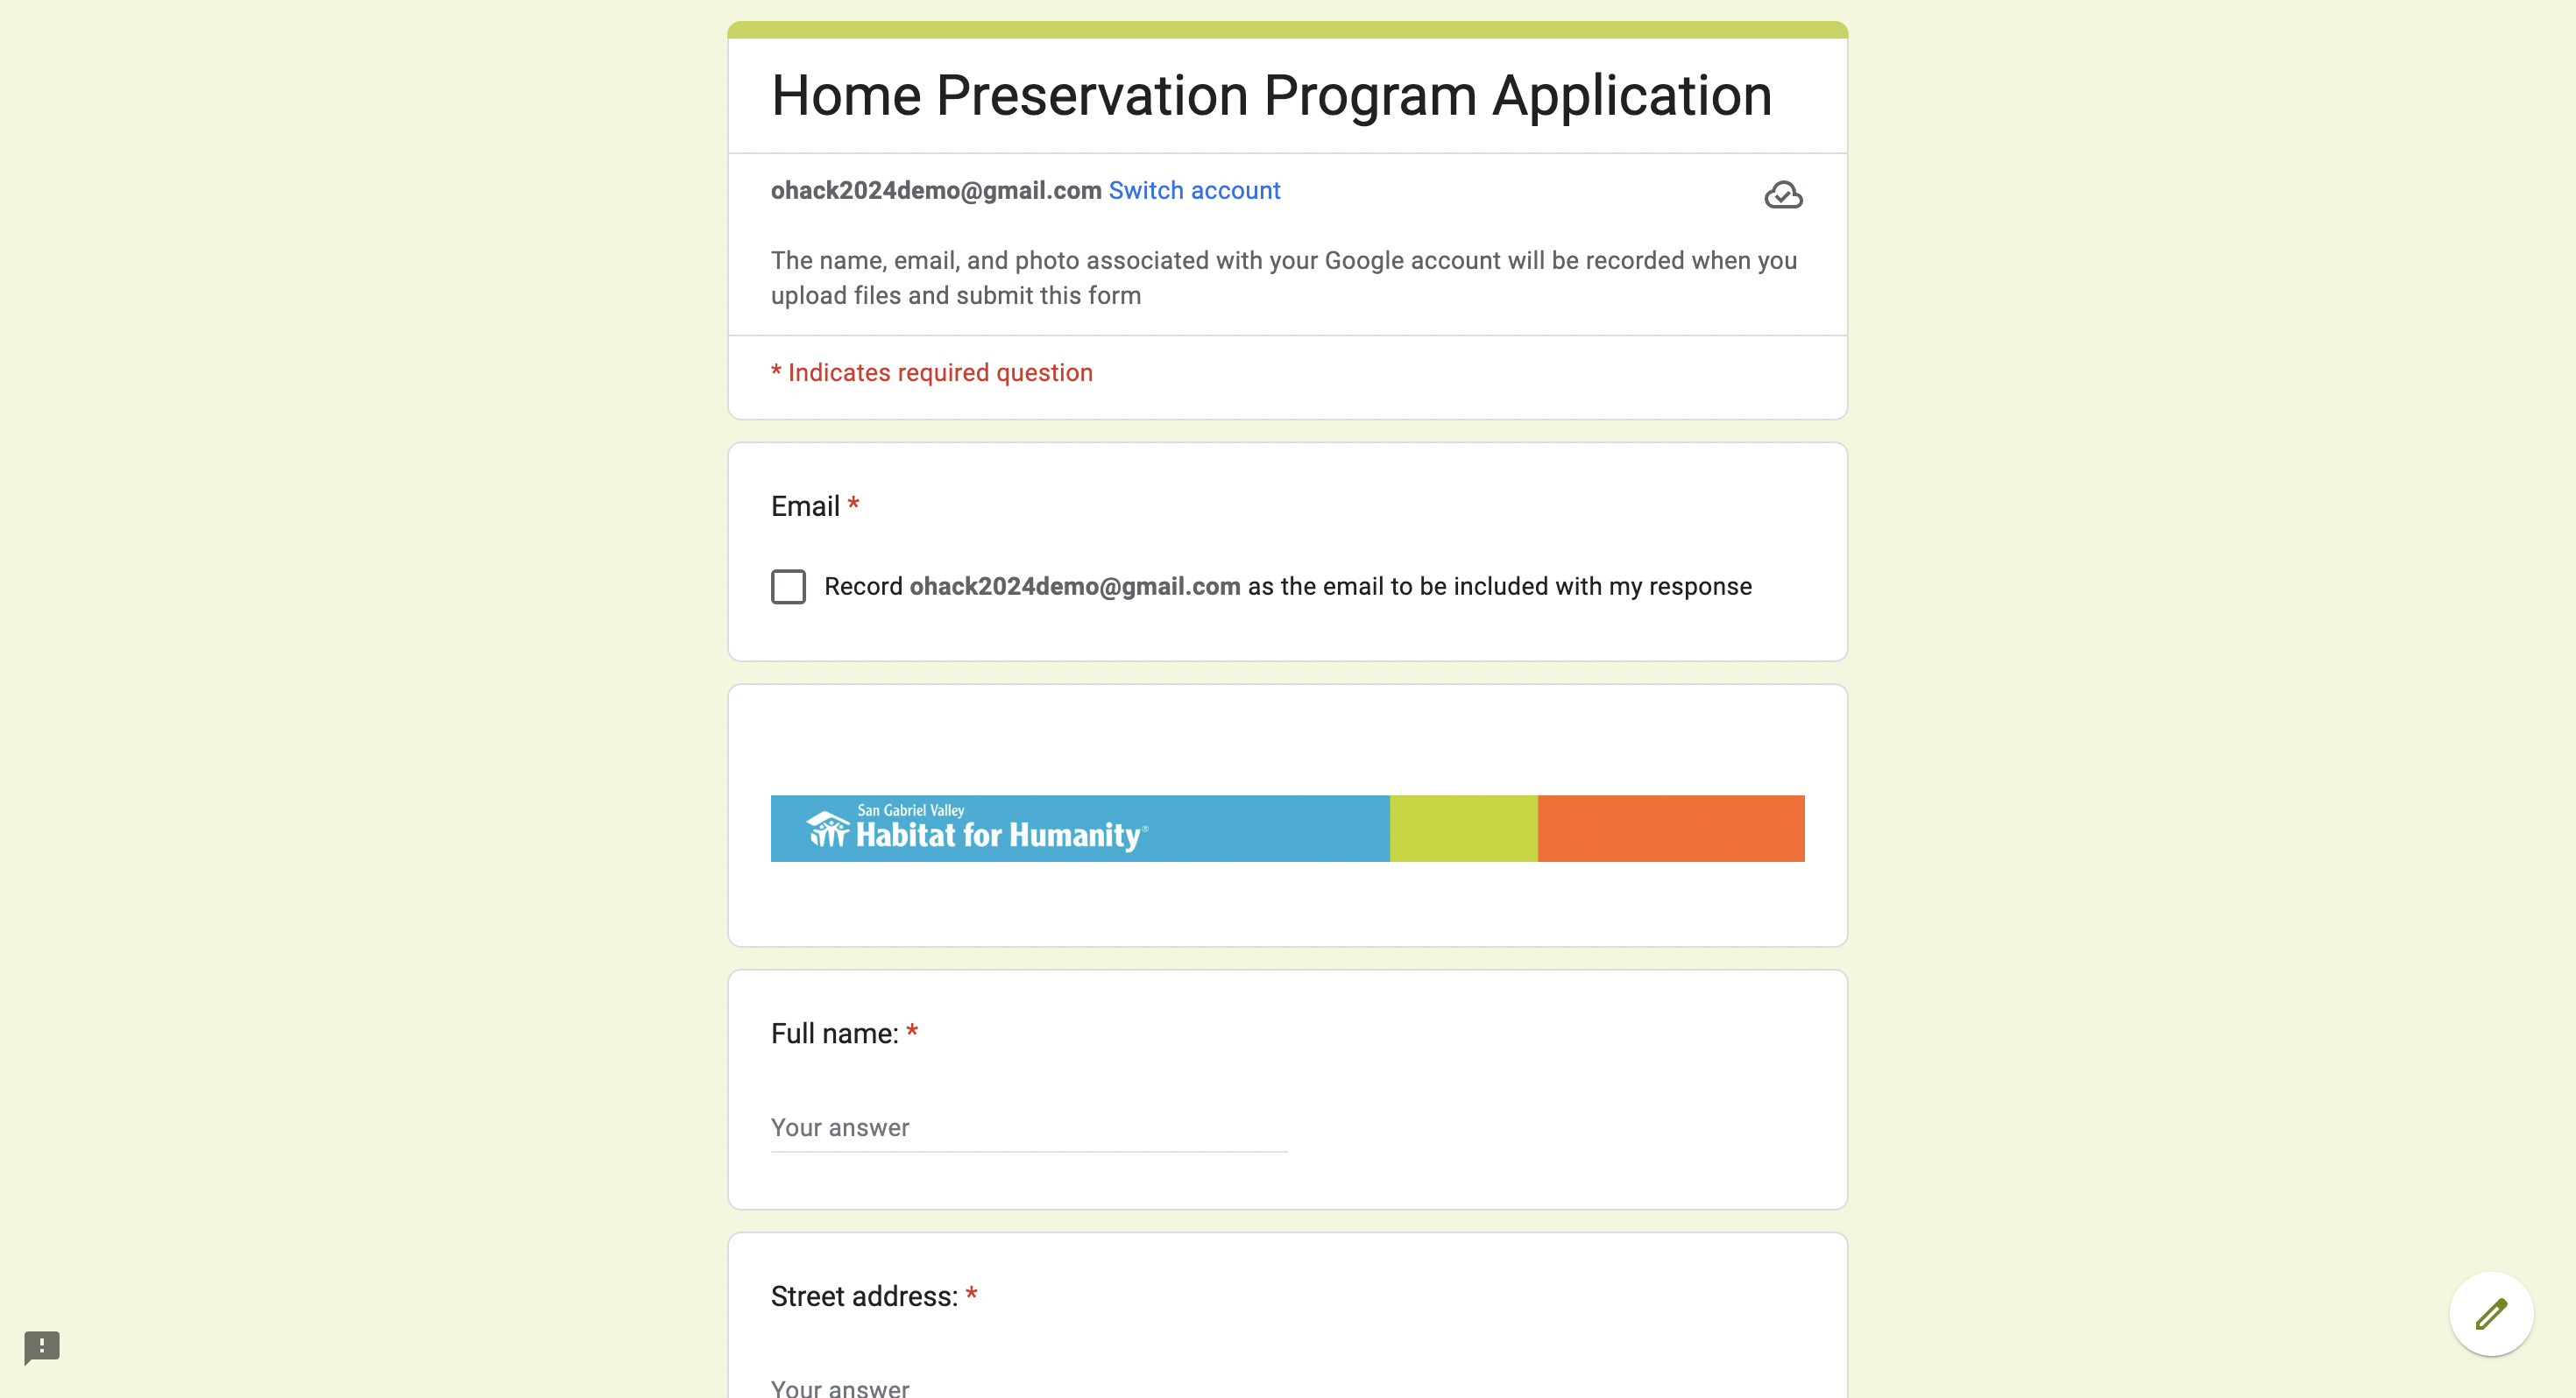
Home Preservation Program Application Google Form
-

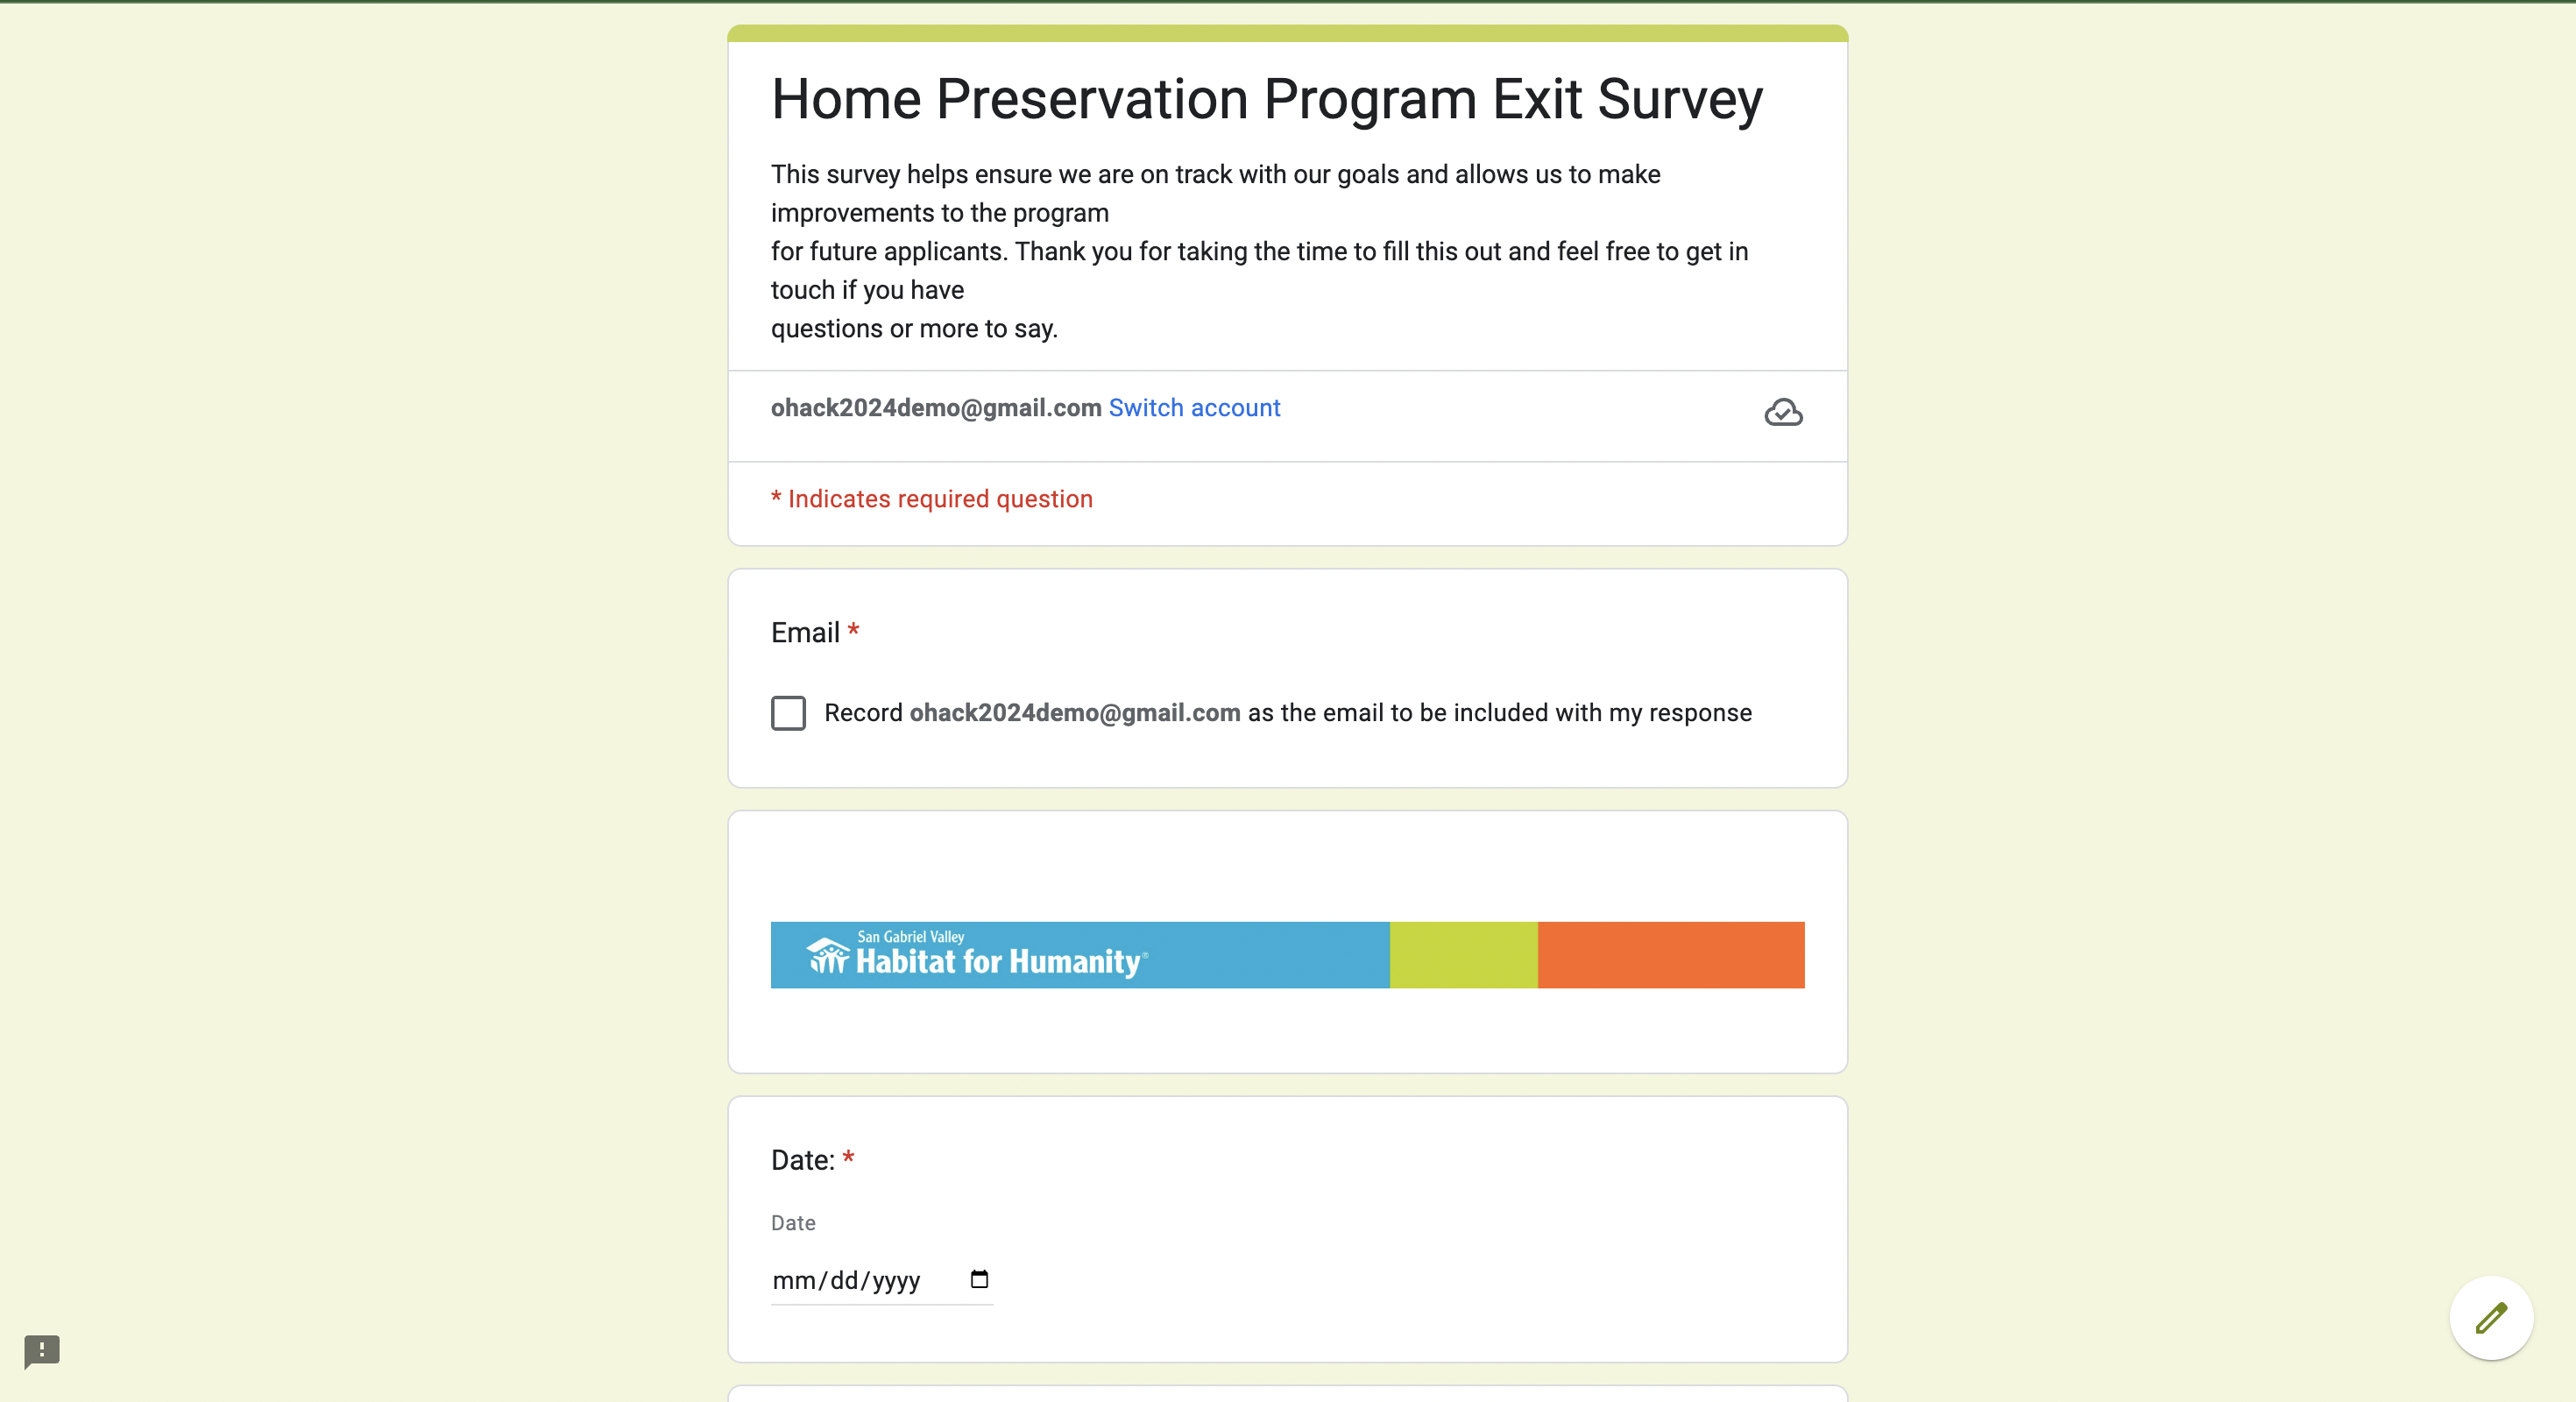
Home Preservation Program Exit Survey Google Form
-
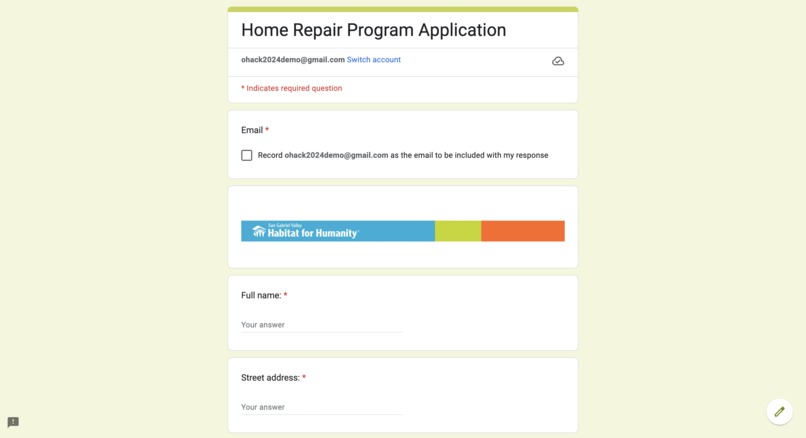
Home Repair Program Application Google Form


Inspiration
Inspired by SGVH's work in providing low-income housing and community revitalization, we wanted to assist in their mission by streamlining their survey collection and data analysis, so they can better track community impact and expand their services. When deciding on a project, we were also seeking a large data-focused project where work could be divided between our four-member team. Ultimately, we are confident we made the right choice and hope our product can boost productivity.
What it does
Utilizing Google's integrated technological systems, we implemented a comprehensive data-driven dashboard and survey automation system that consolidates new and existing data into one. This is necessary because SGVH sends out online and paper surveys across the country. These surveys contain a mix of free response and multiple choice surveys and we were able to synthesized multiple datasets into one. One key feature that would streamline inputting survey data was our scan and upload tool that uses a LLM to extract text from a paper survey and inputs it directly into our Google Form, only leaving easy-to-click multiple choice questions left (saving about 3-5 minutes per form). From here, Google Forms automatically creates a Google Sheets database which Looker Studio synchronously reads from, and creates a robust data visualization charts and various filtering methods. The final product is a website that acts as a company-wide dashboard for sending surveys, reading data analytics, and maintaining a secure database.
How we built it
We built our platform using Google's integrated technology services. The system flow begins with implementing user surveys in Google Forms where we created a scan and upload feature to assist in the company's transition to a digital database. After ensuring all surveys are in a Google Forms format, we linked them to a Google Sheets database, which Looker Studio utilizes to make stunning, intuitive data visuals. Finally, we created a Google Sites websites that embeds Looker Studio visuals, a Colab Notebook tutorial, and survey links to create a user friendly dashboard. We created a Colab Notebook as a documented tutorial to assist users in running our AI text extractor python script for scanning and inputting written-responses into a Google Form.
Challenges we ran into
- Our largest challenge was pivoting from a coding a full-stack web application to utilizing Google's integrated services. After talks with our community partner and project mentors, we targeted their needs by developing an accessible, customizable, and dynamic application that is simple to maintain and understand. This also allowed us to focus on difficult background tools and maximize Google's free services.
- SGVH has an overflow of existing survey papers and excel files that are unorganized and discombobulated. To combat this, we developed a python script that utilizes computer vision and a LLM to read existing paper surveys and integrate them into a combined database. The two main issues we ran into was identifying circled multiple-choice questions on the survey and retrieving consistent data from our LLM.
- Due to the nature of free-response forms, it was difficult to consolidate consistent data between our network of platforms. Before creating visuals on Looker Studio, we combined existing paper surveys and new online surveys into one main database while sectioning off the different survey responses. However, between reading multiple data inputs and the limits of the Google services, maintaining multiple databases which funneled into our visual dataset was a challenge.
Accomplishments that we're proud of
- We were proud of our ability to accurately identify the problem and quickly rollout a robust, integrated system that meets the needs of our nonprofit. Before we wrote any code or created any mockup, we focused on collaborating with our community partner and mentors to pinpoint the necessary parts to our product.
- Transitioning to using Google's services allowed us to work on tools that would be otherwise impossible given a limited amount of time. After talks with our community partner, we were able to implement visual heat map charts, a robust data filtering system, and a scan and upload feature that helps the company transition to a digital database. This also gave us freedom to learn utilizing LLM's during the rollout of the scan and upload text extractor and the filtering of critical responses.
What we learned
- We learned how to be be product designers first, and software engineers second. By tailoring our system to the needs of our nonprofit, we eliminated a long design process and honed in on a comprehensive user experience. Adaptability and putting our customer needs first is what it truly means to be a software engineer in todays world.
- We also learned how to use various AI APIs and process the data that these requests output. Understanding how to craft prompts for the LLMs and extract meaningful data was an overarching theme for designing specific data tools. Learning these skills and processes was rewarding and impactful.
- Because the needs for SGVH's were scattered out, we learned how to design and develop a full-stack, integrated system. None of us had worked on a system that required many key features and services and merge them into one user friendly system. This project gives us confidence to continue becoming well-rounded engineers and compete in future hackathons; tackling on a new large project.
What's next for FourksUp: San Gabriel Valley Habitat for Humanity
OHacks Fall 2024 is only the beginning for Team #4. Three of us were two-time hackathon participants and one was his first time. As we work on our coding craft, build more personal projects, and continue to be inspired by talented software developers around the world, the sky is the limit. Furthermore, tackling a large data-drive project for San Gabriel Valley Habitat for Humanity gives us confidence to practice working with APIs, LLM, and big data projects. Count us in for next year!

Log in or sign up for Devpost to join the conversation.