-
-
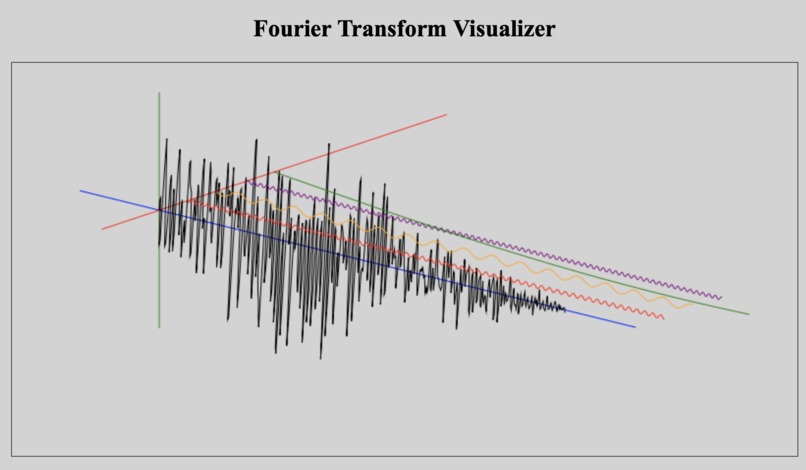
Example Visualization #1
-
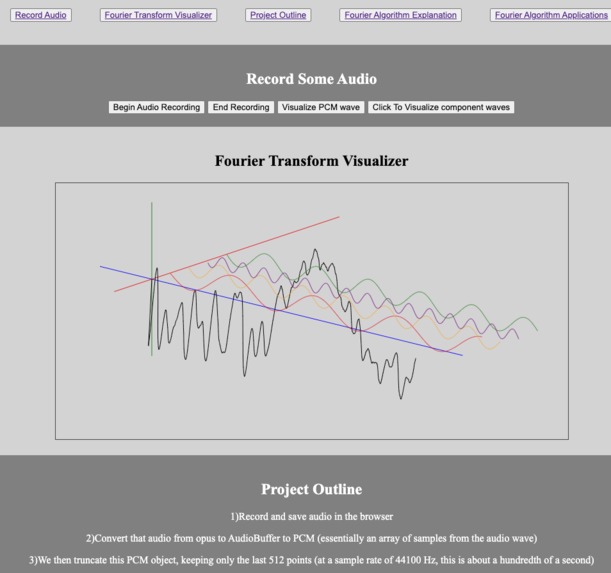
Example Visualization #2
-
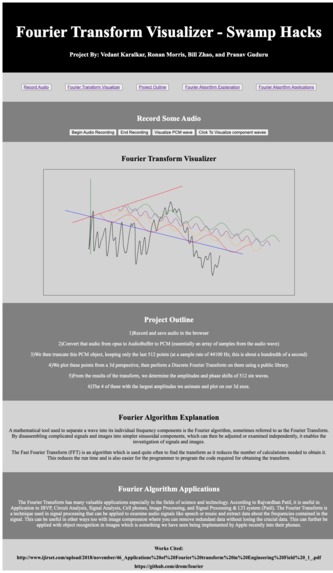
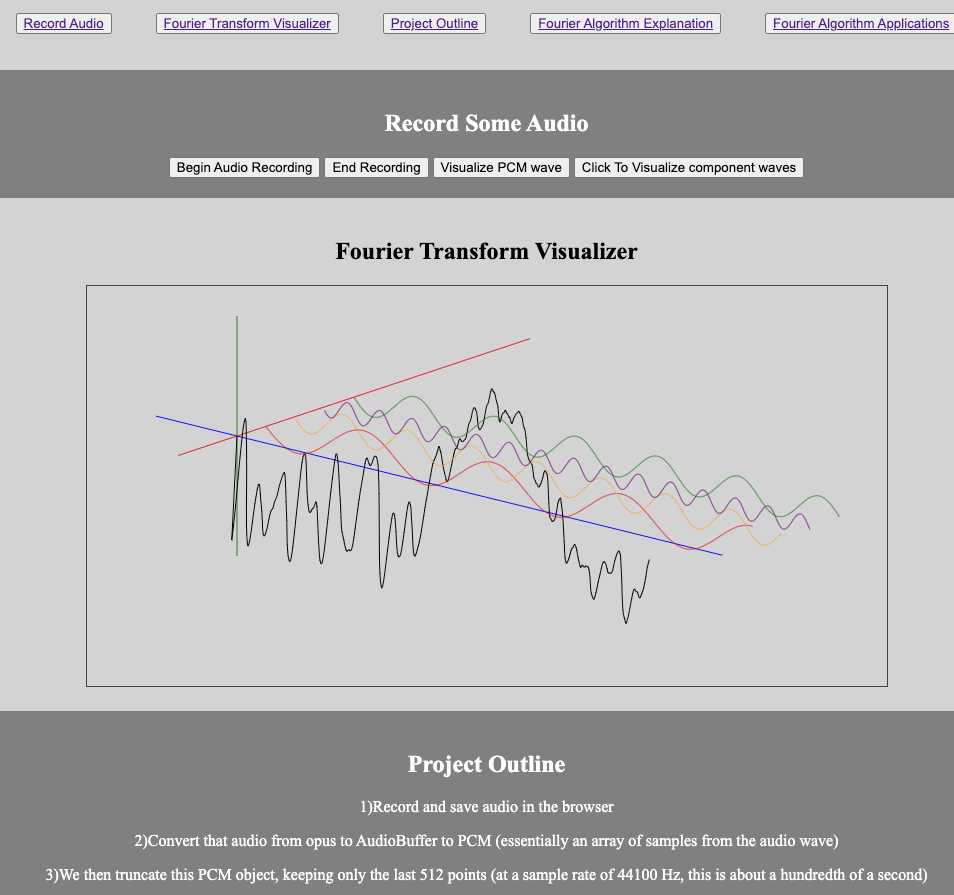
Full Site Picture

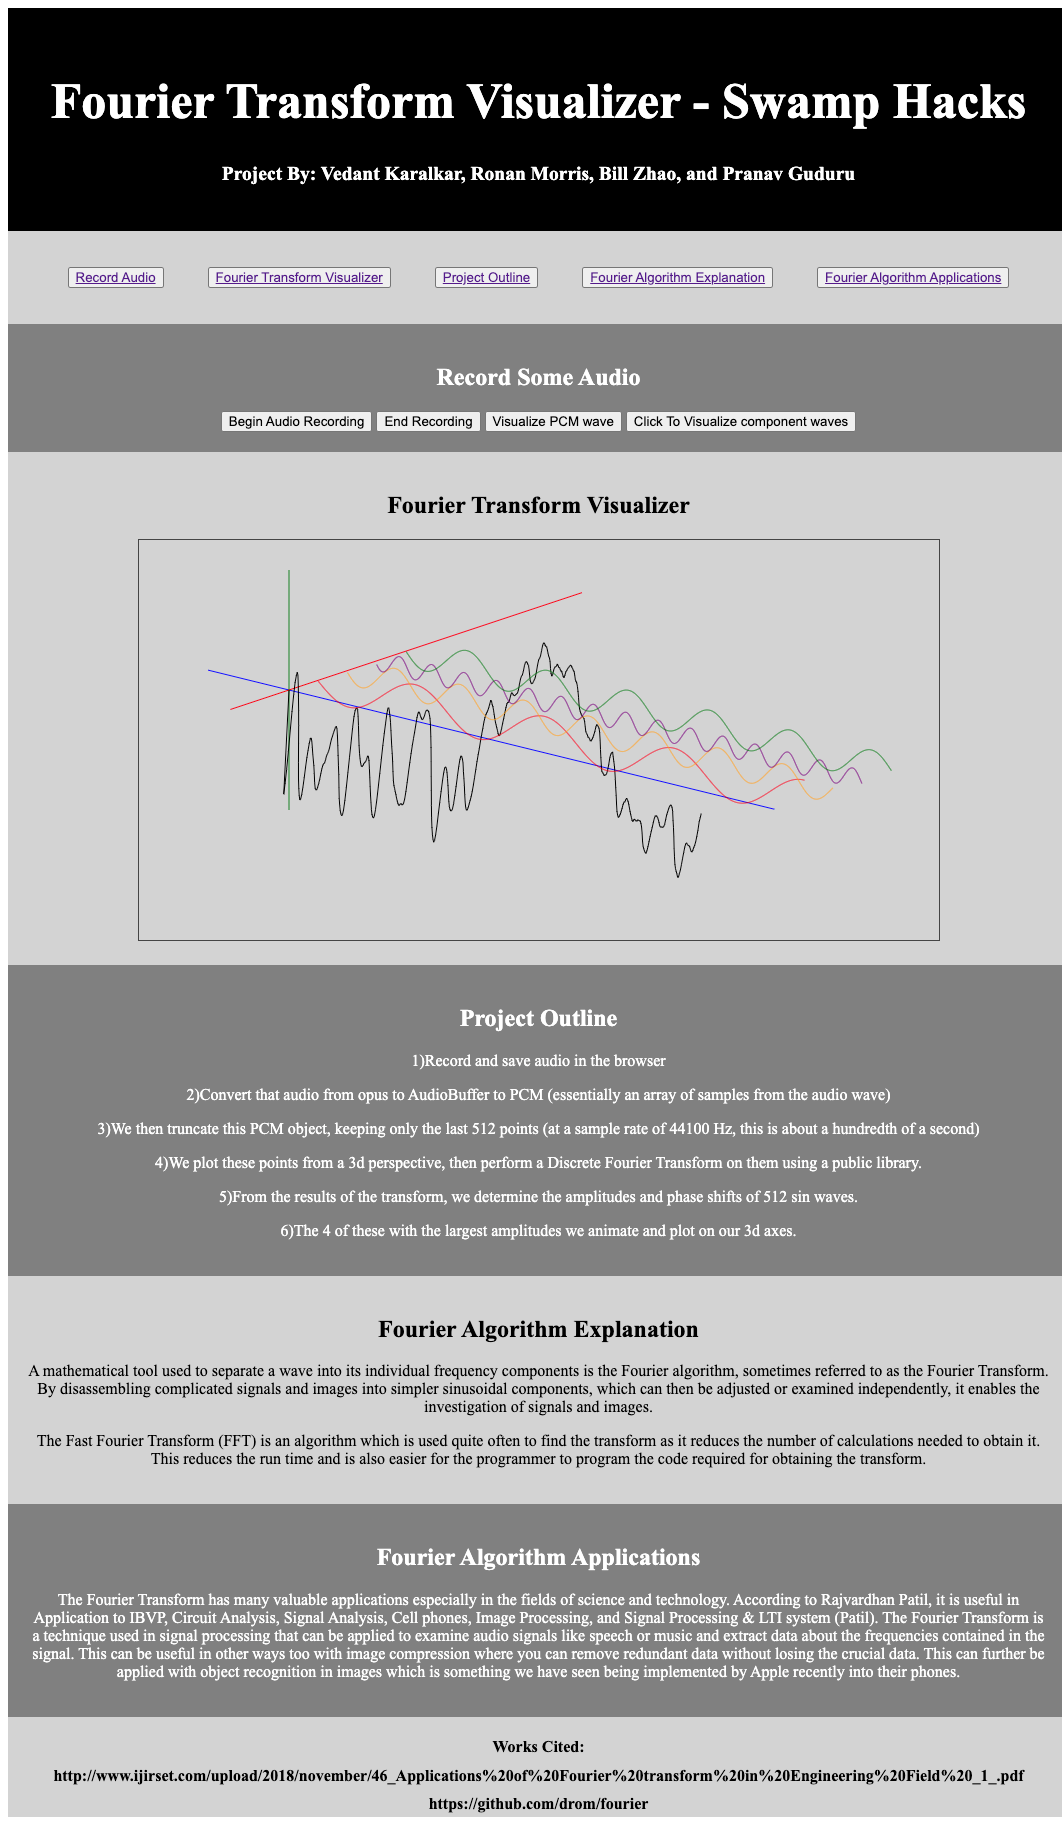
Inspiration
The topic of visualizing the Fourier Transformation first came to our group when one of our members, Bill, took physics classes, such as Electromagnetism, that discussed the concept. While learning about these transformations, we saw a .gif that displayed an audio sample and broke it down into its component sine waves. We love working with music and had recently looked into decomposing sound waves, thus we found this visualization very intriguing and thus decided to create a program that would allow users to visualize their audio samples through the Fourier Transformation.
What it does
Our program is a website that allows users to visualize a Fourier Transformation of an audio sample they input. The program does this through the following pipeline: the program first records the user's audio input and stores it in the browser, then converts this from opus to AudioBuffer to Pulse-Code Modulation, which the program then truncates to the last 512 points. This is then plotted in a 3d perspective, and the program then performs a Discrete Fourier Transformation on them using a public library. Then the program determines the amplitudes and phase shifts of 512 sine waves, and the 4 sine waves with the largest amplitudes are plotted on our xyz plane.
How we built it
The project begins with an initial audio stream which we then converted to an audio file. This file was then taken through intermediary phases (opus → AudioBuffer → Pulse-Code Modulation (PCM)). The program then graphs the PCM, which is plugged into the Fourier Transform Library, which outputs many sinusoidal waves, from which the program picks the four largest amplitude waves, which are then animated onto the graph behind the PCM graph. All of this code was completed on javascript, hence we used html to create a github webpage to display our project and provide a user interface for the collection of audio input that can then be analyzed through the Fourier Transformation.
Challenges we ran into
We faced many challenges throughout the course of the project. Initially, the main challenge we faced was familiarizing ourselves with the languages that we were coding in. Once we became familiar with the languages and styles we were coding in, we faced our first main obstacle in the attainment of the user’s audio input. After reading a lot on the topic we were able to find the .getUserMedia({audio:true}) function which allowed us to extract user input. Once we had the user input, processing it into a graph was another challenge, which we overcame by the translation of the data to AudioBuffer and PCM, which allowed us to graph the amplitudes of the user’s audio sample. From this graph we were able to do the Fourier Transformation to create the sine waves. Plotting the waves themselves was a major challenge, as we had to understand 3D graphing in javascript and css animations in order to show the different sine waves for our component waves. Additionally, figuring out implementation of website features such as a directory bar and web design was a challenge as none of us were familiar with the implementation of web design features in html. Overall, while we encountered many problems over the course of this project, we were able to overcome them by reading about the topic and doing trial and error in our code.
Accomplishments that we're proud of
Through this project, we decided to take on our first ever project in a language that we were not familiar with. Through the course of the hackathon, we learned the language, the implementation of many niche techniques in that language, and created a project that would be able to show a very complex mathematical construct. For many of us, this was our first time embarking on a project outside of the classroom environment, and so it was an accomplishment for us.
What we learned
Coming into this hackathon, the extent of our knowledge laid in python and java. For the project, we decided to embark on something new, taking on a project in javascript and html, languages we were not as familiar with. Through the course of this project, we learned how to get user audio input, analyze the audio input, and display it as sine waves through javascript. Additionally, we learned many aspects of web design and css through the design of our webpage through html. Overall, we all feel that we have a much stronger understanding of javascript, html, and css due to this project.
What's next for Fourier Transform Visualizer
It would be cool to be able to play the audio that each of the sinusoidal waves represents.
Members
null#3870 right#7872


Log in or sign up for Devpost to join the conversation.