Inspiration
Modern sports analytics has a critical blind spot: "load management." Today, resting star players is often based on gut feelings or surface-level statistics, which frustrates fans and leaves front offices guessing. I realized that human fatigue isn't a mystery—it is a mathematical equation. I wanted to build a system that treats a player's physical workload and recovery time as sequential data, moving away from static season averages to create a dynamic, live-updating biometric engine.
What it does
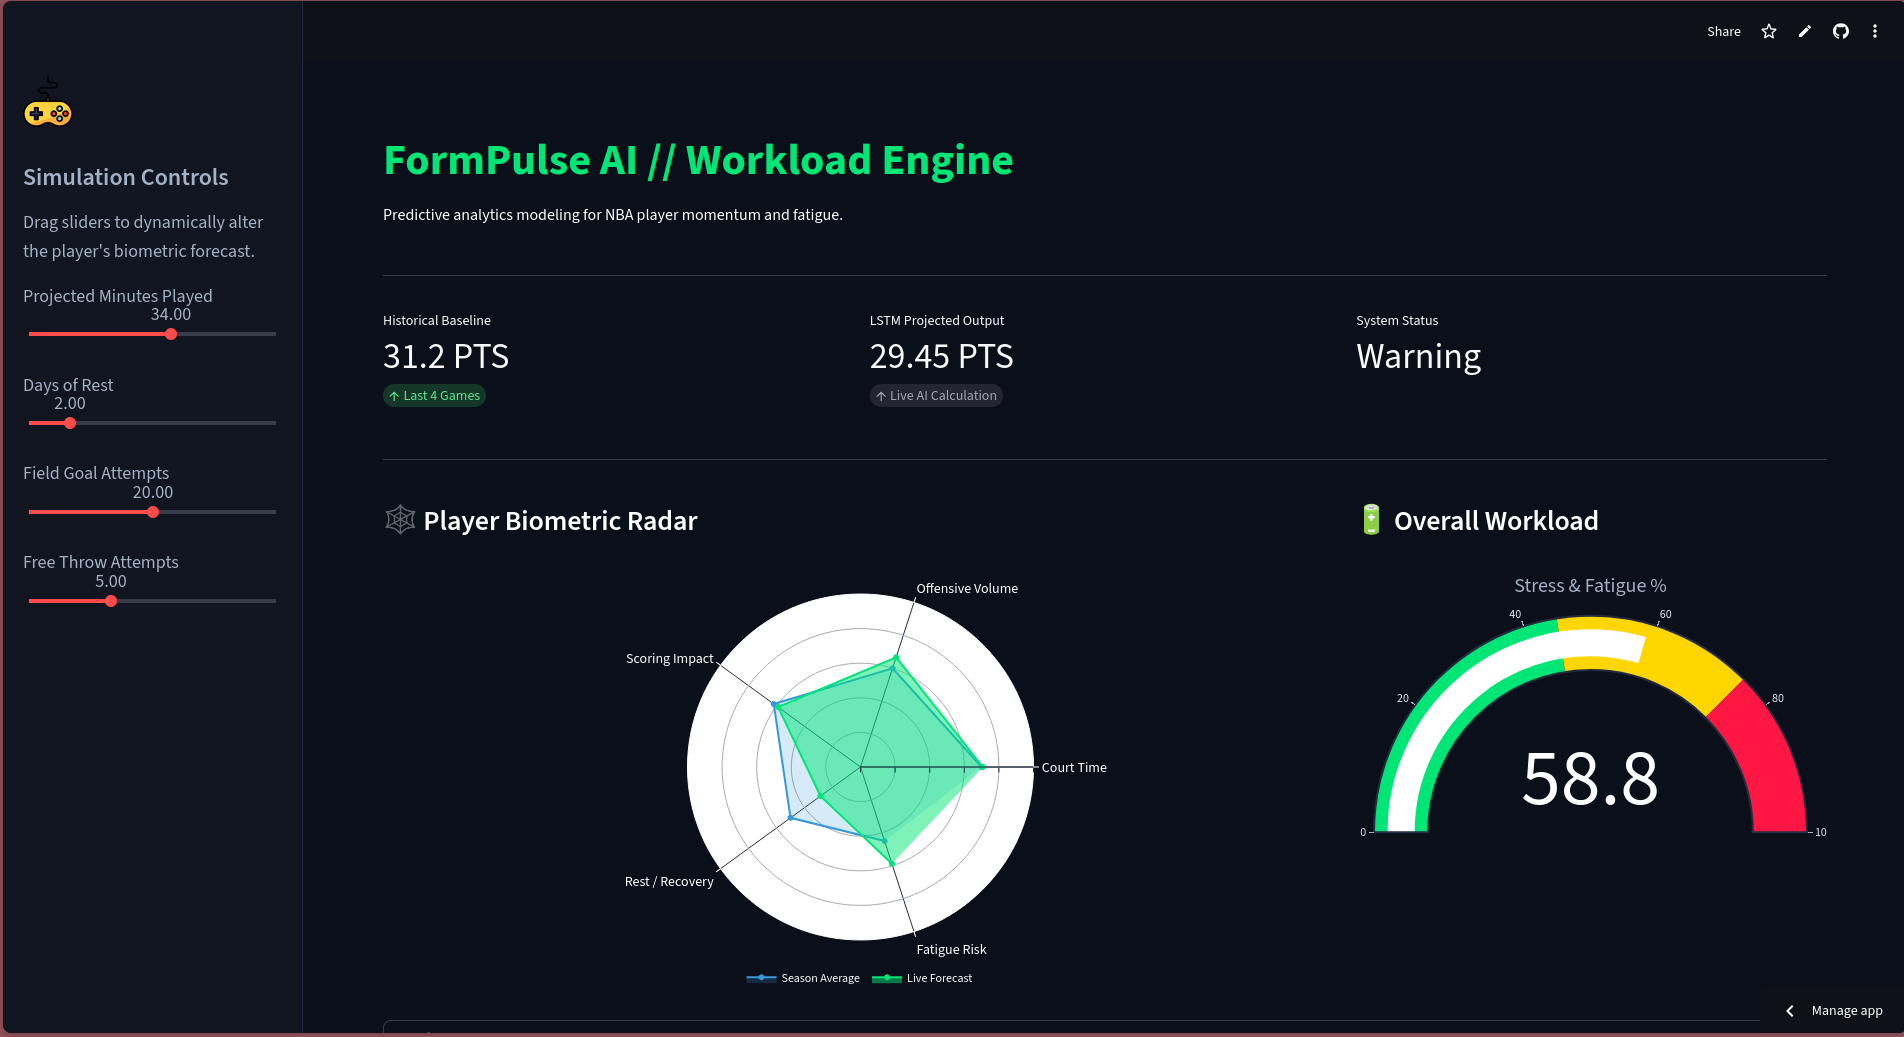
FormPulse AI is a predictive analytics dashboard engineered for NBA coaching staffs and sports science teams. Instead of looking backward at what a player did, it forecasts what they will do.
By adjusting live matchday parameters (Projected Minutes, Days of Rest, Field Goal Attempts, and Free Throw Attempts), the engine passes the data through a deep learning model to output two critical metrics:
LSTM Projected Output: An exact forecast of the player's scoring trajectory.
Combined Workload Index: A live "speedometer" that calculates physiological stress, alerting coaches when a player crosses into a high-risk fatigue zone.
How I built it
I engineered a complete, full-stack machine learning pipeline:
The Brain: A Bidirectional Long Short-Term Memory (Bi-LSTM) neural network built with TensorFlow and Keras. I trained it on historical Kaggle datasets, utilizing Scikit-Learn's MinMaxScaler for data normalization.
The Logic: Unlike standard linear regression, my model processes 5-game rolling sequences. This captures the compounding physiological effects of back-to-back games and heavy minutes over time.
The Interface: I deployed the application via Streamlit Cloud. To make the complex AI insights digestible, I integrated Plotly graph_objects to build a highly interactive Biometric Radar Chart and Risk Gauge that morph in real-time as users adjust the sliders.
Challenges I ran into
Shifting from traditional algorithms to time-series deep learning was a steep curve. Structuring the historical basketball data into chronological 3D tensors for the LSTM required intense data wrangling. Furthermore, deploying a heavy neural network (.keras file) to a cloud environment meant I had to optimize the architecture (using tensorflow-cpu) to prevent memory crashes. Finally, forcing the Plotly UI components to re-render flawlessly without caching stale data required precise state management in my Python script.
Accomplishments I'm proud of
I am incredibly proud of bridging the gap between raw data science and a production-grade UI. Taking this from a static Jupyter Notebook to a sleek, dark-mode SaaS dashboard deployed live on the web is a massive milestone. Building a fully functional AI pipeline of this caliber as a solo, first-year engineering student proves that with the right logic, complex machine learning can be executed cleanly and professionally.
What I learned
This project was a masterclass in full-stack AI deployment. I learned the intricacies of Bi-LSTM architectures for time-series forecasting, advanced state management in Python web frameworks, and how to build a zero-local continuous deployment pipeline directly from GitHub to Streamlit Cloud.
What's next for FormPulse AI
The architecture is scalable. The next step is integrating a live NBA API to replace static CSVs, allowing the dashboard to update automatically every night. From there, I plan to incorporate actual medical and injury-correlation datasets, evolving the Fatigue Risk Index from a performance tracker into a true, medical-grade injury prediction tool for professional sports franchises.
Built With
- https://formpulse-ai-dashboard.streamlit.app/


Log in or sign up for Devpost to join the conversation.