Inspiration
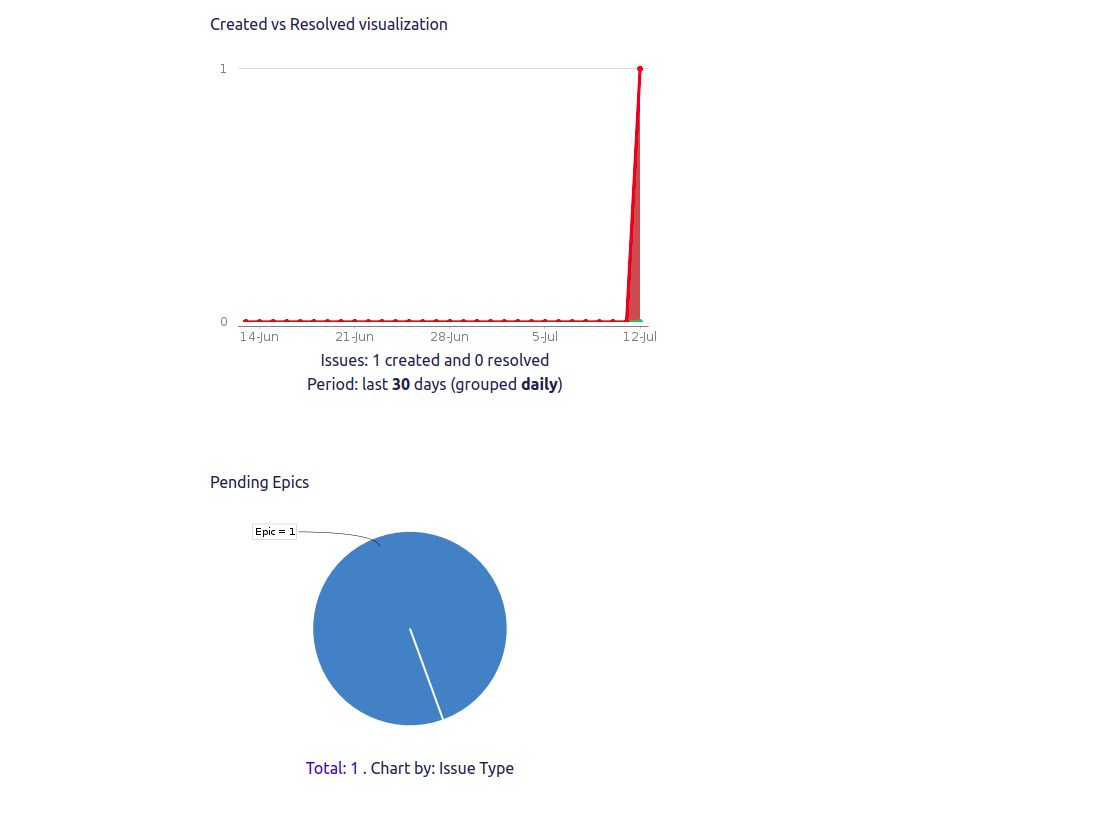
Many a times issues with visibility especially with product managers against software developers is always a common thing. Whereby a developer is allocated a task and the issue takes longer than expected, maybe they encounter blockers along the way or even the Epic was too big and they were optimistic about the issues without subdividing them into smaller pieces. Here is how Jira Charts Come in to clearly show when developers get blockers along the way and transparency about the flow of work being done.
What it does
Shows a graphical presentation of jira issues on a chart and this clearly shows the progress of various tasks
How I built it
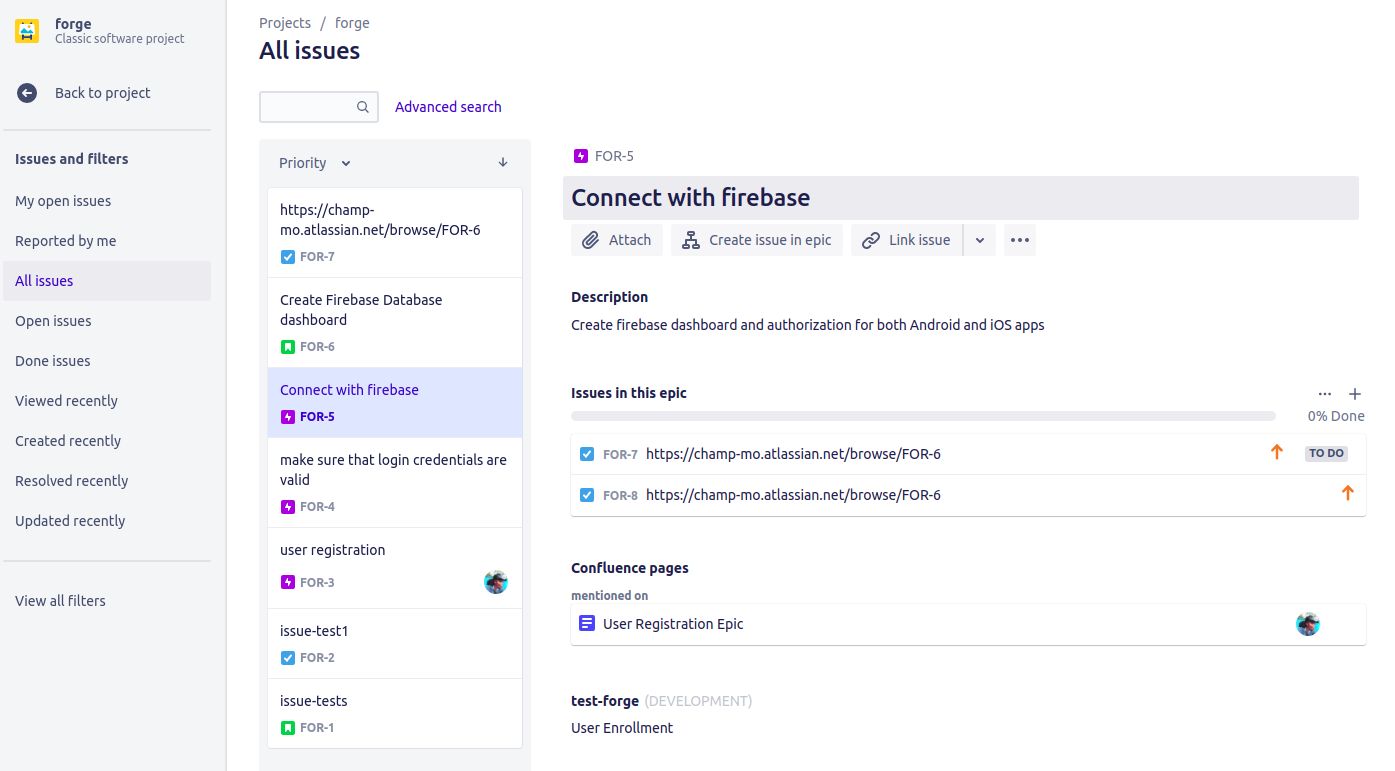
Used Forge create to create the Jira project, forge deploy to deploy and finally forge install to install the app, linked the project with the forge Confluence project then added the Jira Charts Macro.
Challenges I ran into
Not being able to integrate with other Atlassian Apps like Opsginie easily since forge only runs on Jira and Confluence.
Accomplishments that I'm proud of
Being able to make the project up and running on the dot net site is a great achievement for me since it was my first time using Atlassian Cloud product
What I learned
Forge helps in improving UI of various Atlassian cloud products and can be customized to suit different user satisfaction
What's next for Forge Jira Chart
Work towards integrations with other Atlassian apps using API calls


Log in or sign up for Devpost to join the conversation.