Inspiration
I’ve always been interested in using AI for environmental good, and deforestation detection struck me as a critical issue. I wanted to build something that could make these insights accessible and visual for anyone curious about forest loss.
What it does
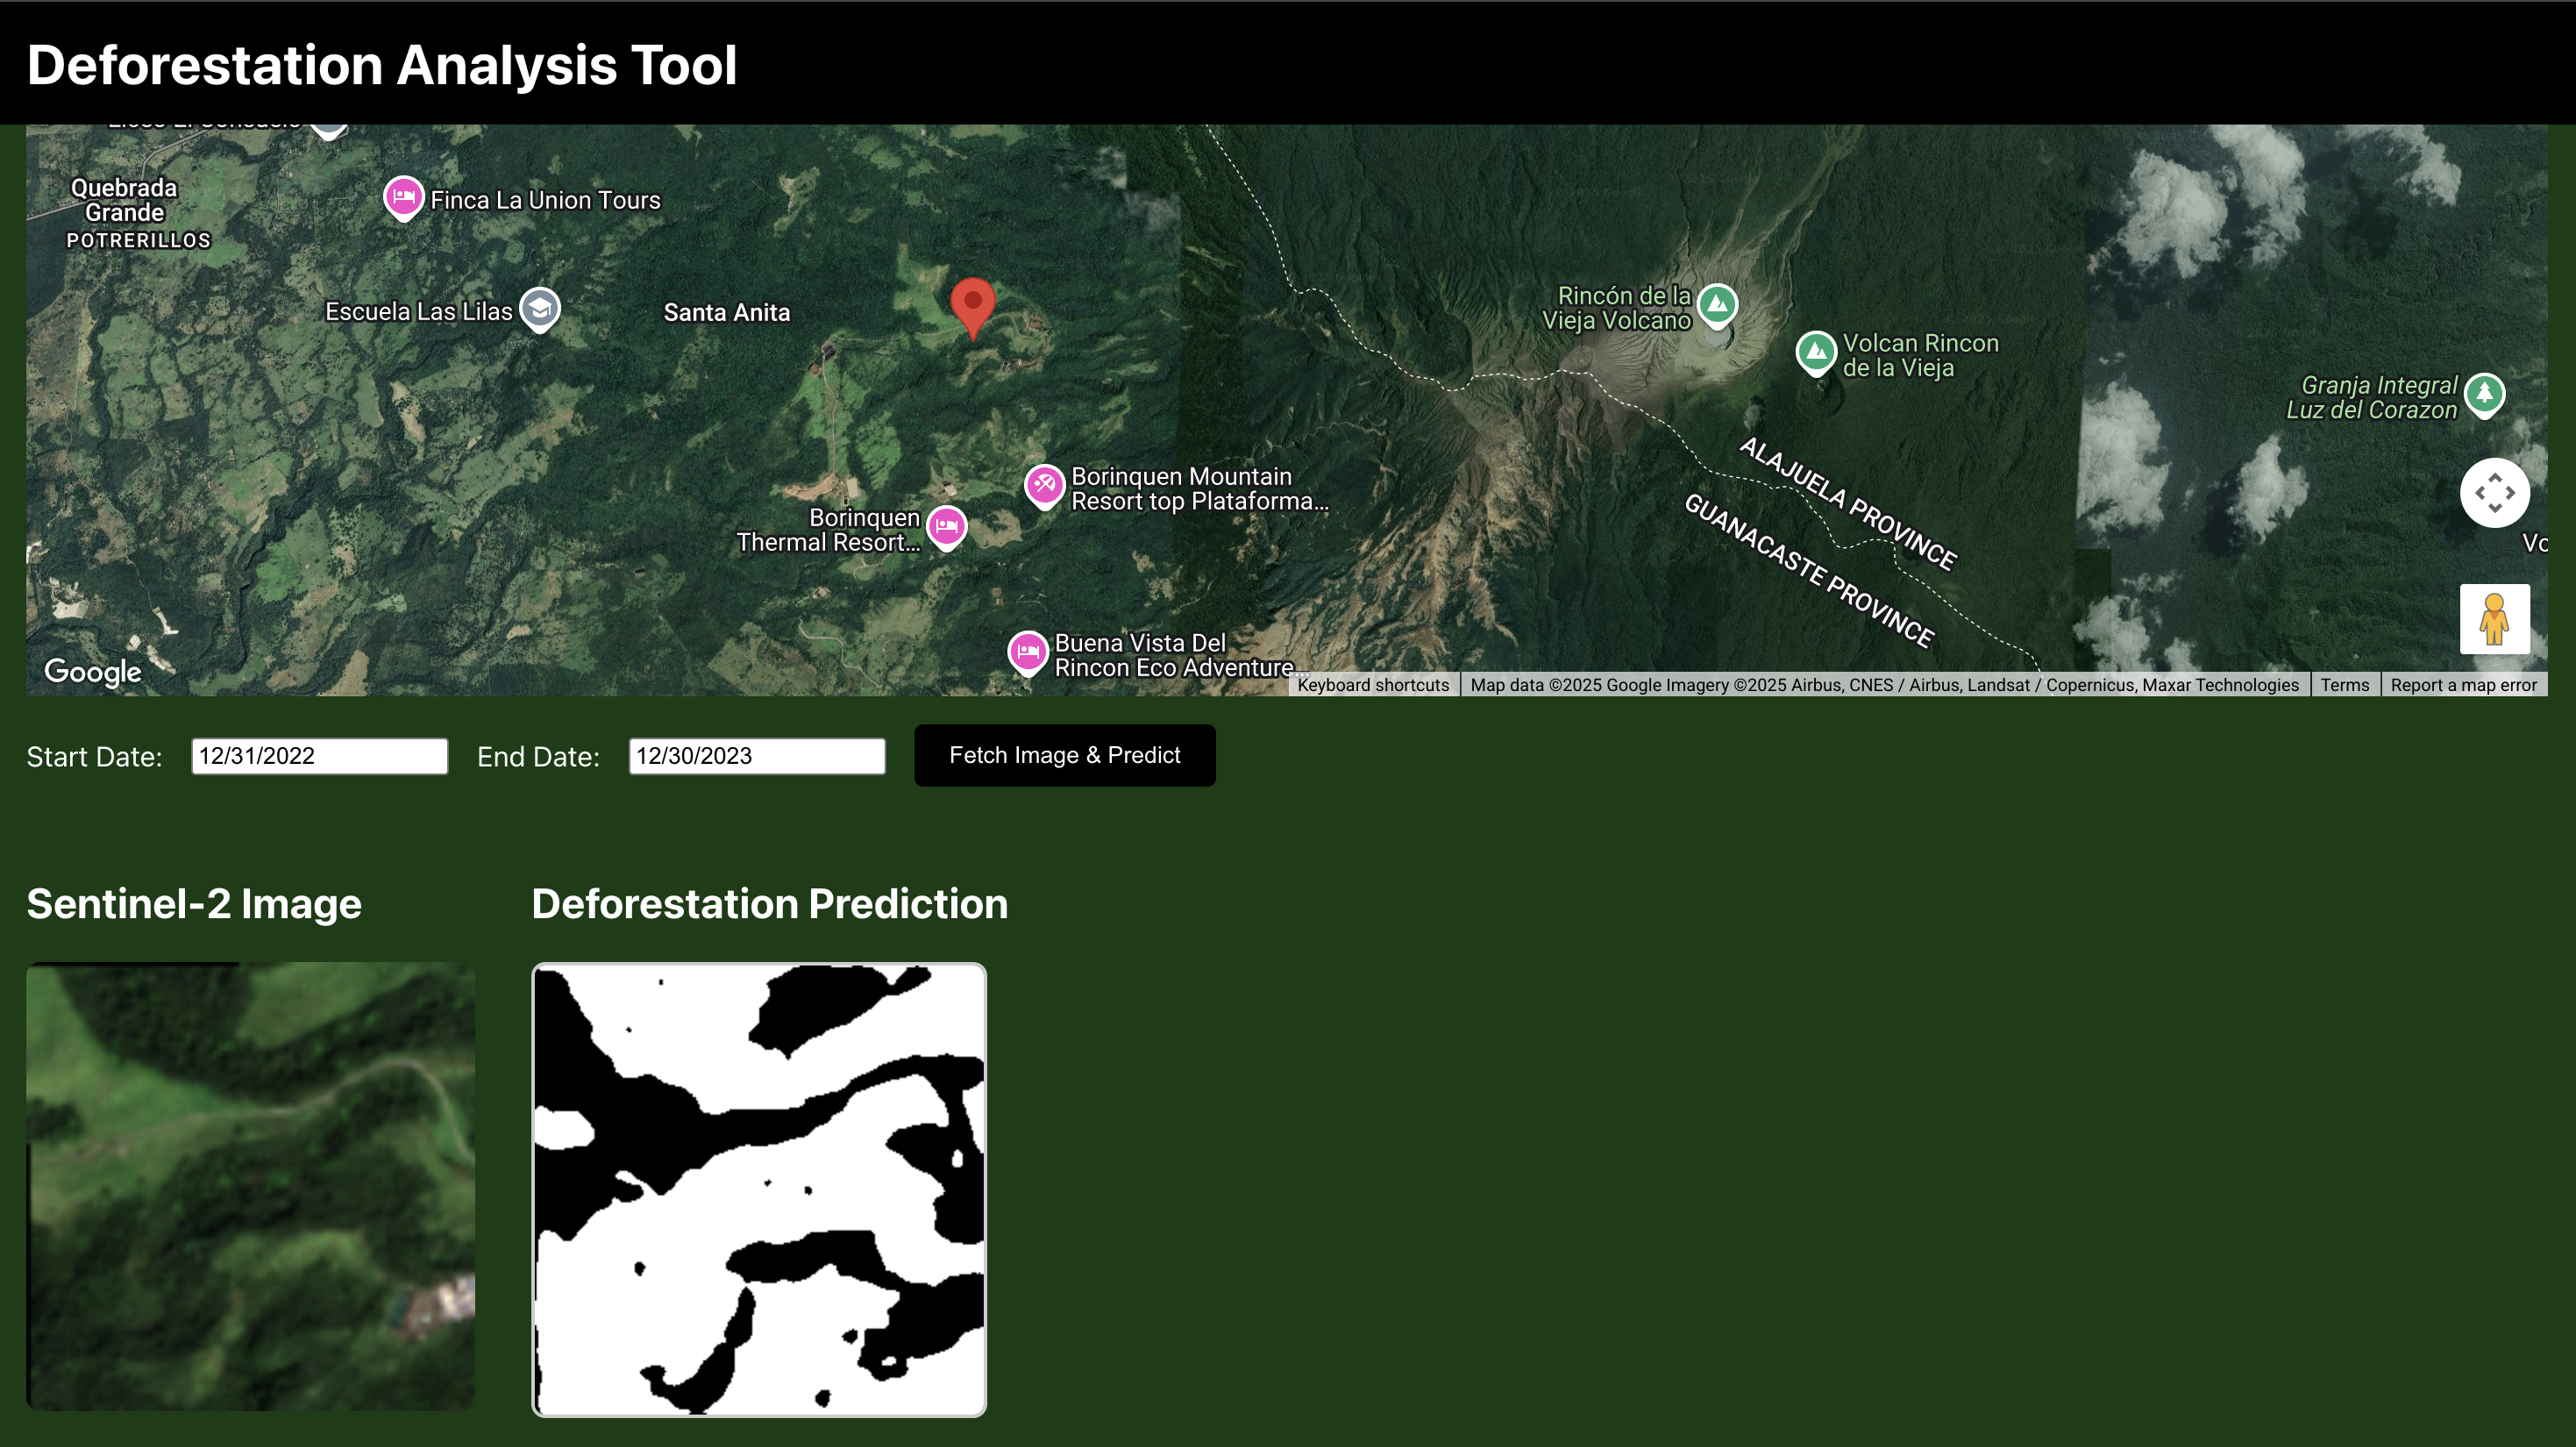
The app lets users select any region on a map and analyze satellite imagery over a chosen time period to detect deforestation. It displays both the satellite image pulled from Google earth Engine and a segmentation mask highlighting deforested areas.
How we built it
I trained a lightweight custom CNN model using Sentinel-2 images (NIR + RGB) and deployed it via a Flask backend. On the frontend, I used React with the Google Maps API and Google Earth Engine to let users pick a location and time range, fetch satellite data, and display predictions.
Challenges we ran into
One earlier model overfit badly, and another with a ResNet50 base ended up predicting completely deforested masks. I also had to troubleshoot data normalization and band order inconsistencies, which were affecting visual and model outputs.
Accomplishments that we're proud of
The final model achieved solid results with an F1 Score of 86.3% on the test set, and the full-stack web app is functional and interactive. I also successfully integrated Earth Engine with my own model, which was a first for me.
What we learned
I deepened my understanding of segmentation models, learned how to debug poor predictions caused by data issues, and improved my full-stack integration skills using Flask and React.
What's next for ForestWatch
I’d love to enhance the system with temporal analysis, allowing users to upload or fetch multiple images over time to analyze trends and flag zones at high risk of future deforestation. I’d also like to improve the UX and add a database of previous analyses for historical comparisons.
Built With
- flask
- google-earth-engine
- google-maps
- python
- react
- tensorflow


Log in or sign up for Devpost to join the conversation.