-
-
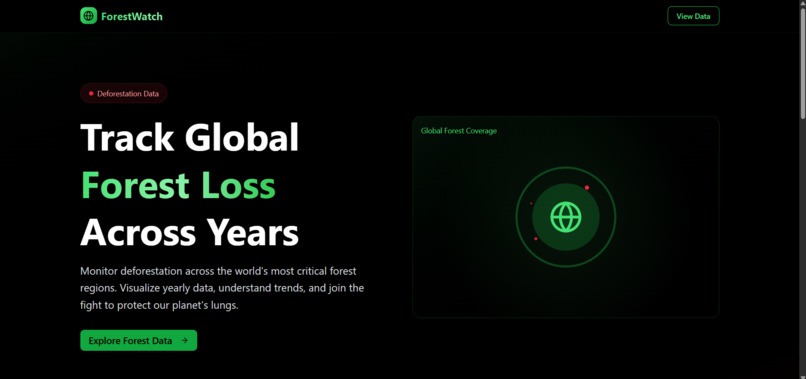
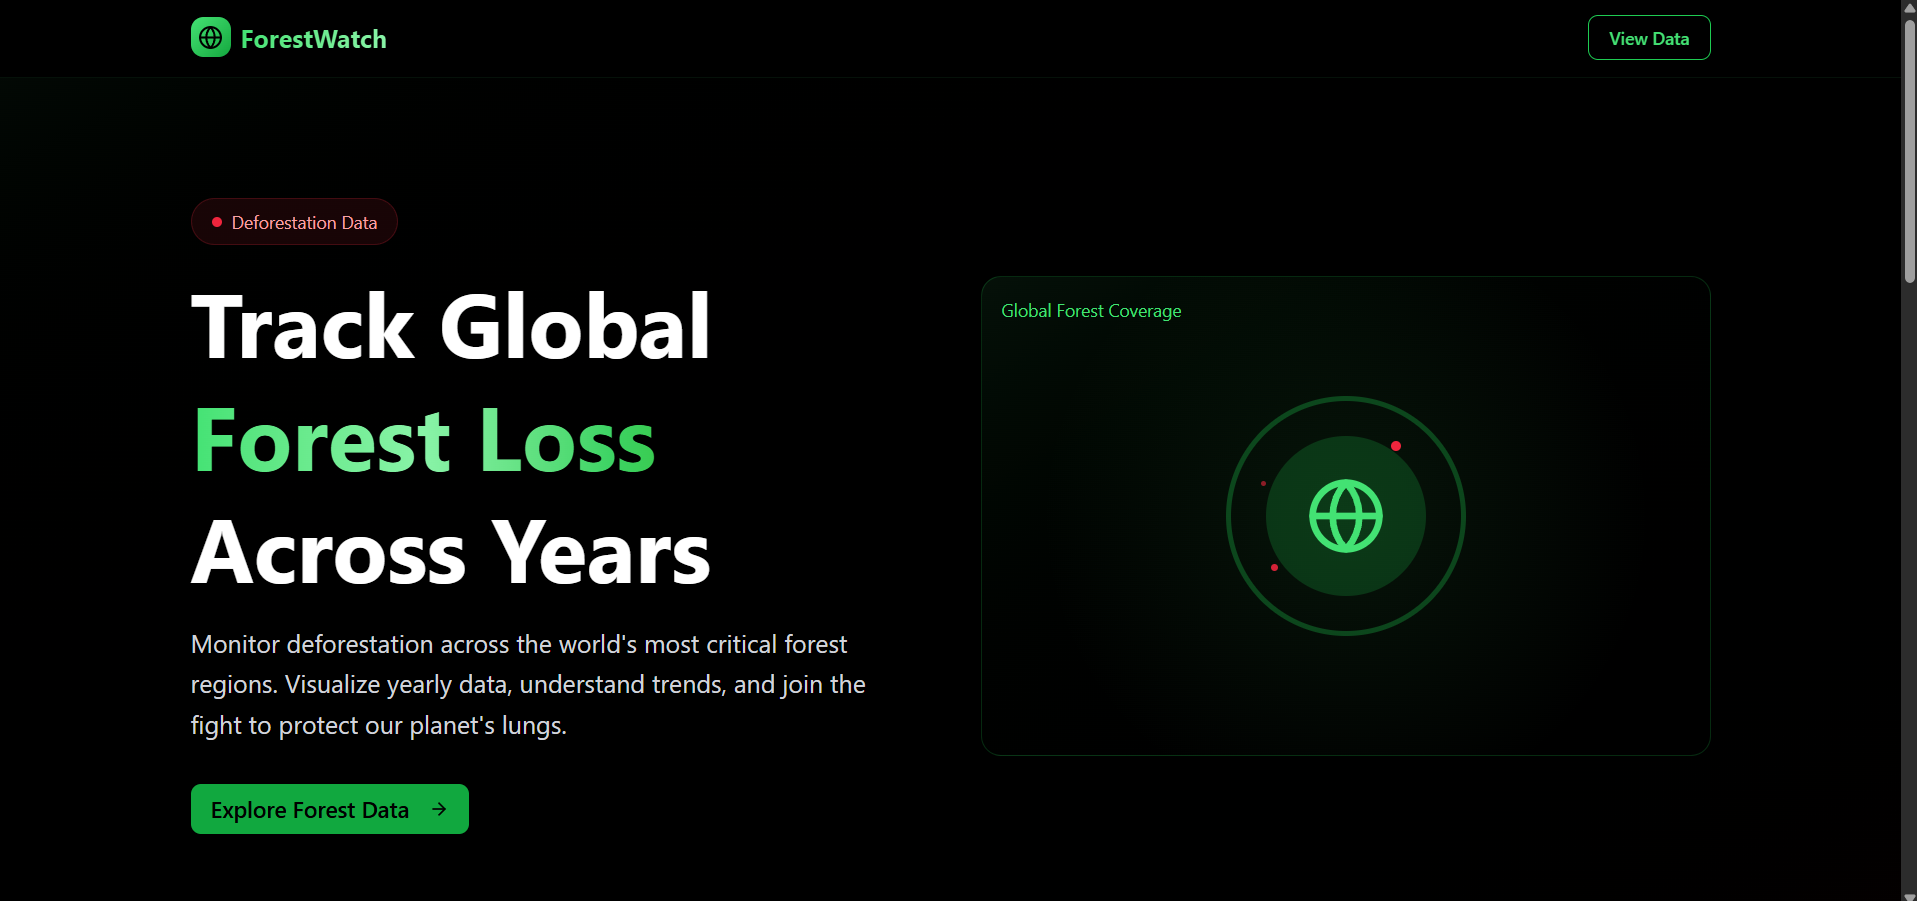
What is ForestWatch?
-
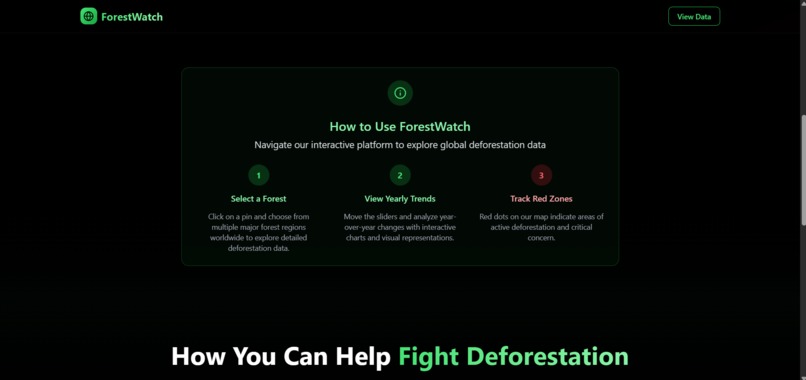
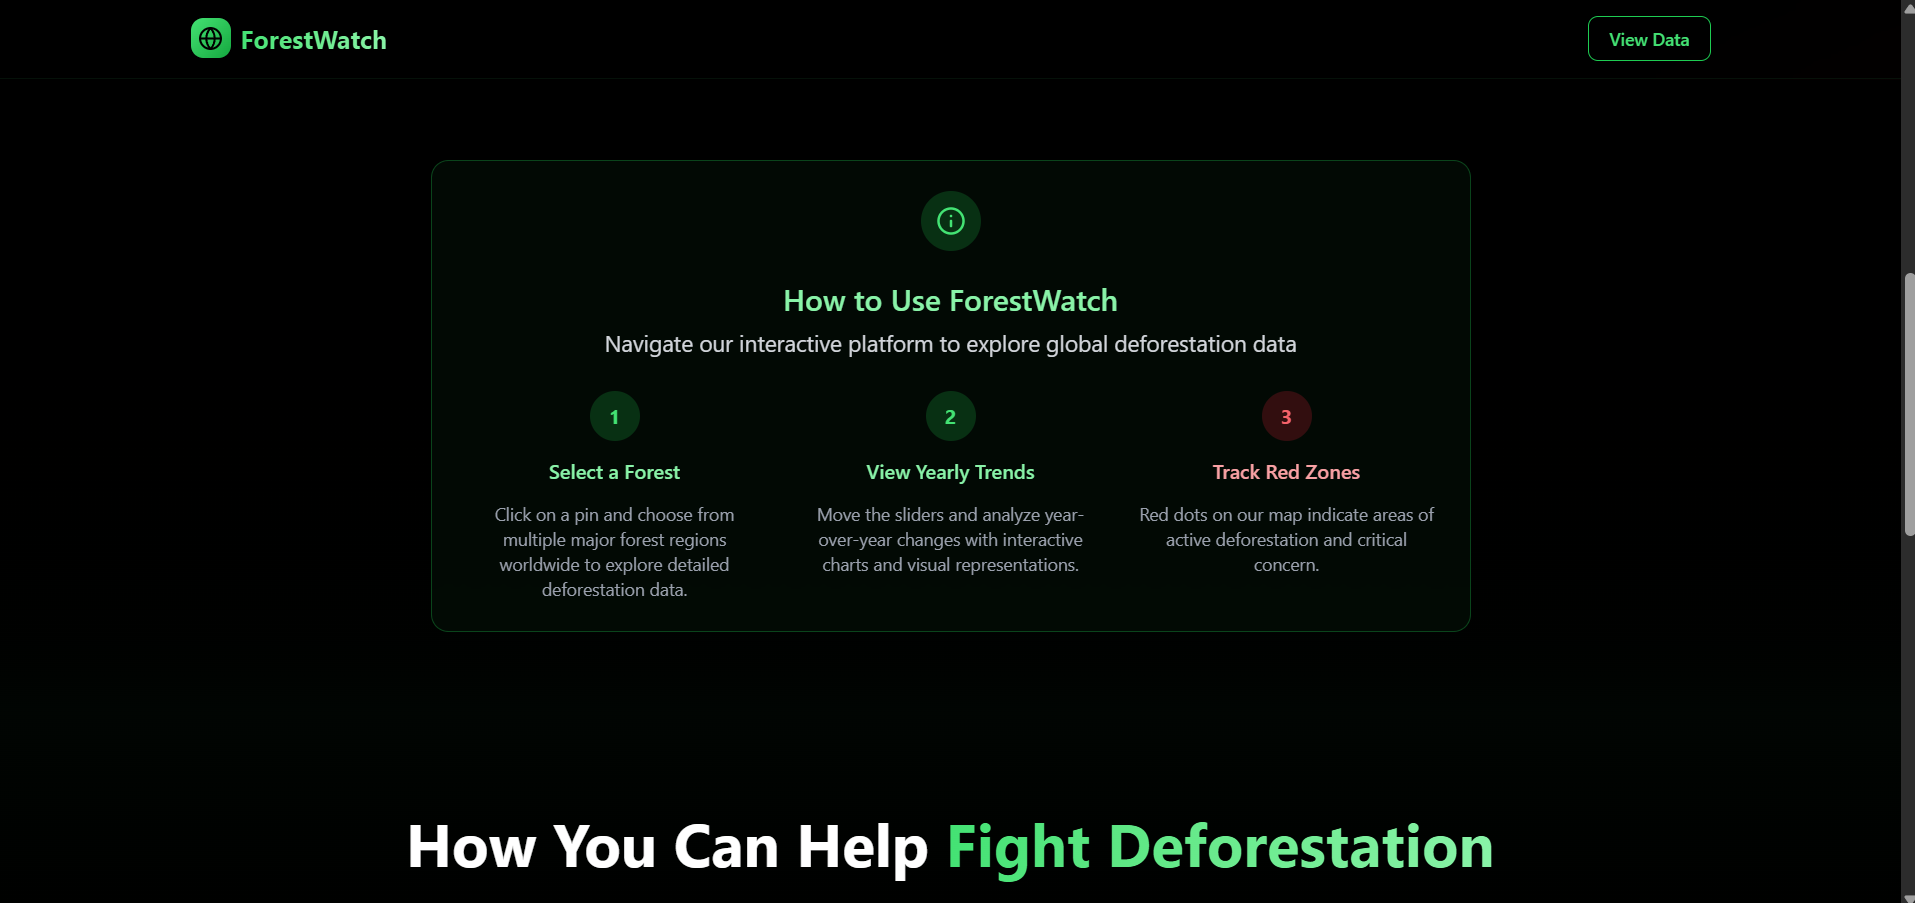
How to Use ForestWatch
-
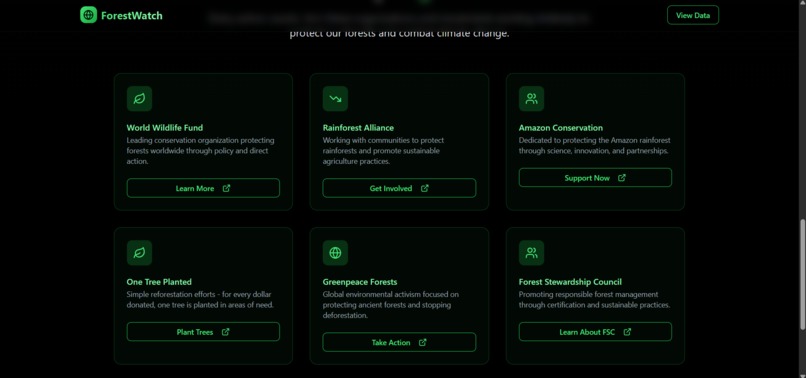
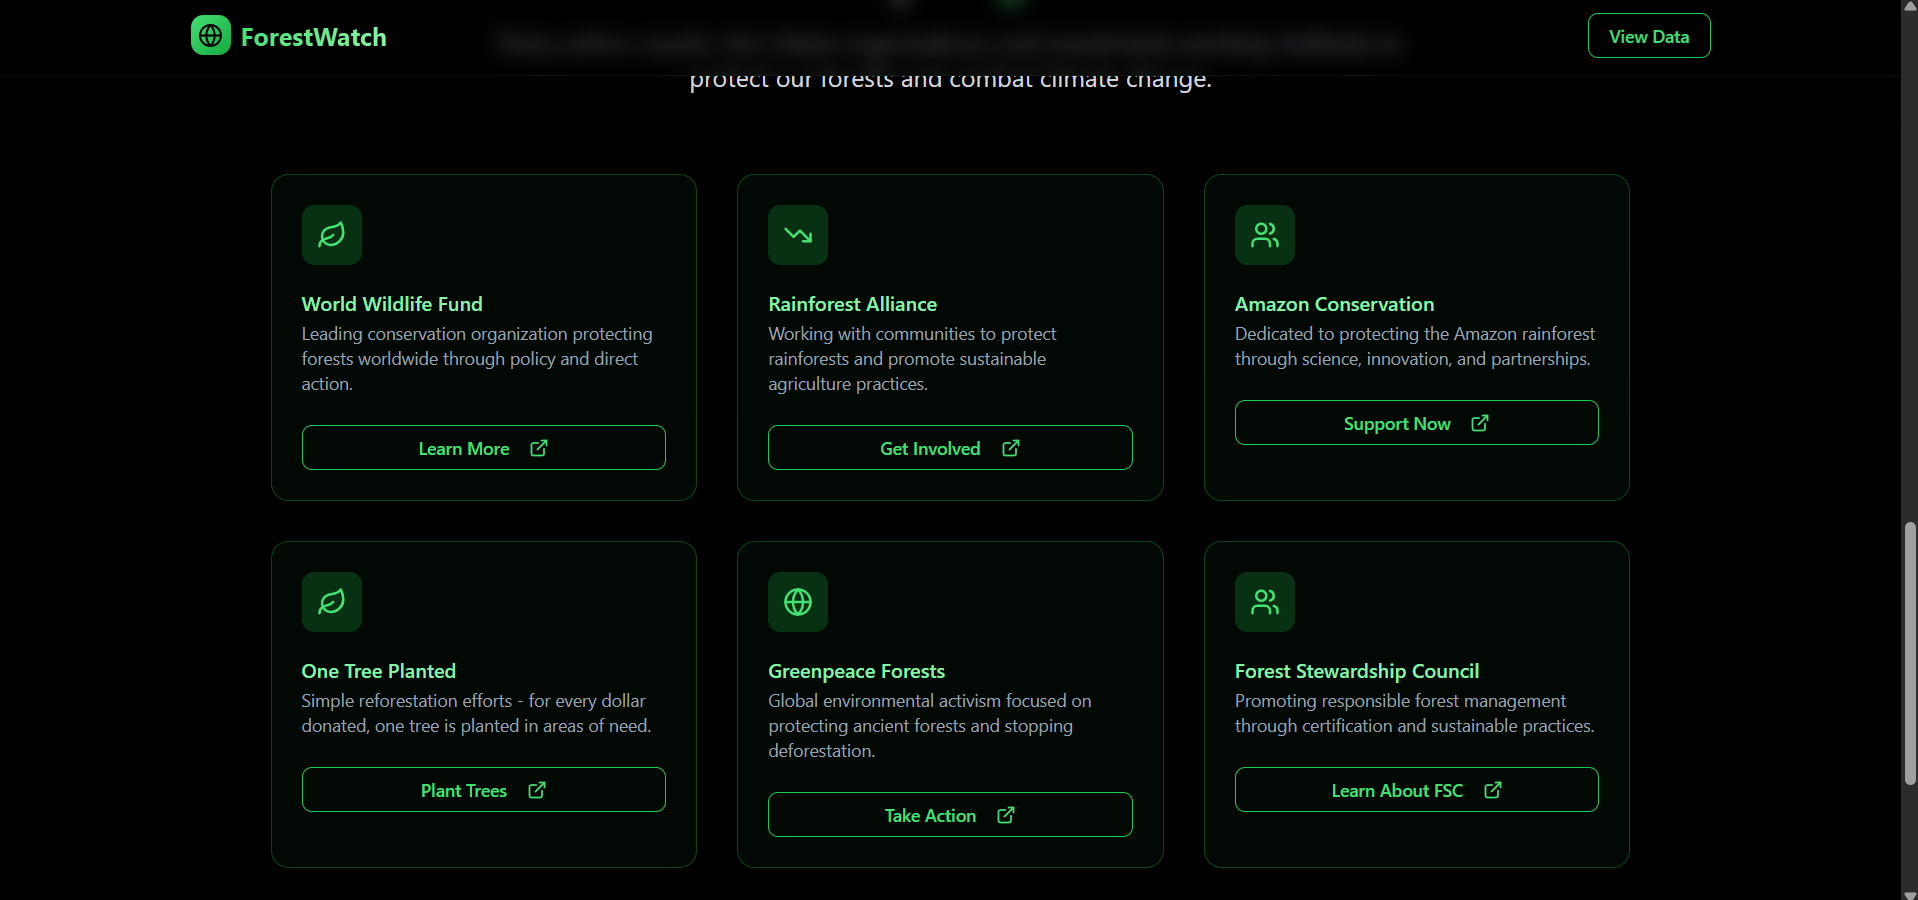
Important sites to combat Deforestation
-
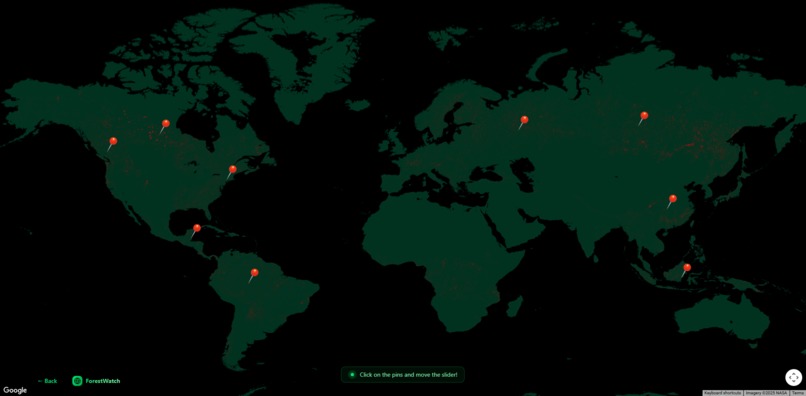
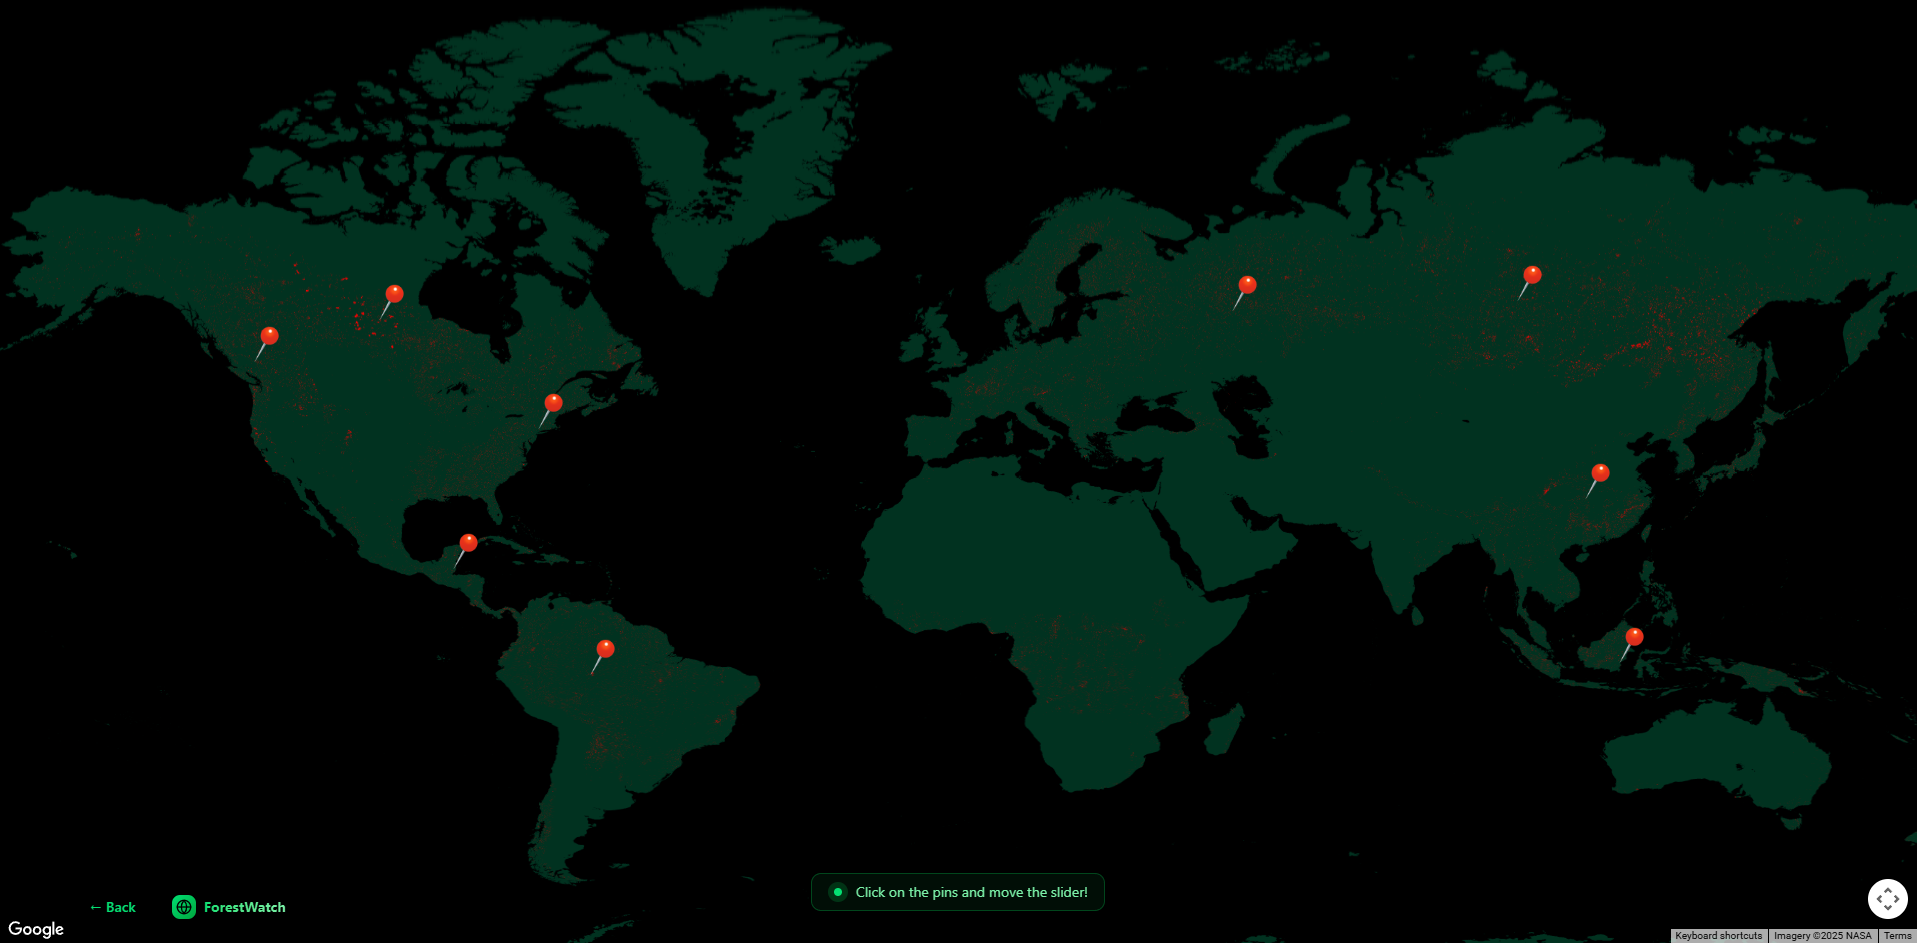
World Map of Data
-
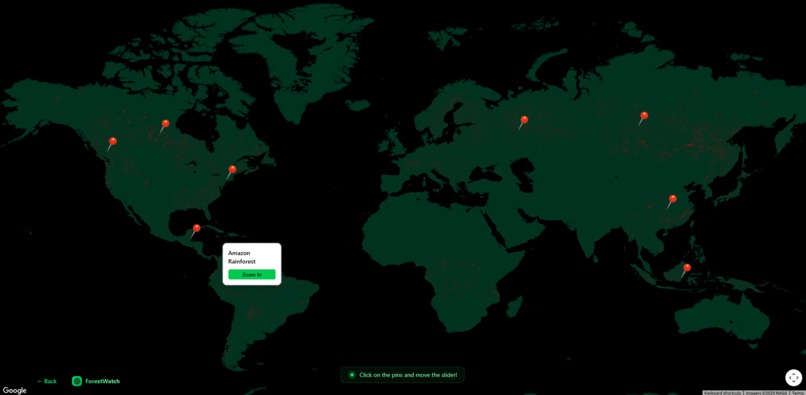
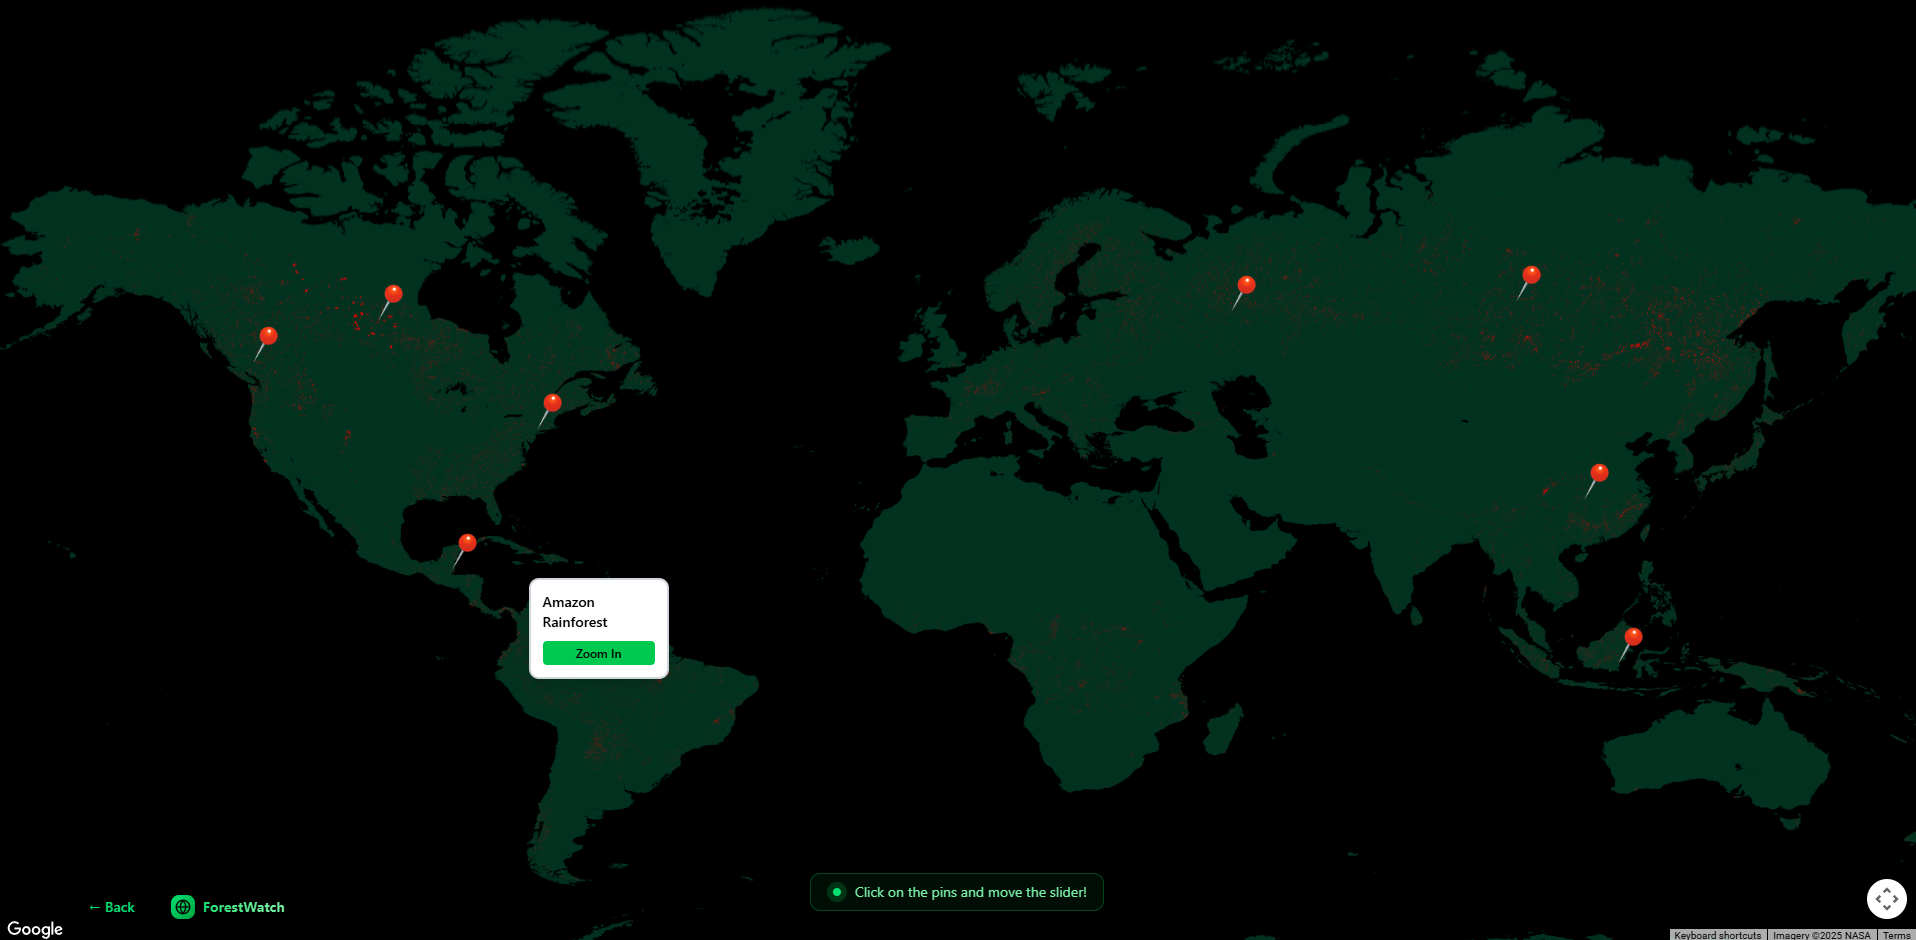
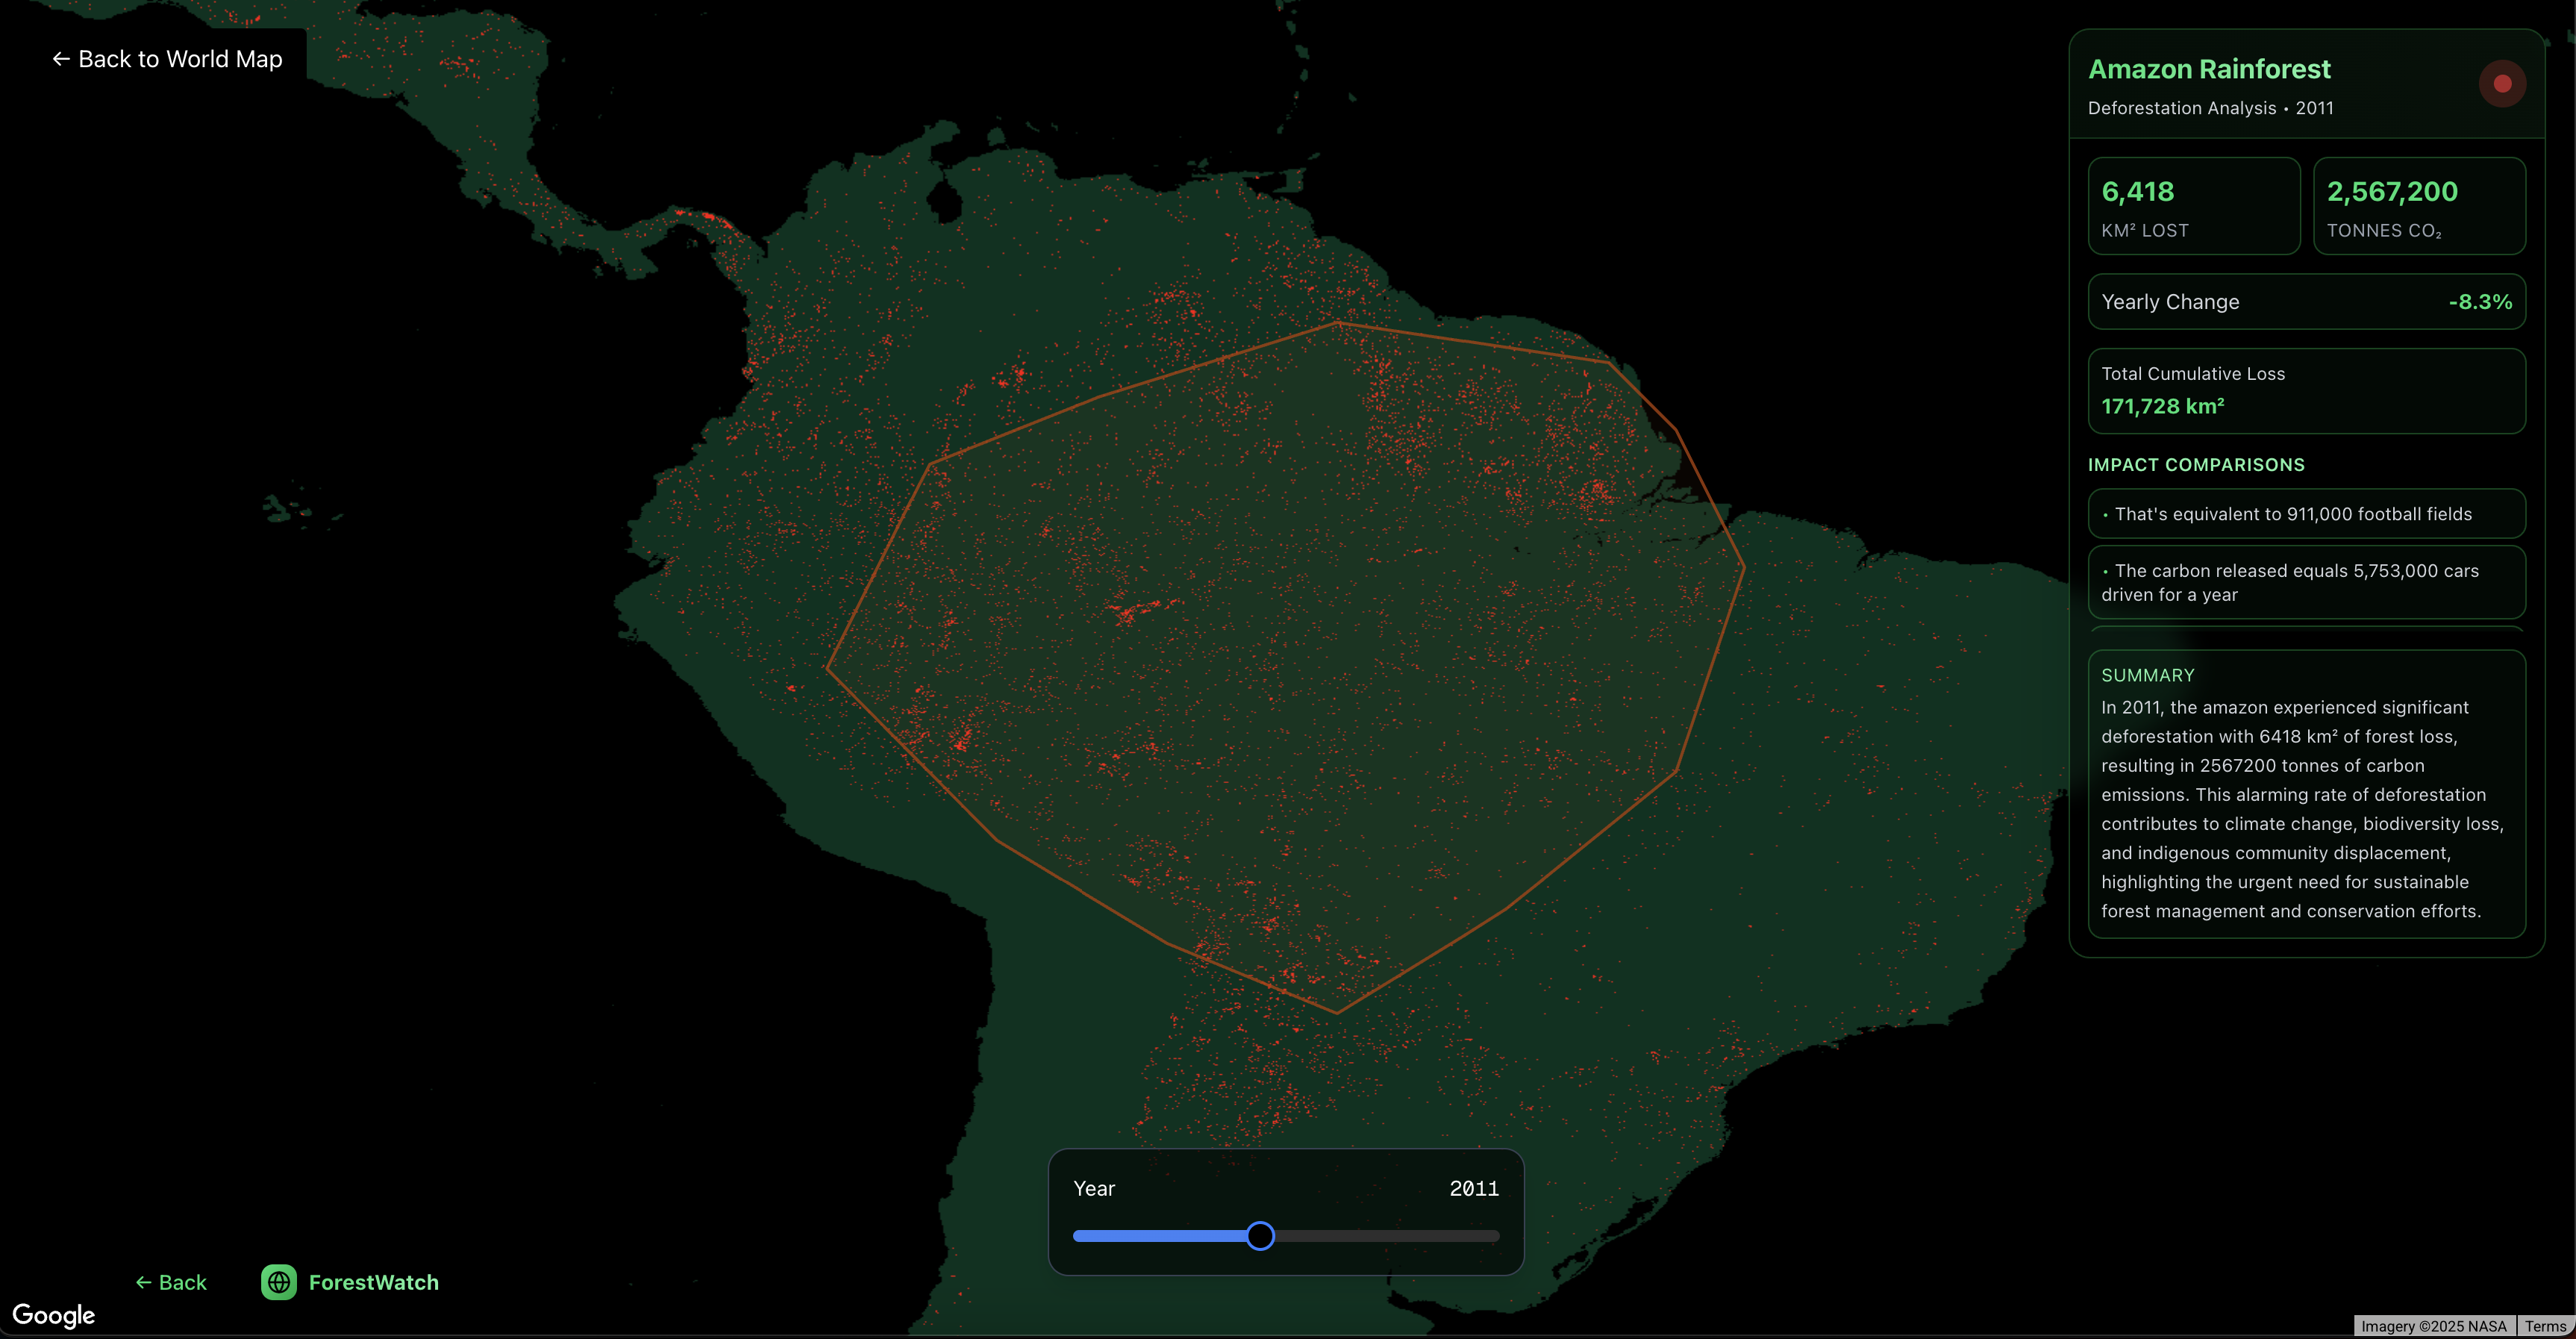
Clicking Amazon Rainforest
-

Amazon Rainforest Example #1
-
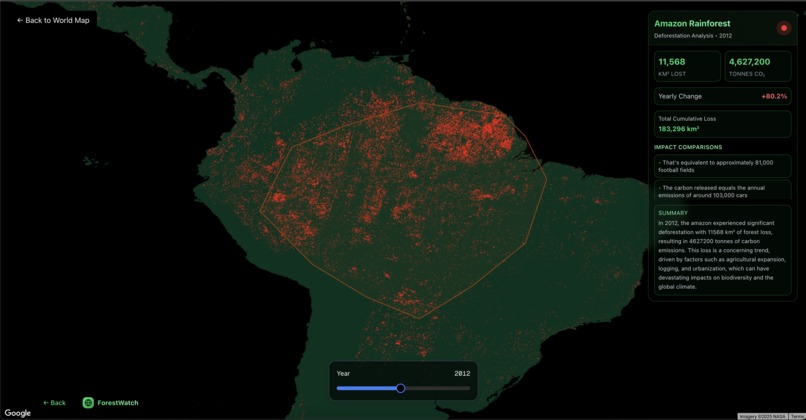
Amazon Rainforest Example #2
-
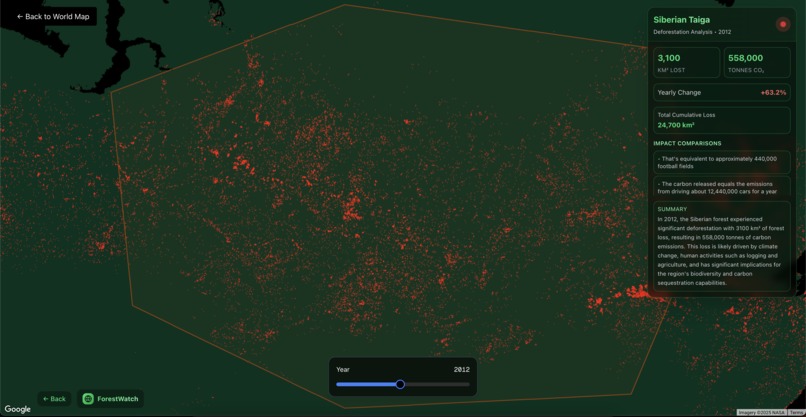
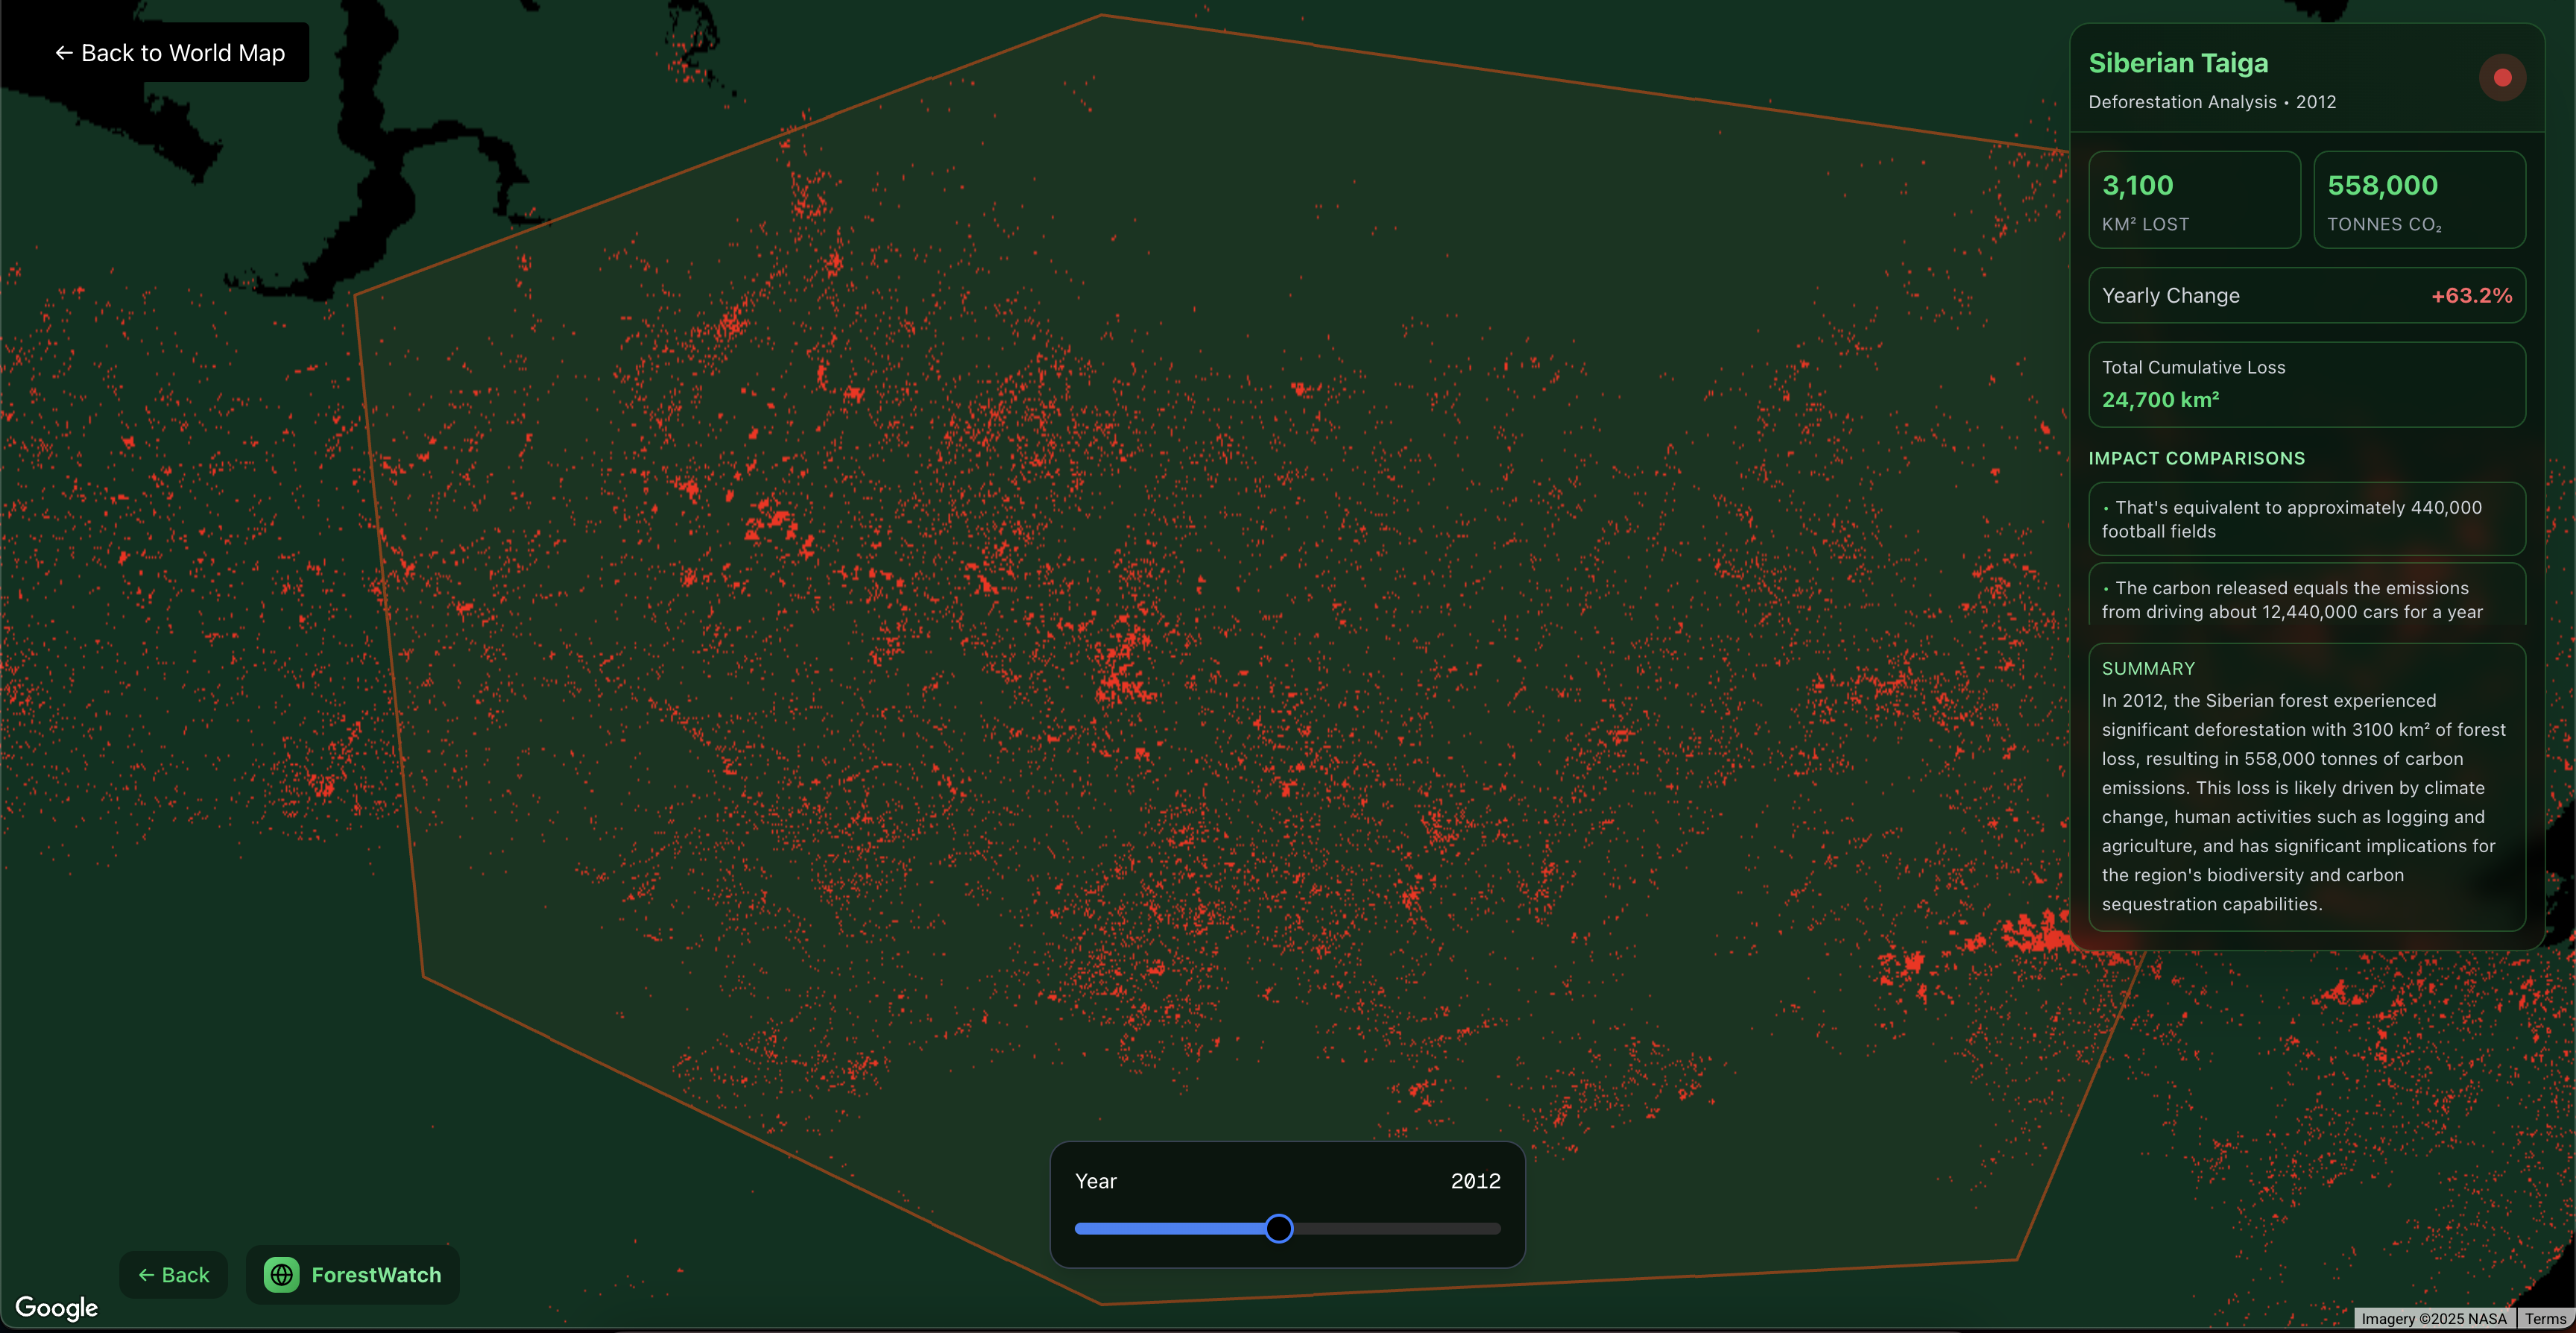
Siberian Taiga Example

Inspiration
ForestWatch was inspired by the urgent need to combat deforestation by raising awareness through technology. Shocking statistics—like the Amazon rainforest losing over 12,000 km² in a single year—motivated us to build a platform that makes forest loss more visible and understandable. We want to empower environmental organizations and inform policymakers through greater awareness.
What it does
ForestWatch is an interactive web platform that visualizes forest loss through a visual data world map. Users can explore regions of the world, view yearly forest loss, and understand deforestation statistics. We overlay real deforestation data (Hansen Forest Dataset) on the Google Maps API, accompanied by contextual stats and comparisons to make the environmental impact more tangible.
How we built it
We built ForestWatch using Next.js as the main framework, with React and TailwindCSS for the UI. The mapping interface is powered by the Google Maps API, where we render custom polygon overlays and region-based statistics. Our core dataset comes from the Hansen Global Forest Change data, which we parsed and processed through the Google Earth Engine Code editor. We integrated API calls to LLMs to analyze deforestation patterns and provide insight into the current year’s forest loss. Performance and usability were top priorities—we implemented overlay optimizations and zoom/pan restrictions to ensure that layers load smoothly and interactions remain intuitive.
Challenges we ran into
One major challenge was working with the scale of the dataset—millions of square kilometers of forest loss data across multiple years. Rendering this efficiently on the frontend required filtering and pre-processing the Hansen Global Forest Change dataset into a visual format and memoizing React components to maintain performance. We also faced difficulties deploying the application due to conflicting methods of loading the Google Maps API. Some versions caused delays or incorrect rendering of overlays, and we had to resolve glitches between our polygon layers and the underlying base map. These deployment and integration issues were some of the most time-consuming but ultimately helped us understand how to manage complex third-party APIs in production environments.
Accomplishments that we're proud of
We successfully turned a massive scientific dataset into a usable, intuitive web tool. We’re especially proud of how we visualized complex environmental data in a way that’s easy-to-use for everyday users, while still being grounded in real research.
What we learned
We gained experience in working with geospatial datasets and optimizing large-scale map rendering in the browser. From a technical side, we became much more comfortable with the Google Maps API (especially working with overlays), interactive UI design, and performance optimization in React and Next.js, as well as deployment.
What's next for ForestWatch
First, we plan to add every major forest region in the world to the project. We also plan to expand ForestWatch with more layers, including reforestation data, fire alerts, and community-reported observations. Eventually, we want to open the platform to educators and local governments to help turn awareness into action. Lastly, we hope to build deforestation prediction models that can showcase potential dangers unless action is immediately taken.
Built With
- gemini
- google-maps
- groq
- hansen-global-forest-change-dataset
- next.js
- react
- shadcn
- tailwind
- typescript
- vercel


Log in or sign up for Devpost to join the conversation.