Inspiration
The global climate crisis has turned our forests into tinderboxes. In regions like the Harz, drought and pest infestations (like the bark beetle) are destroying ecosystems faster than manual monitoring can keep up with. We were inspired by the idea of "Forensic Forestry" using satellite data and Artificial Intelligence to detect "hidden" stress in trees before they even turn brown to the human eye, potentially preventing catastrophic wildfires and total habitat loss.
What it does
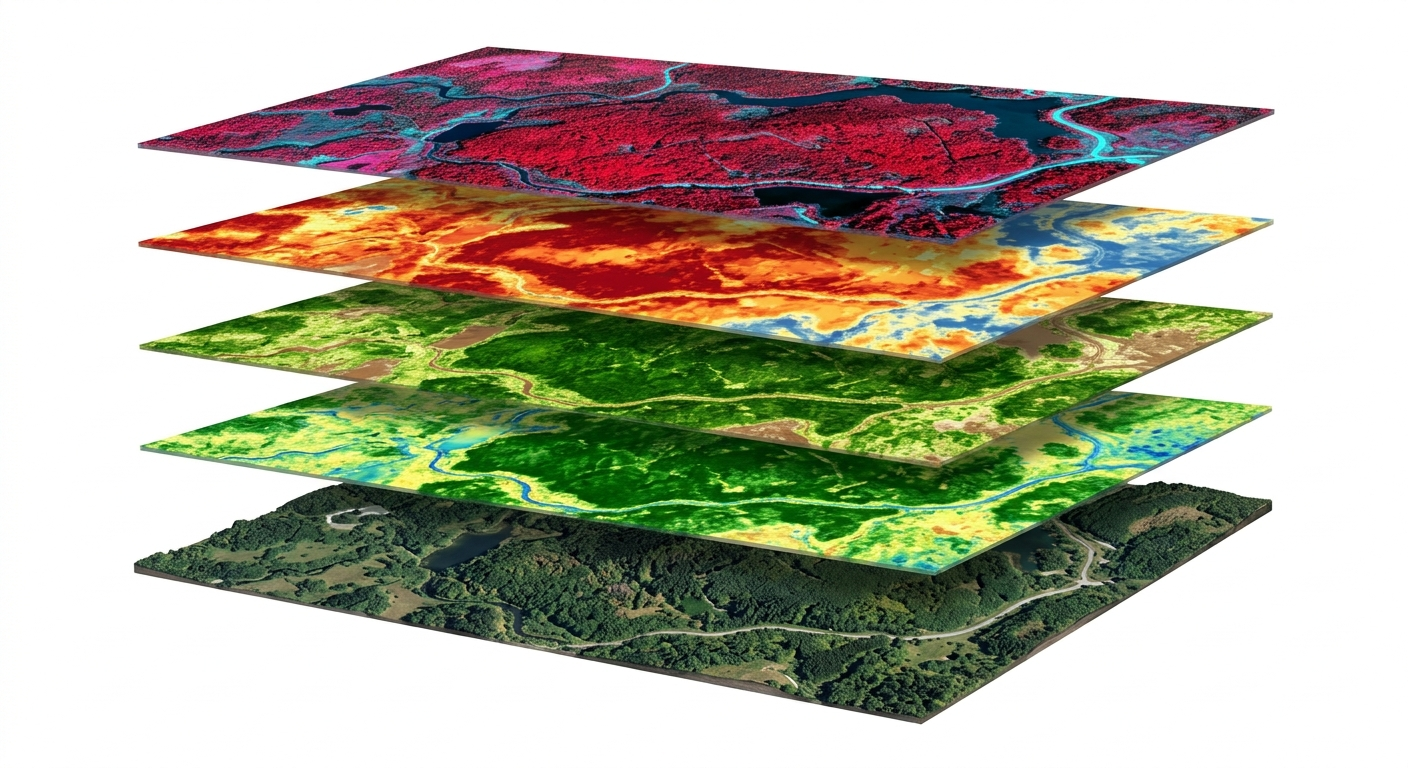
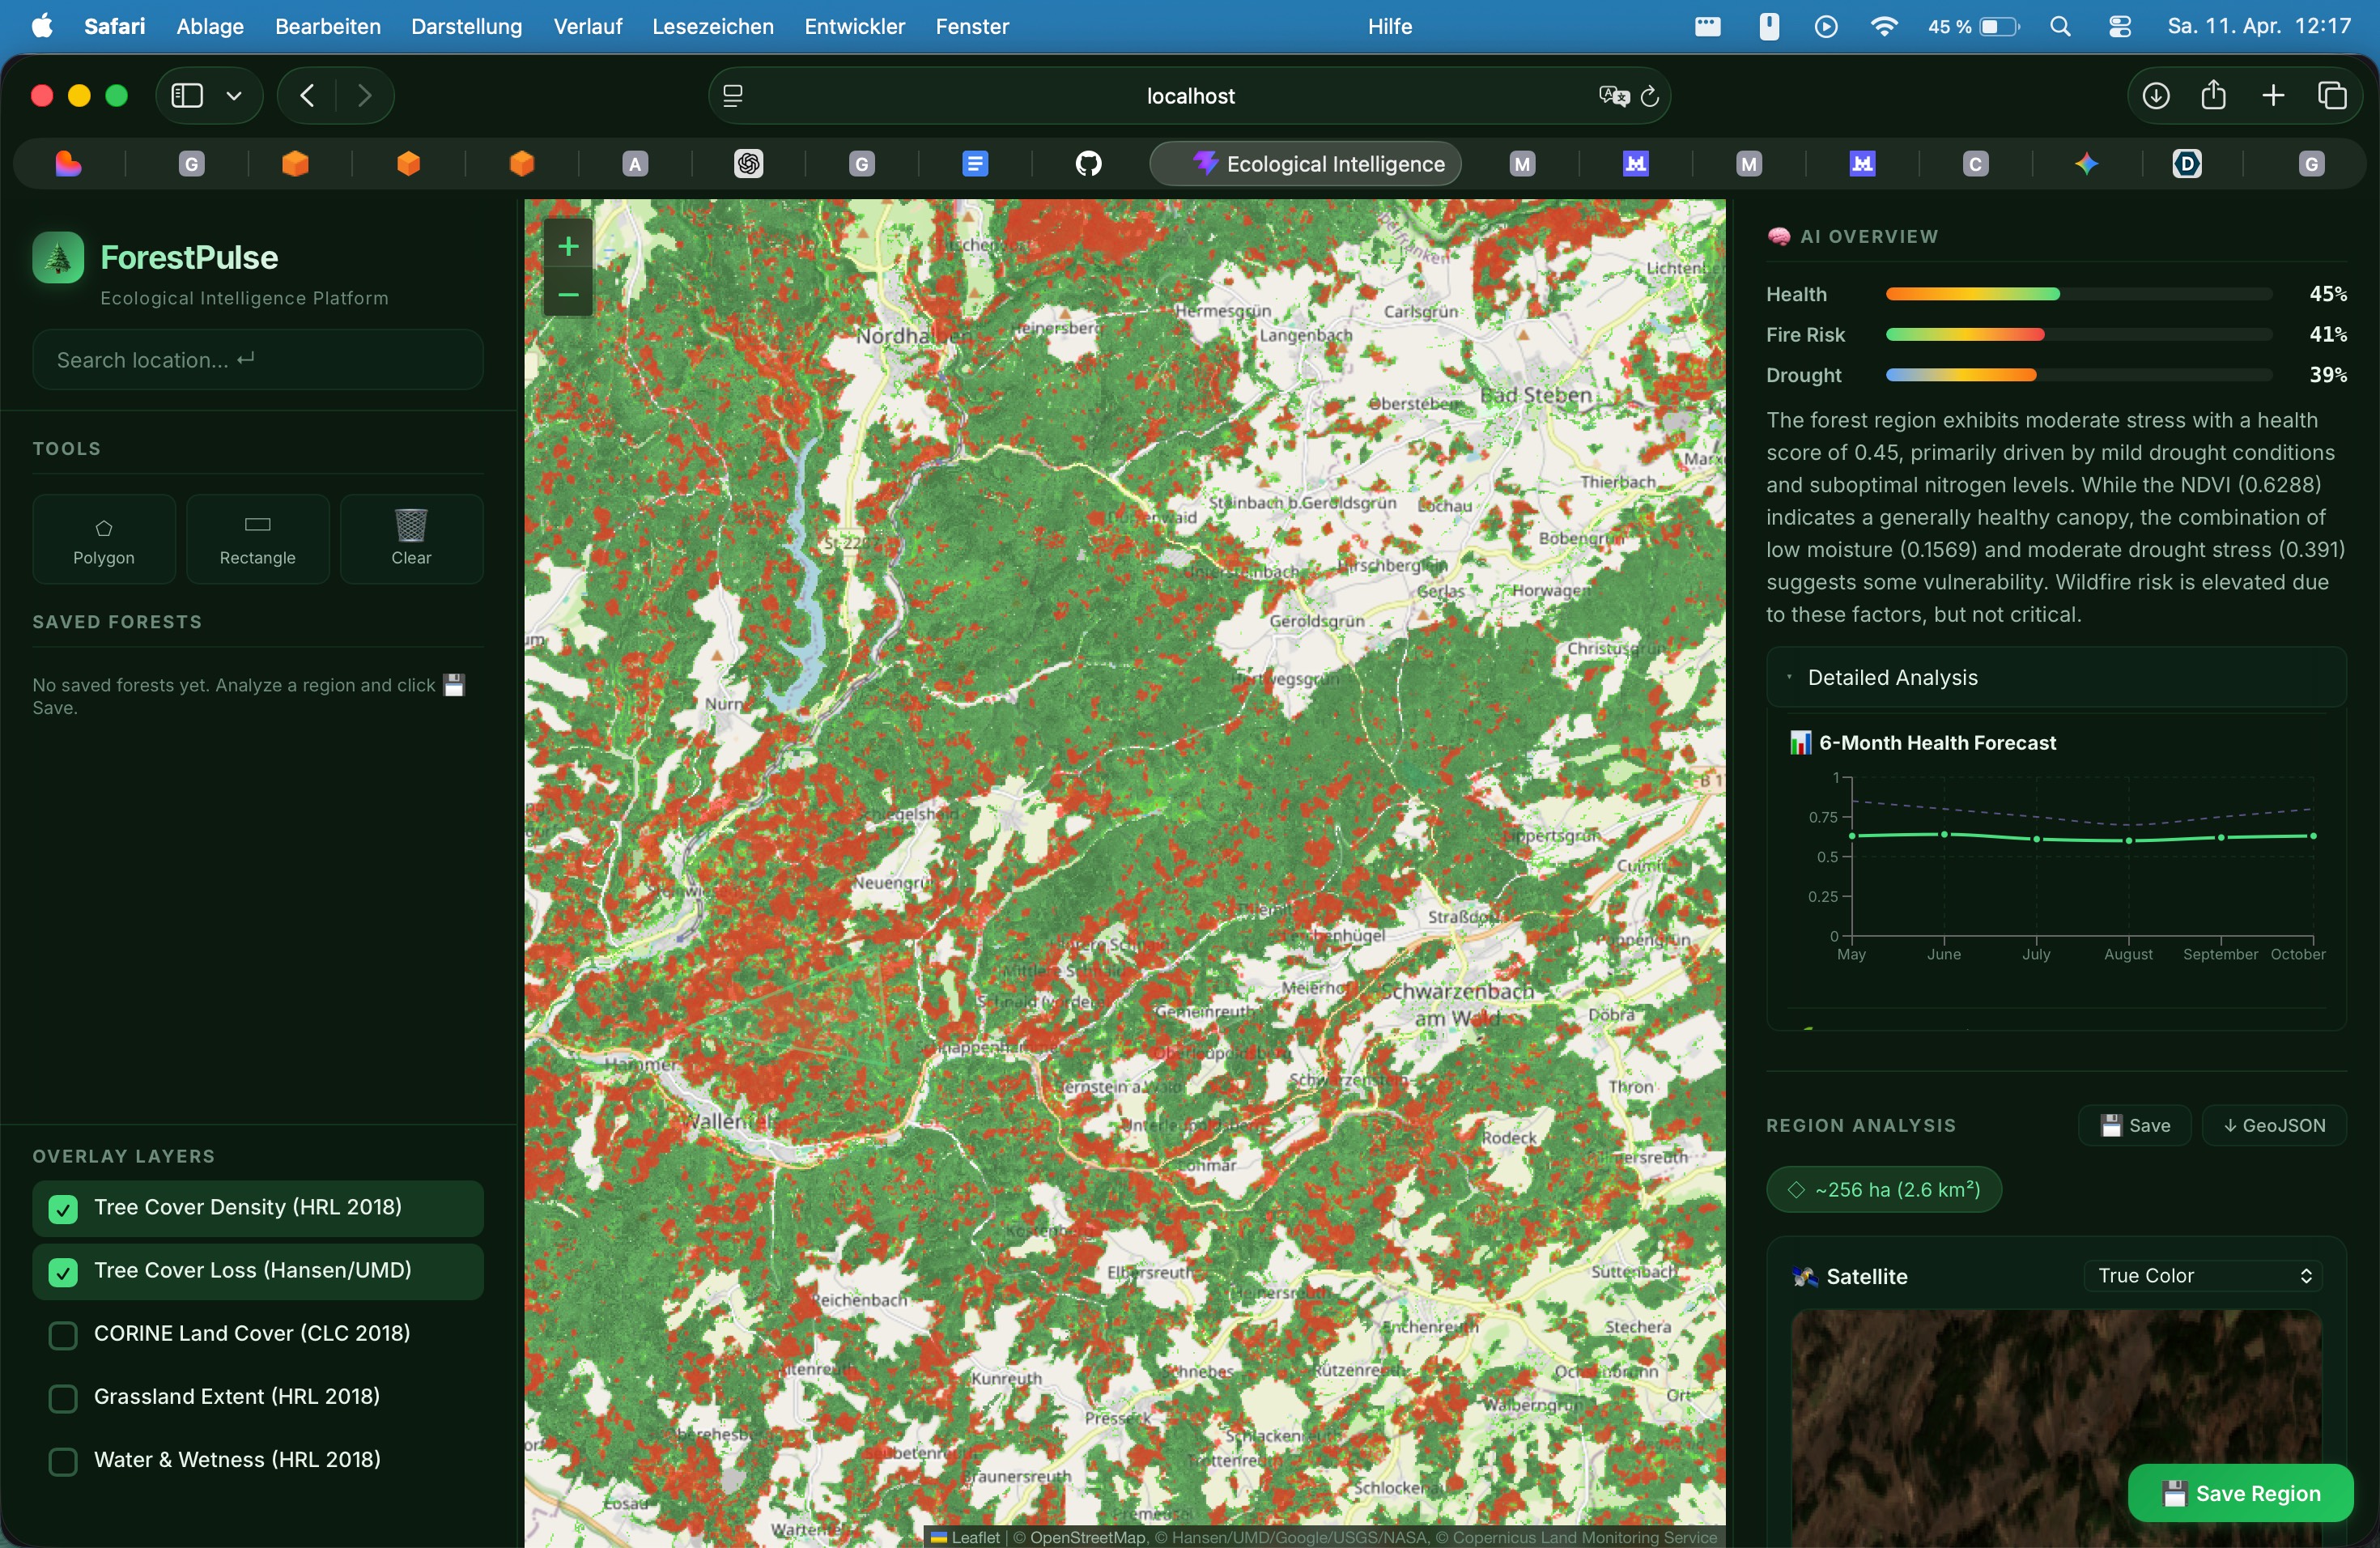
ForestPulse is an advanced environmental intelligence platform that monitors forest health using multi-spectral satellite data. It doesn't just look at "greenness", it analyzes deep-layer data like fuel moisture (NDWI), biomass density (EVI) and nutrient stress (NRI). By stacking these layers, ForestPulse predicts wildfire risk zones, health status, co2 potential, stress indicators, etc. It allows foresters and environmental agencies to visualize their land as a digital twin, providing actionable insights into where the forest is healthy and where it is at risk of flatlining.
How we built it
We used different layers to ensure sophisticated and precise resuts:
Data Acquisition: We integrated the EU Copernicus/Sentinel Hub API, NASA GBIF and OpenWeather Agro API to fetch real-time multi-spectral imagery and historical weather data.
Geospatial Processing: We used GeoJSON polygons and process raw GeoTIFF data from Copernicus CLMS.
Indices & ML: We calculated custom indices (NDVI, EVI2, NDWI, DSWI) and fed them into a Machine Learning pipeline to predict forest stress levels. We used a gradient boosted regression model with 3 outputs and 100 decision trees each to create ruleset-applied results and fed them into Mistral AI to analyze and evaluate based on scientific thresholds (Rouse et al. 1974, Gao 1996).
Challenges we ran into
Data Normalization: Satellite data from different sources often comes in various shapes. That's why we normalized the data to the GeoJSON format.
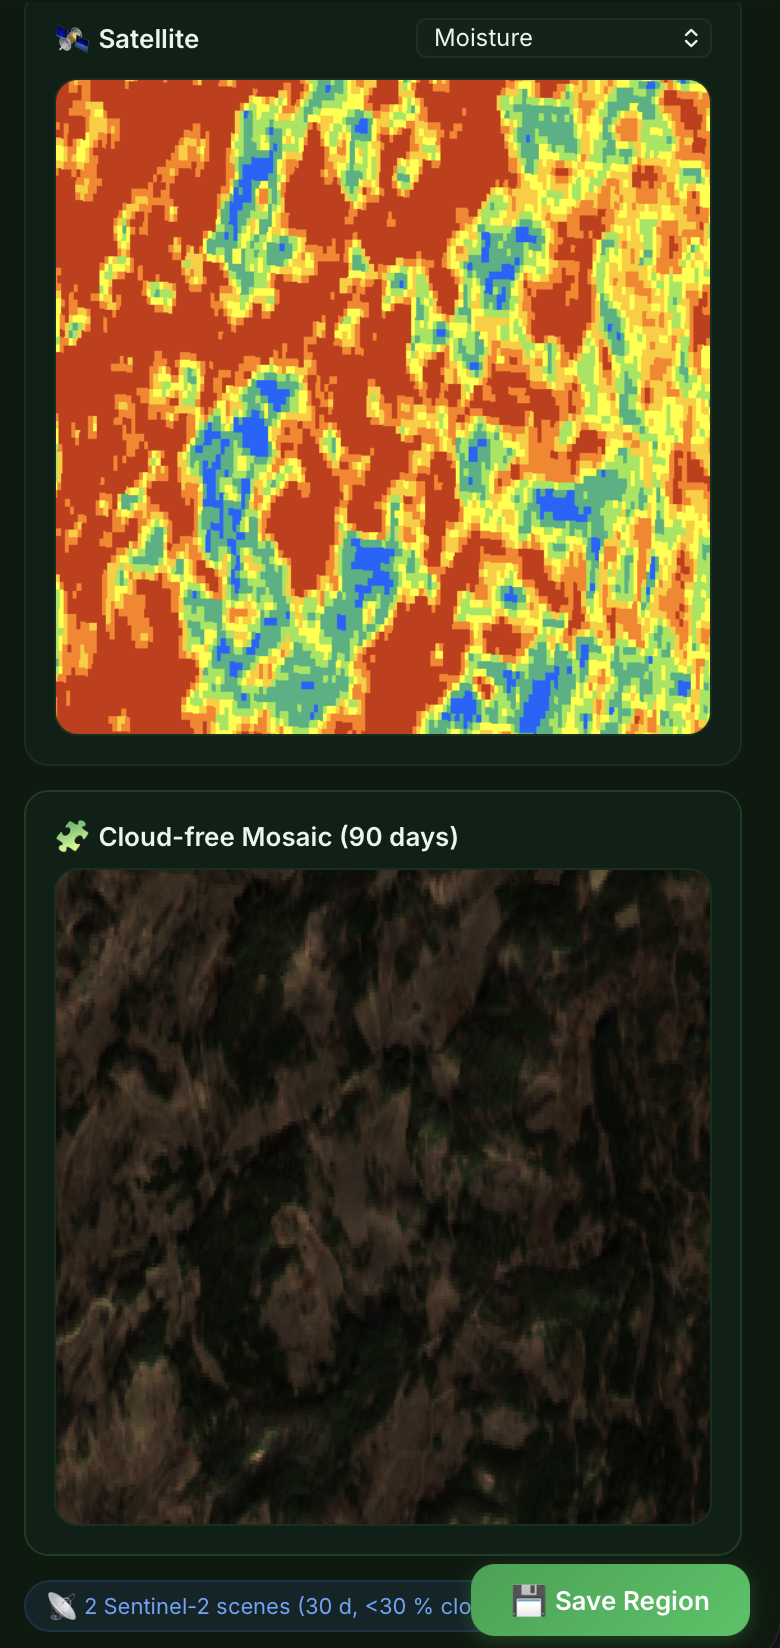
Cloud Interference: Dealing with cloud cover in optical imagery required us to implement temporal filtering to find the cleanest "scene" within a specific time window by selecting the satellite images with the least clouds.
API Limits: Staying within the 1000-hectare limit for free-tier Agro APIs forced us to be careful with our polygon selections, ensuring we chose the most ecologically significant 200-hectare plots for our demo.
Accomplishments that we're proud of
Developing an idea to safe environmental habitats, helping governments, forest owners to preserve biodiversity and monitor Co2.
Multi-Layer Visualization: Successfully creating a layer view that makes complex satellite data understandable for non-experts.
Scalable Architecture: Building a system that can handle GeoJSON inputs for any forest coordinate on Earth (depending on the payment tier for APIs).
What we learned
We gained a deep understanding of Remote Sensing and the physics of light reflection. We learned that a forest can look healthy in true RGB color while being critically dehydrated in the "Short-Wave Infrared" spectrum. On the technical side, we mastered the manipulation of high-dimensional arrays for environmental modeling and the intricacies of OGC web services like WMS and WCS.

Log in or sign up for Devpost to join the conversation.