Inspiration
Deforestation and forest loss can be extremely difficult to track because it usually takes place across large areas that are remote. Trying to compare satellite images manually makes it extremely hard to see environmental changes. The goal of ForestLens is to show people how our planet is changing by turning satellite images into something anyone can actually understand, making environmental damage visible, clear, and impossible to ignore.
What it does
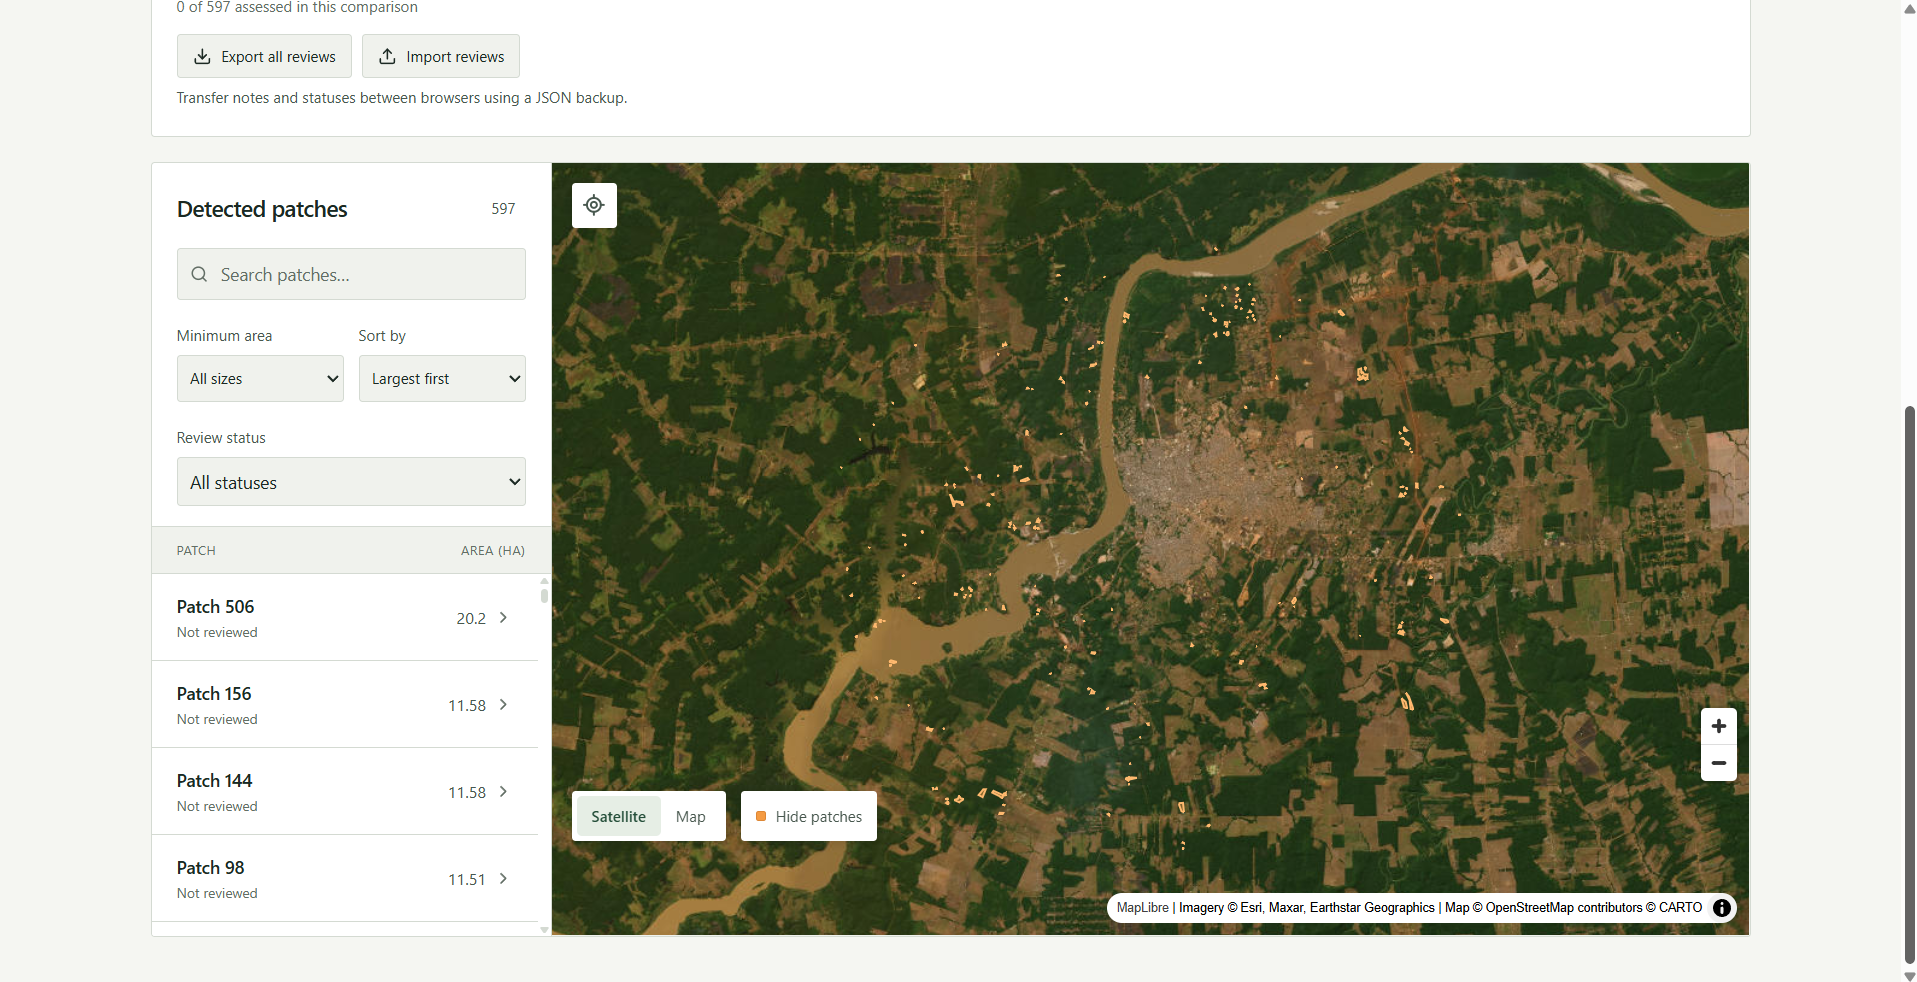
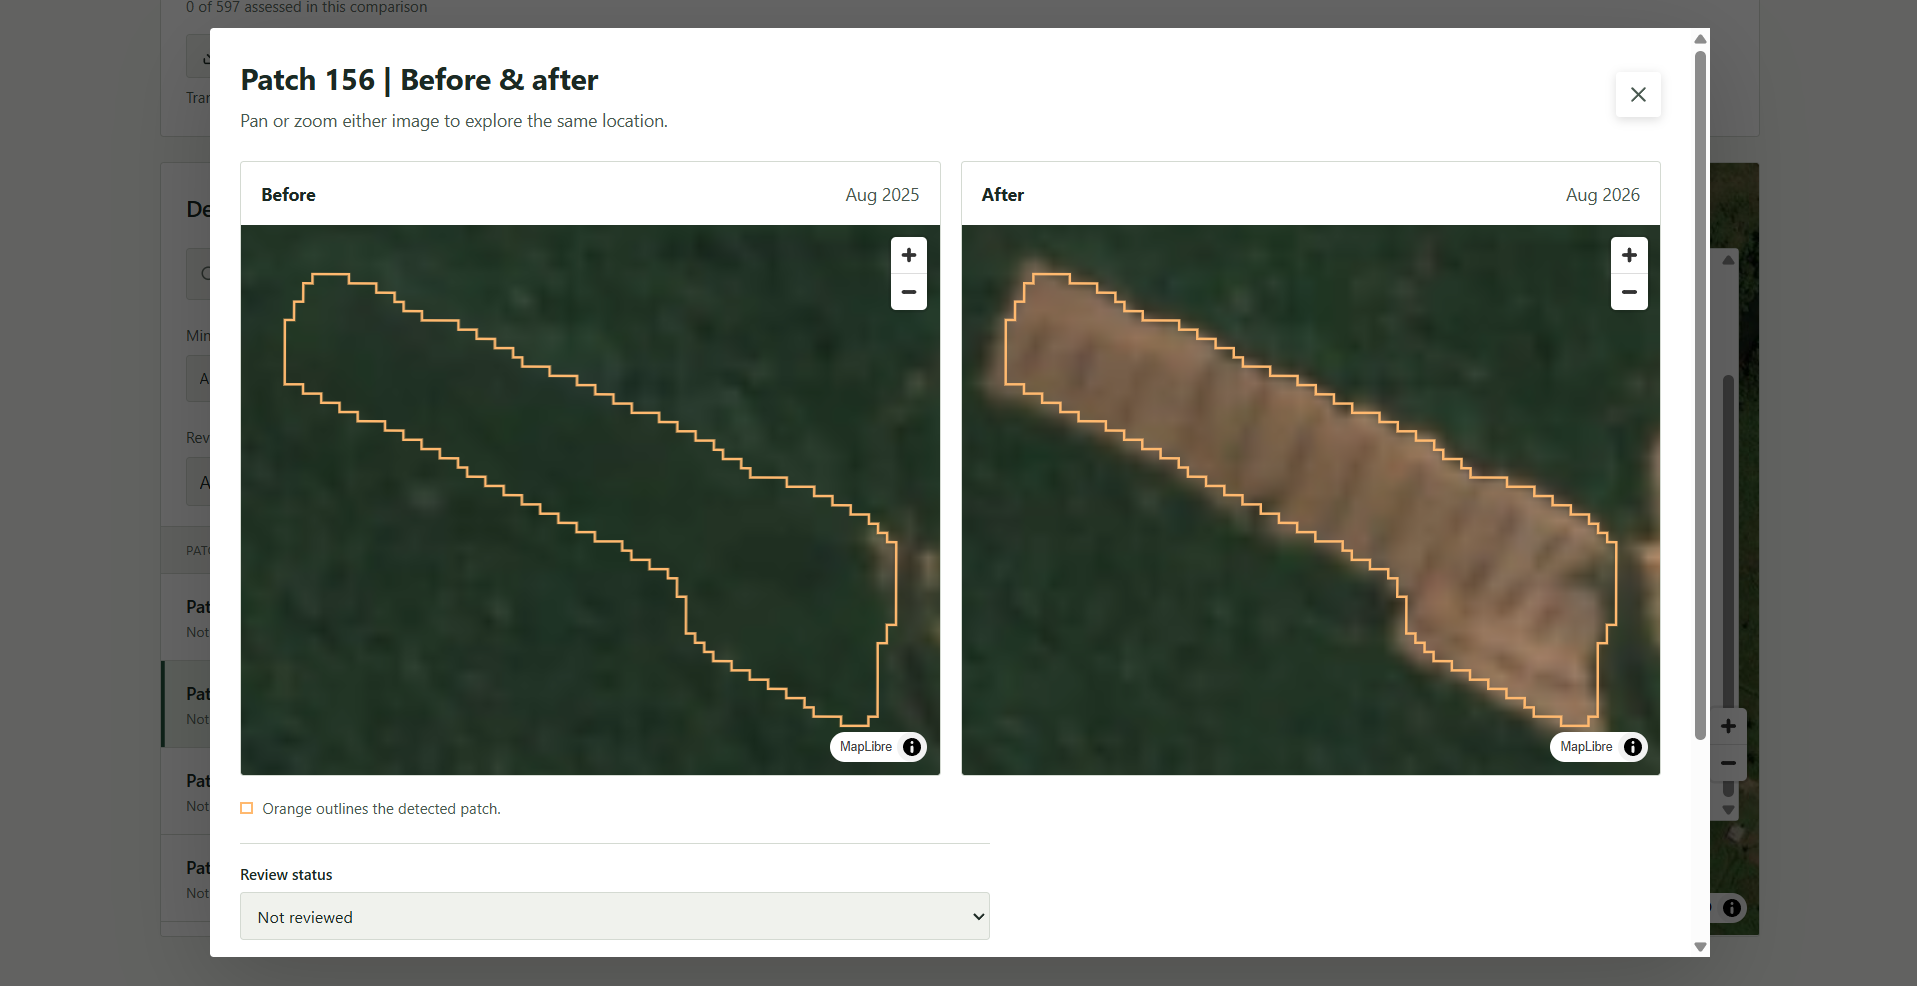
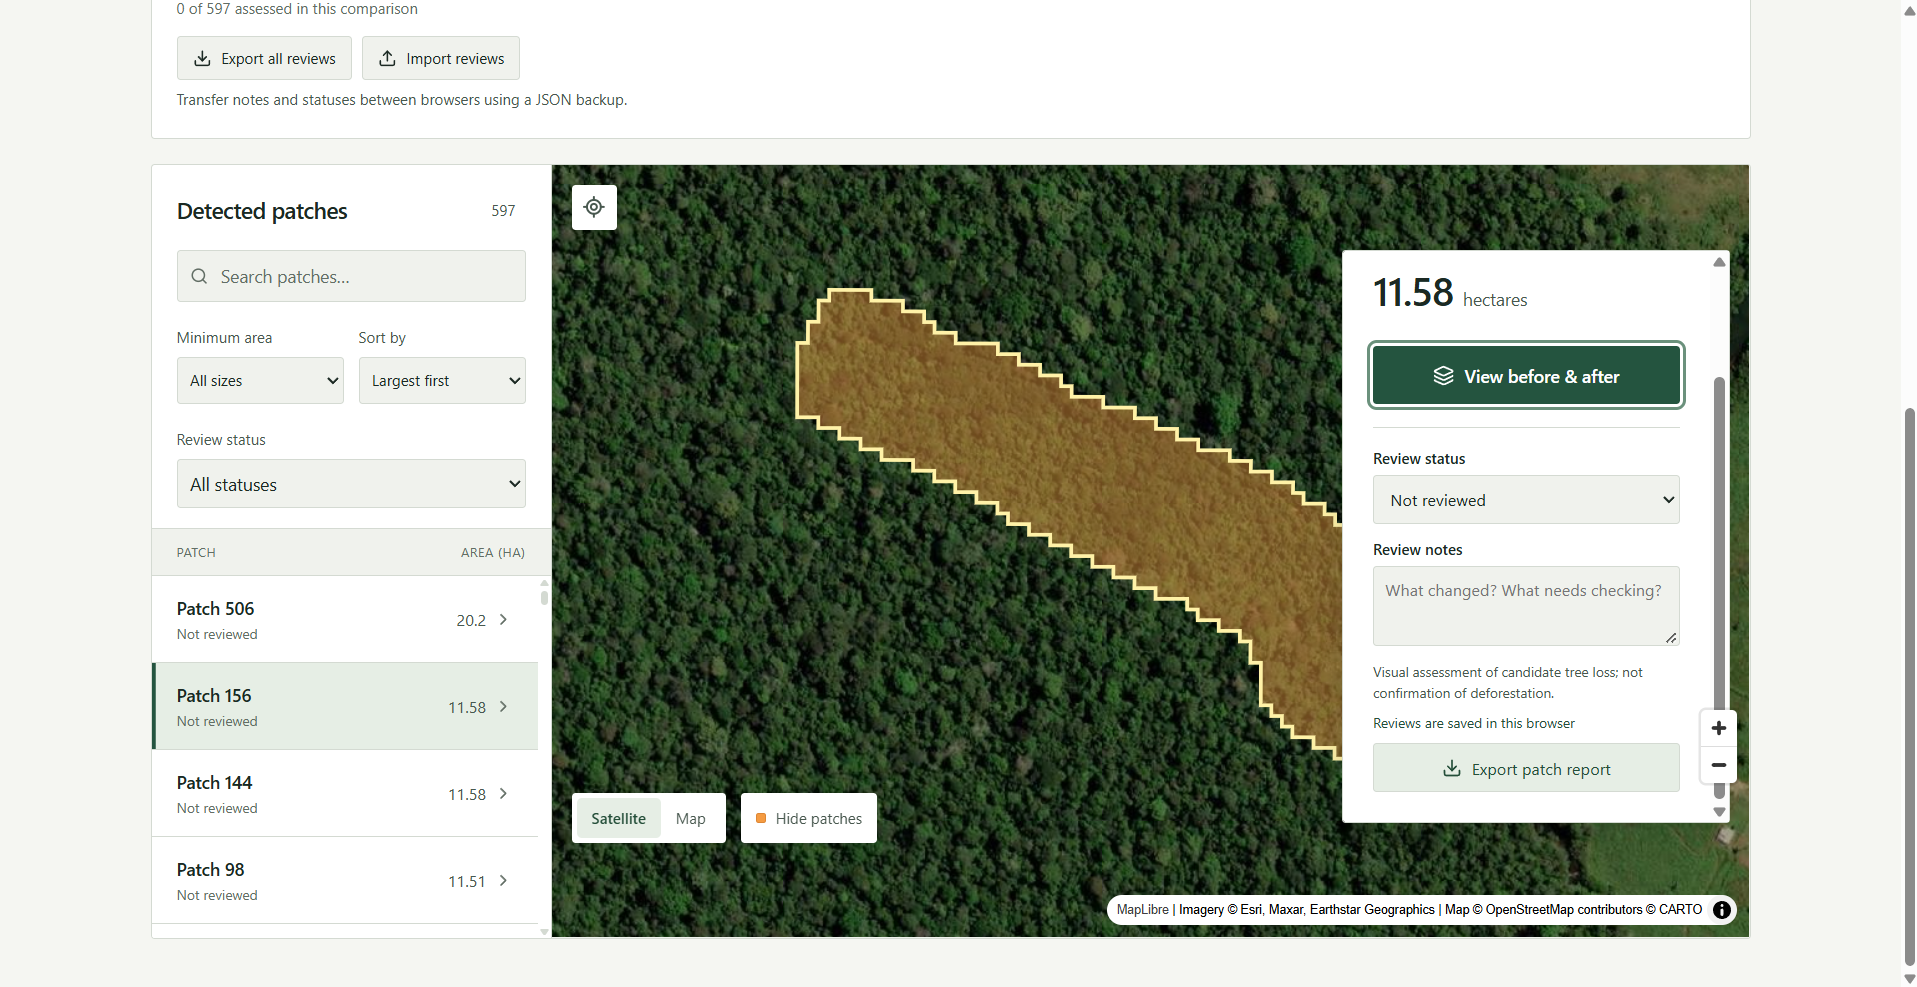
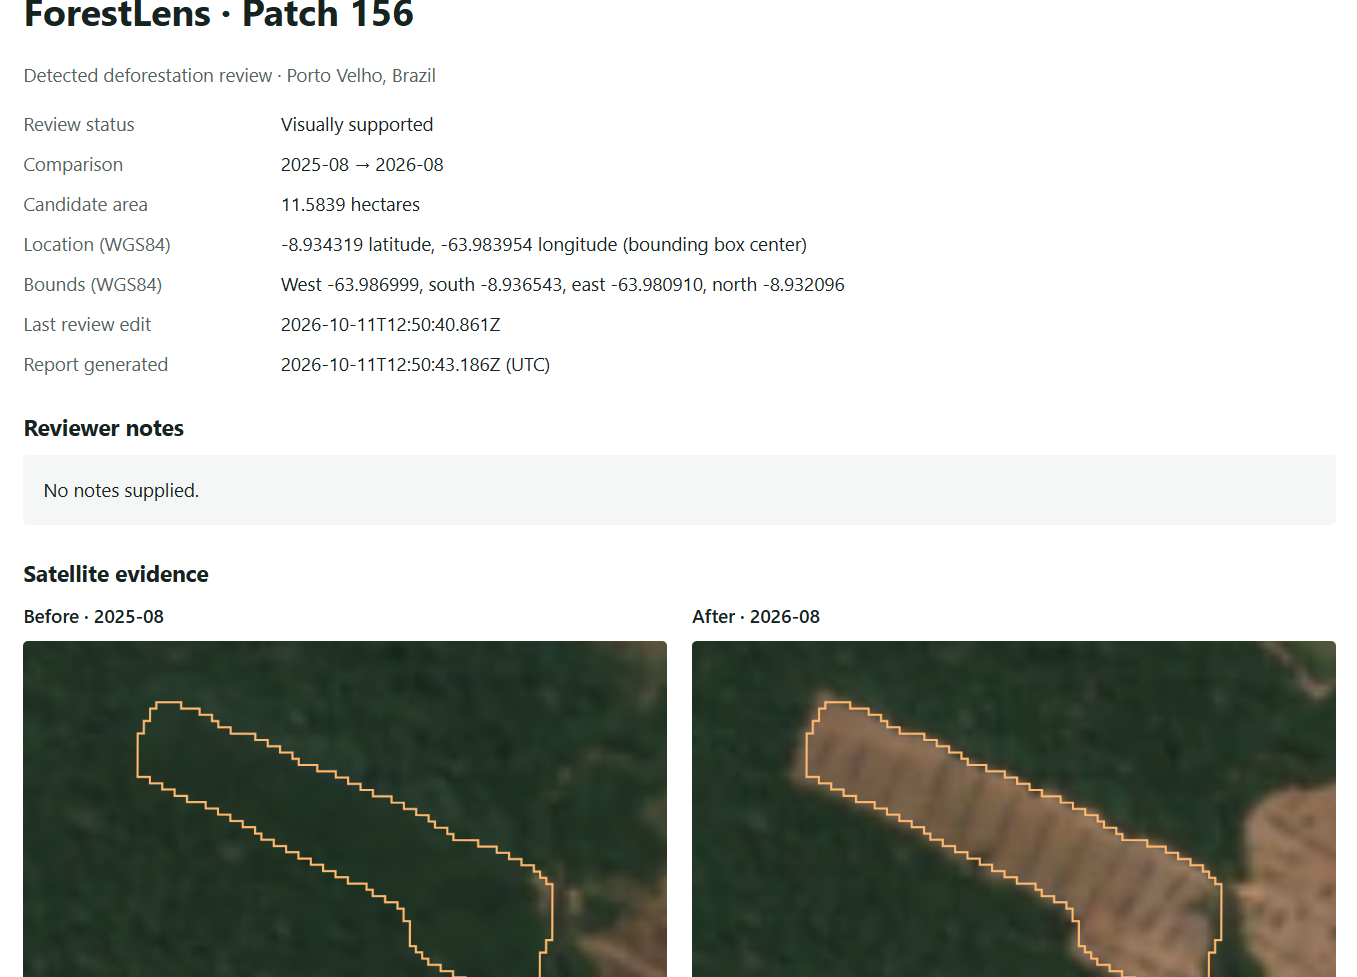
ForestLens uses satellite images as well as change detection technology to analyze the presence of trees in the Brazilian Amazon across multiple years, as detected by a machine learning model. Instead of relying on single snapshots, which can include confounding variables like cloud shadows, droughts, or seasonal issues, the code compares composites (essentially the median of pixel values over all days in a month) of 2 months, spaced roughly 1 year apart. It predicts the presence of trees, marking an area as deforested if one year has a predicted probability of tree presence greater than 60% that there are trees and the next has a probability less than 50%, with more than a 30 percentage point drop between snapshots. The technology highlights areas where deforestation was detected and visualizes these changes on an interactive map, allowing users to pick a location, choose two dates, and review time comparisons, detected loss patches, and total hectares lost. Users can also add their own labels and notes about an area and export them to share with each other.
Our system gets 92.5% accuracy across a manually labeled set of the 5 largest patches per time period, as well as 5 randomly selected 1 hectare patches per time period (20/20 and 17/20 accuracy respectively).
How we built it
Backend and Analysis: Built using Google Earth Engine to process the tree detection labels from the Dynamic World dataset, extract connected loss patches, and produce composites of Sentinel-2 satellite imagery. We also filtered for start and end months occurring during Brazil's dry season to reduce seasonal differences between snapshots. Frontend and Deployment: Developed a web application interface featuring dashboard metrics like time comparisons, detected tree loss in hectares, loss patch counts, a search tool for specific patches, and features to share analysis of deforested patches.
Challenges we ran into
Data and Environmental Noise: Raw satellite snapshots alone are not a sustainable source of information because they can include confounding variables like cloud shadows, droughts, or seasonal issues, requiring us to select start and end dates that minimize these factors. Environment Setup: We encountered technical setup hurdles during development, such as managing directory structures and repository paths. Feature Scope: We wanted to add a continuous slider to show evolution over each day, but were not able to integrate it into the UI in the hackathon timeframe.
What we learned
We learned how to process and analyze multi-year satellite imagery using change detection logic. We gained experience in turning complex geographic data into an understandable web dashboard interface.
What's next for ForestLens
Expanding Scale: Expanding the project's geographic scope from just the city of Porto Velho, Brazil (located in the Amazon Rainforest) to cover the entire continent of South America and potentially the world. Improved Models: Building more precise models that are less easily fooled by clouds or smoke. UI Enhancements: Successfully adding the timeline slider feature to the interface. Getting Beta Testers: Having scientists tell us what features could be added or improved.
Built With
- google-earth-engine
- react
- vercel

Log in or sign up for Devpost to join the conversation.