Inspiration
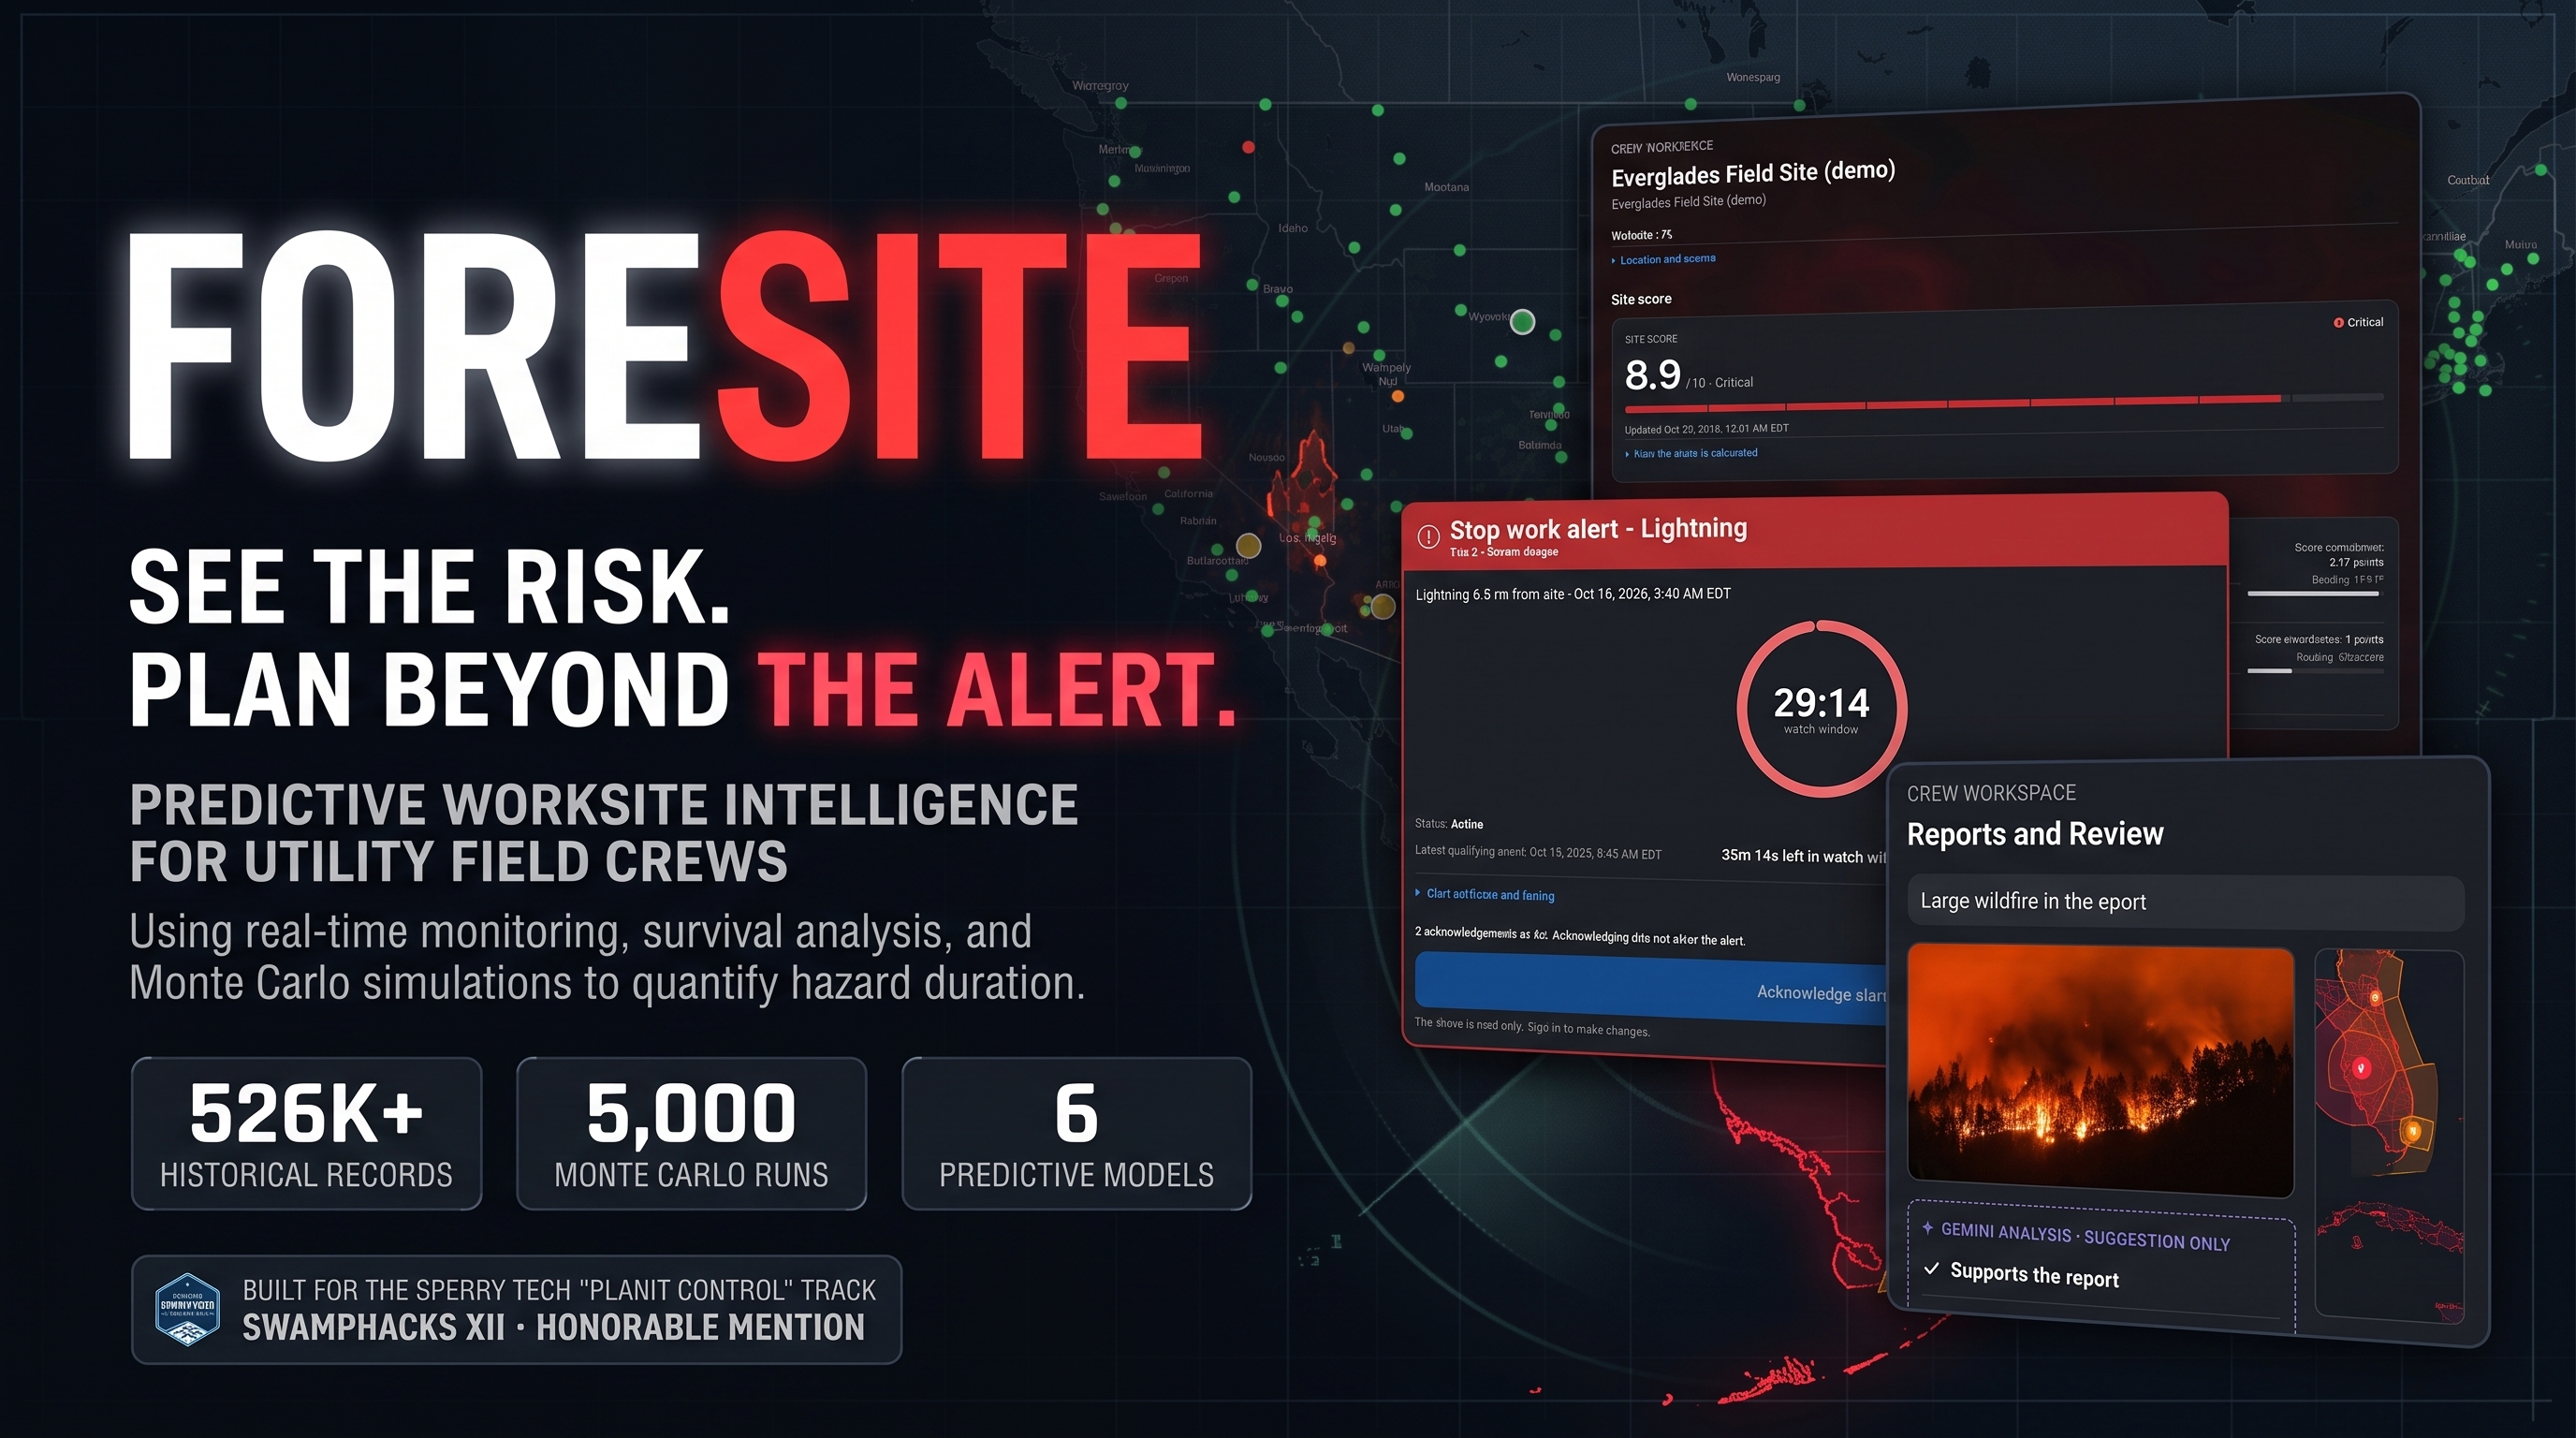
A weather delay has a cost. So does sending crews to a site where conditions put them at risk. We built FORESITE to help supervisors weigh both by bringing site information, crew reports, and local hazards into one shared app.
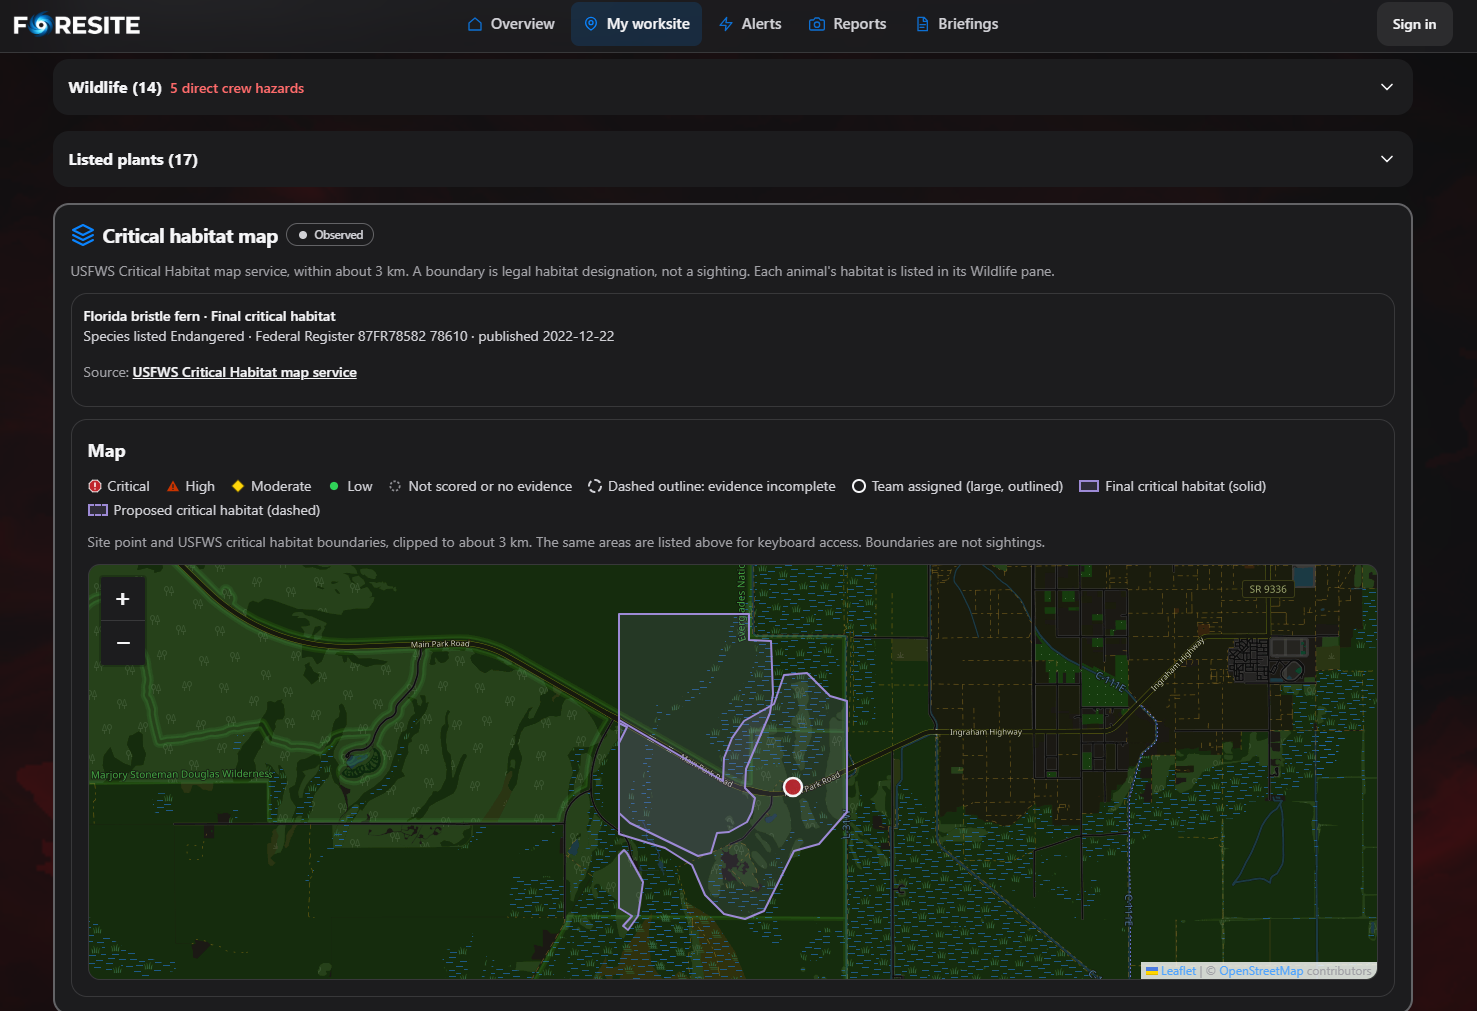
We also wanted crews to get useful context before they start work. A worker arriving from another state might not know about Florida weather, protected land, or dangerous local wildlife. FORESITE puts relevant information in a concise view for crews in the field and supervisors coordinating from off site.
What it does
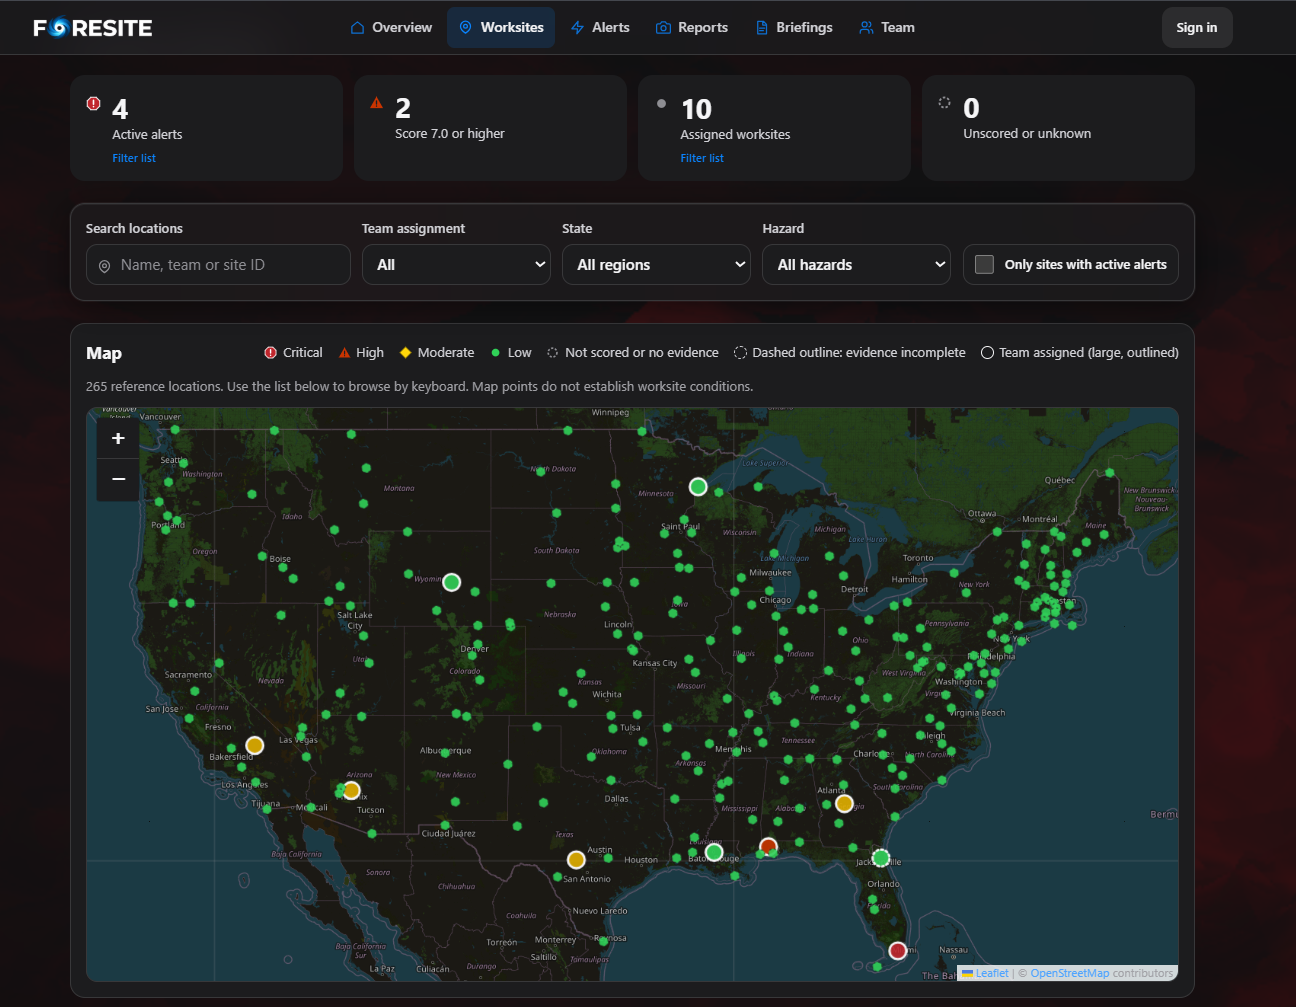
FORESITE is an intelligent worksite operations platform that combines live environmental monitoring, machine-learning predictions, and crew coordination.
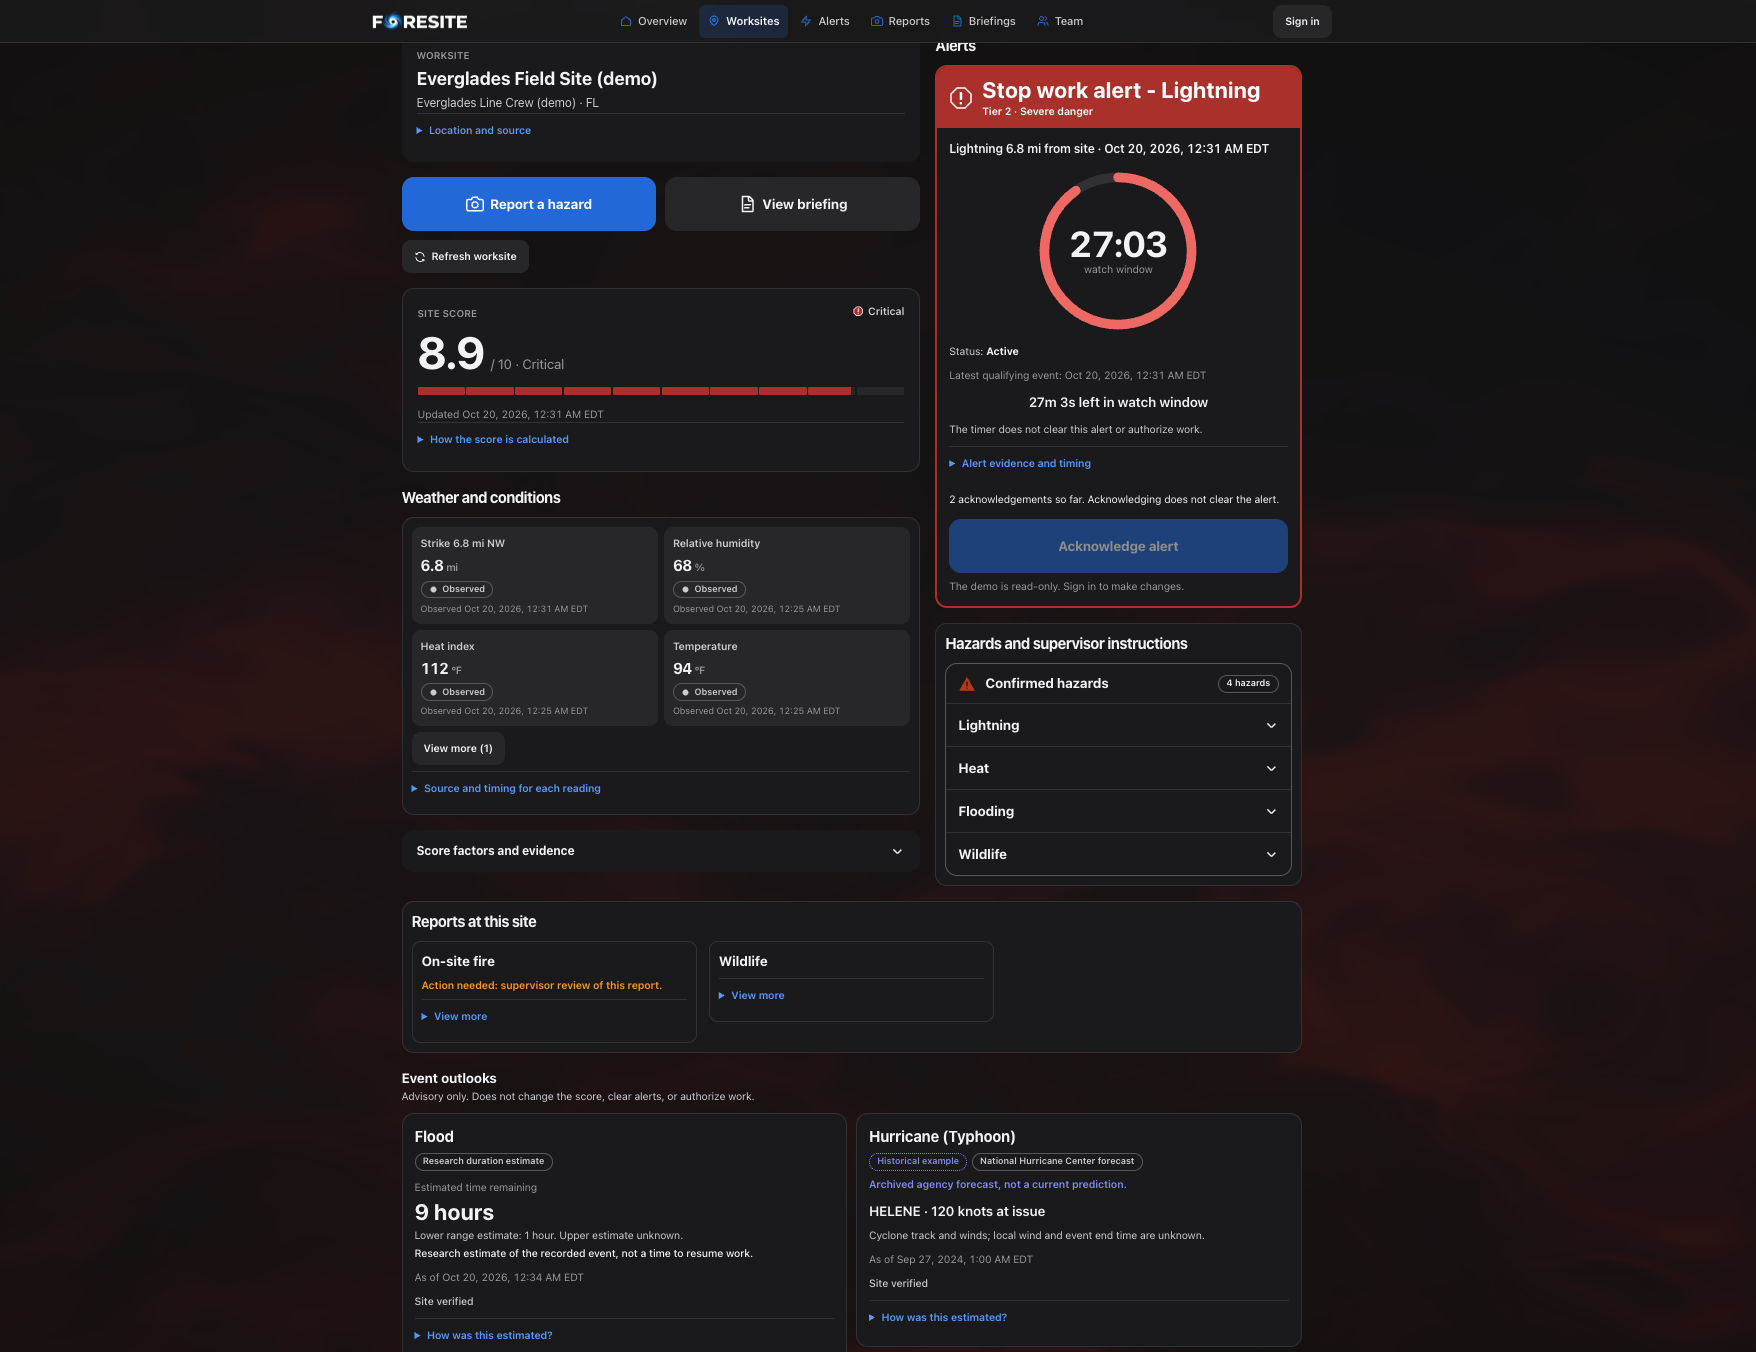
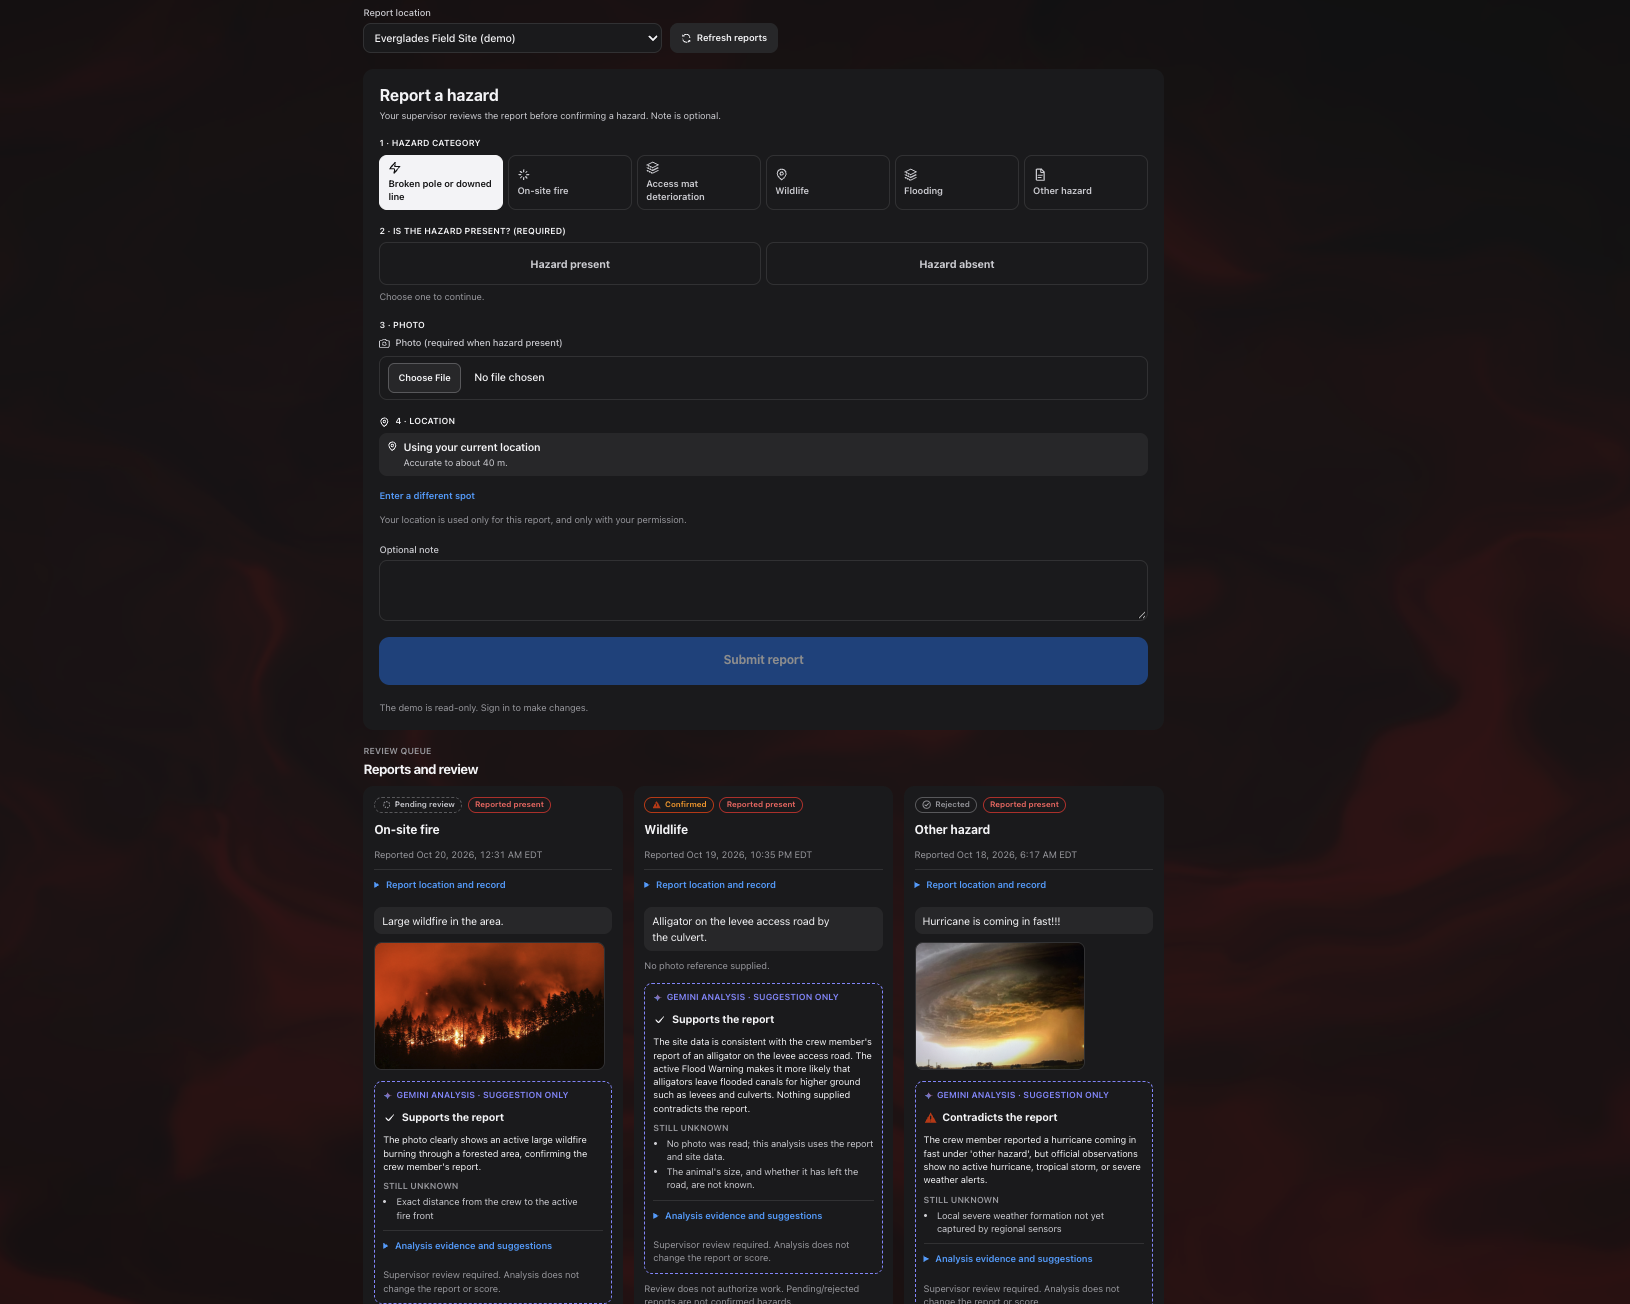
For crew members, FORESITE provides current site conditions, hazard alerts, local environmental context, and the ability to submit geolocated hazard reports with photographs.
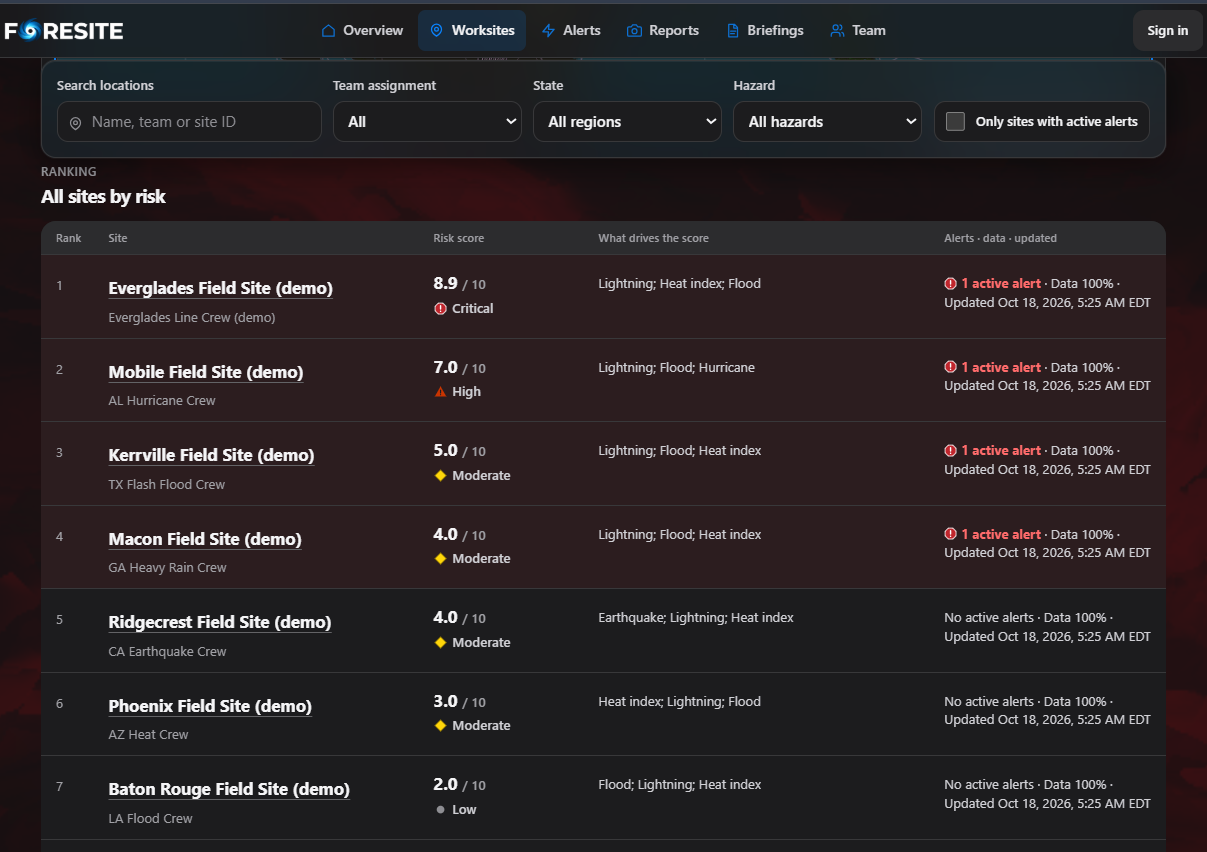
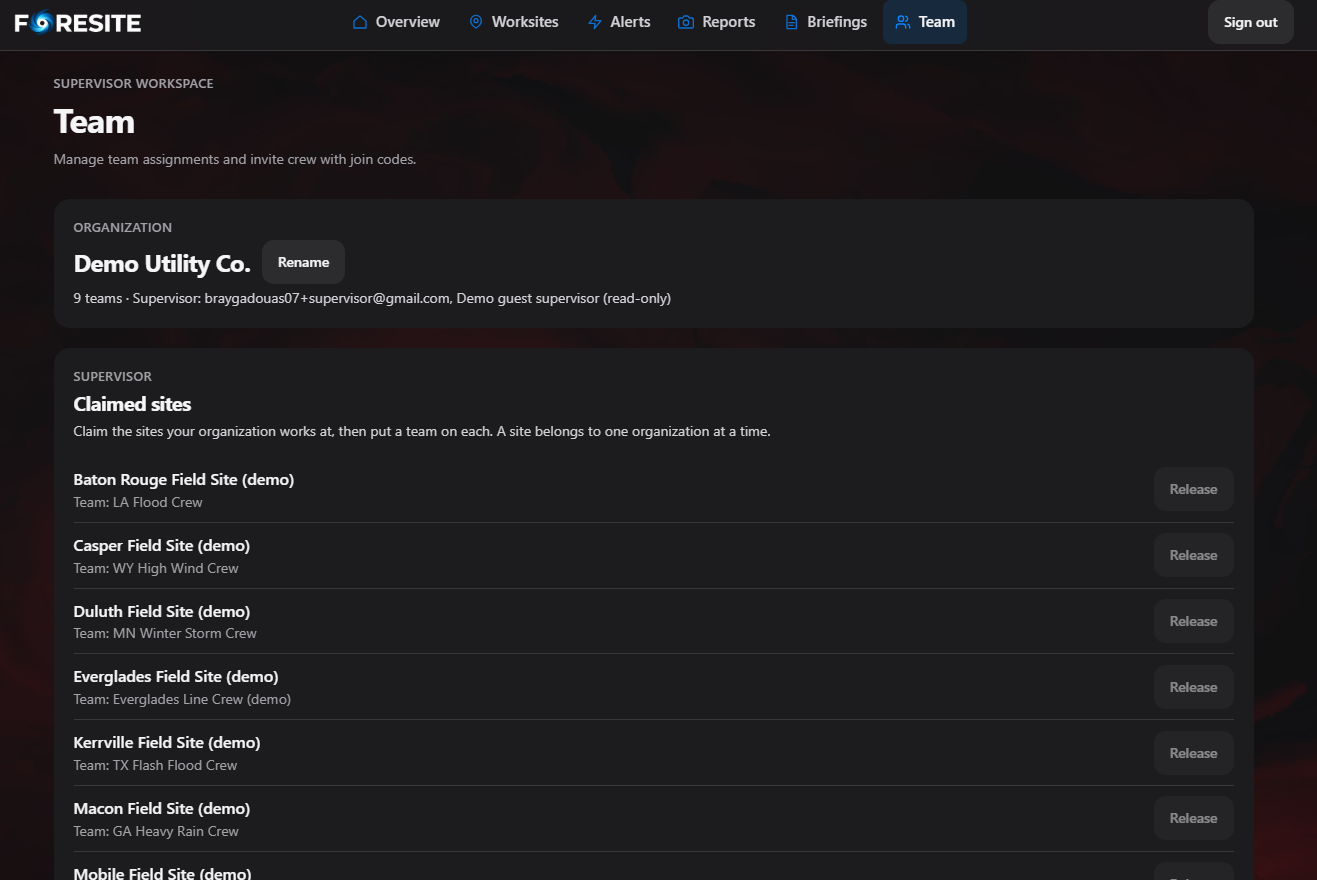
For supervisors, it provides a centralized dashboard to monitor worksites, evaluate explainable risk scores, review crew reports, and communicate safety instructions.
What makes FORESITE different is its predictive layer. Rather than simply displaying a flood warning, our models estimate the probability that an already-active event will continue over specified time horizons, helping supervisors reason about potential delays and operational uncertainty.
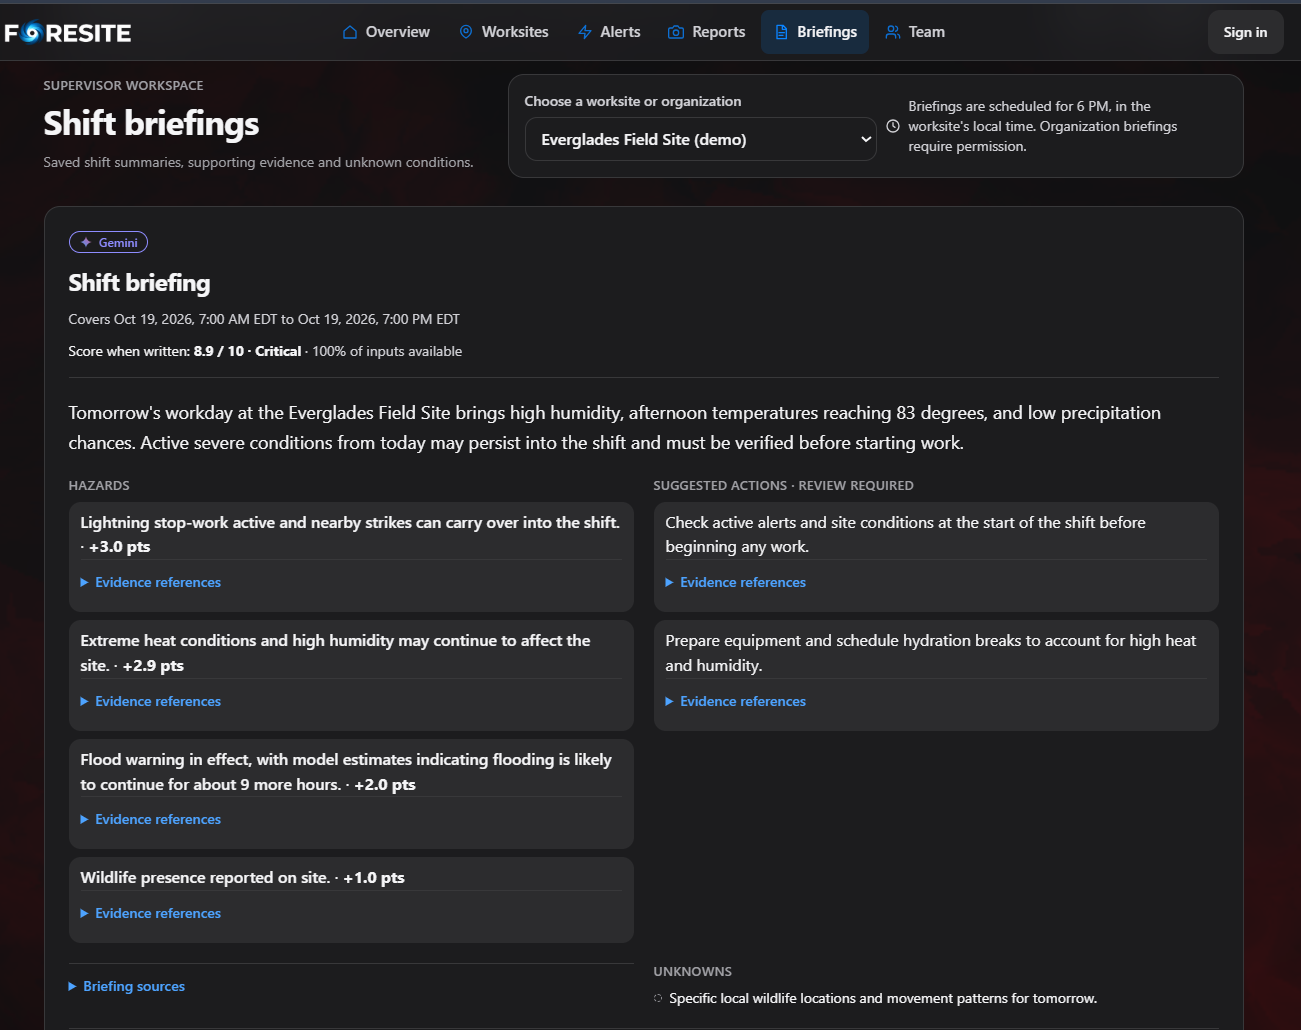
We combine these predictions with deterministic safety rules and Gemini-powered briefings, while keeping final safety decisions in human hands.
How we built it
1. Over half a million historical weather records
We started by building our own environmental research and data-processing pipeline using official government datasets.
Our research analyzed:
- 349,030 NOAA Storm Events records covering 2021–2025.
- 122,270 hourly weather observations for temperature and heat-index research.
- 55,524 National Hurricane Center historical track points.
- 14,700 validated power plant locations identified from EIA infrastructure data.
That's 526,824 historical weather records and measurements across three different datasets, plus extensive infrastructure data.
Collecting the information was only the beginning. We built pipelines to normalize inconsistent formats, reconcile timestamps, identify event boundaries, handle missing measurements, and preserve source provenance using versioned files and SHA-256 checksums.
This gave us a reproducible foundation for actual statistical research—not predictions generated by prompting an LLM.
2. Real machine learning and survival analysis
Our central research question was:
If a disaster is already happening, how likely is it to continue for another 6, 12, or 24 hours?
We approached this using survival analysis, a statistical framework for modeling time until an event ends.
Our original flood dataset contained 10,322 valid historical flood intervals across 2,945 reporting episodes.
We implemented and compared two predictive approaches:
Kaplan–Meier estimation calculates event persistence from historical survival distributions, conditioned on how long the event has already lasted.
Regularized logistic hazard modeling estimates hourly event-ending probabilities and combines them into a consistent survival curve.
These models generate conditional persistence probabilities and remaining-duration estimates with uncertainty ranges where supported.
We extended this framework to six evaluated duration targets: Flood, Flash Flood, High Wind, Heavy Rain, Winter Storm, and Heat Index Exceedance.
Crucially, we also trained models that we chose not to enable. Strong Wind, Ice Storm, and Heavy Snow failed our predefined evaluation requirements.
We believe knowing when not to trust a prediction is just as important as making one.
3. Rigorous backtesting and statistical validation
We didn't stop at training models. We built a historical backtesting system to measure how well predictions matched recorded outcomes.
Our evaluation separated historical records chronologically, using 2021–2023 for training, 2024 for validation, and 2025 for later-period testing.
We grouped related records by storm reporting episode and removed episodes crossing dataset boundaries to prevent future information from leaking into model training.
We evaluated predictions using Brier scores, calibration analysis, duration errors, and 500-replicate grouped bootstrap confidence intervals.
For example, our Kaplan–Meier flood model outperformed logistic regression across all three 2024 validation horizons:
| Horizon | Logistic Brier | Kaplan–Meier Brier |
|---|---|---|
| 6 hours | 0.2170 | 0.2117 |
| 12 hours | 0.2422 | 0.2324 |
| 24 hours | 0.2399 | 0.2248 |
Lower Brier scores indicate better probabilistic predictions.
We also evaluated alternative weather-enhanced models and hurricane wind-change predictions against historical baselines.
Rather than always choosing the most complicated algorithm, we selected models based on documented evidence and retained simpler approaches when validation supported them.
These are retrospective research results, not claims that the models have already been operationally validated at individual worksites.
4. Monte Carlo simulation and uncertainty modeling
One of our most technically ambitious features is our Monte Carlo simulation engine.
Instead of treating a disaster's predicted ending time as a single certain value, we simulate thousands of possible event trajectories from our fitted hourly hazard probabilities.
We ran 5,000 simulations for our flood model and additional 20,000-draw consistency checks for qualified event-specific models.
In one reproducible flood scenario, our analytical model estimated a 61.99% probability that the event would continue for another six hours. Across 5,000 simulations, 62.30% continued.
We repeated these comparisons across multiple prediction horizons, verifying that the simulated outcomes were mathematically consistent with our probability distributions.
We also explicitly track simulations that extend beyond the available prediction horizon instead of artificially assuming every event resolves.
This allows our research framework to describe a range of possible disruption durations rather than offering a misleadingly precise estimate.
Historical backtesting measures predictive performance; Monte Carlo simulations test the consistency and implications of those modeled probabilities.
Together, they form the analytical foundation for future delay-cost and scheduling simulations.
5. Live environmental intelligence and system optimization
Our production architecture integrates real environmental information from the National Weather Service, National Hurricane Center, USGS, and NOAA GOES lightning data.
We developed ingestion systems that reconcile geographic coverage, source timestamps, data freshness, and provider-specific formats.
We also optimized the live-data pipeline using bounded concurrency, HTTP connection pooling, geographic batching, shared requests, and caching.
In a controlled 256-site benchmark, we reduced HTTP requests from 1,794 to 578—a 67.8% reduction—while decreasing mocked refresh duration from 21.05 seconds to 4.44 seconds.
The platform also integrates:
- Auth0 for secure, role-based crew and supervisor access.
- Tiger Data for persistent observations, reports, and operational records.
- Vultr for application hosting and private photo storage.
- Gemini for evidence-grounded briefings, report analysis, and suggested instructions.
We tested Gemini against 24 structured scenarios, including photo-based hazard reports and attempts to elicit unsafe recommendations. All passed our defined safety checks in that evaluation.
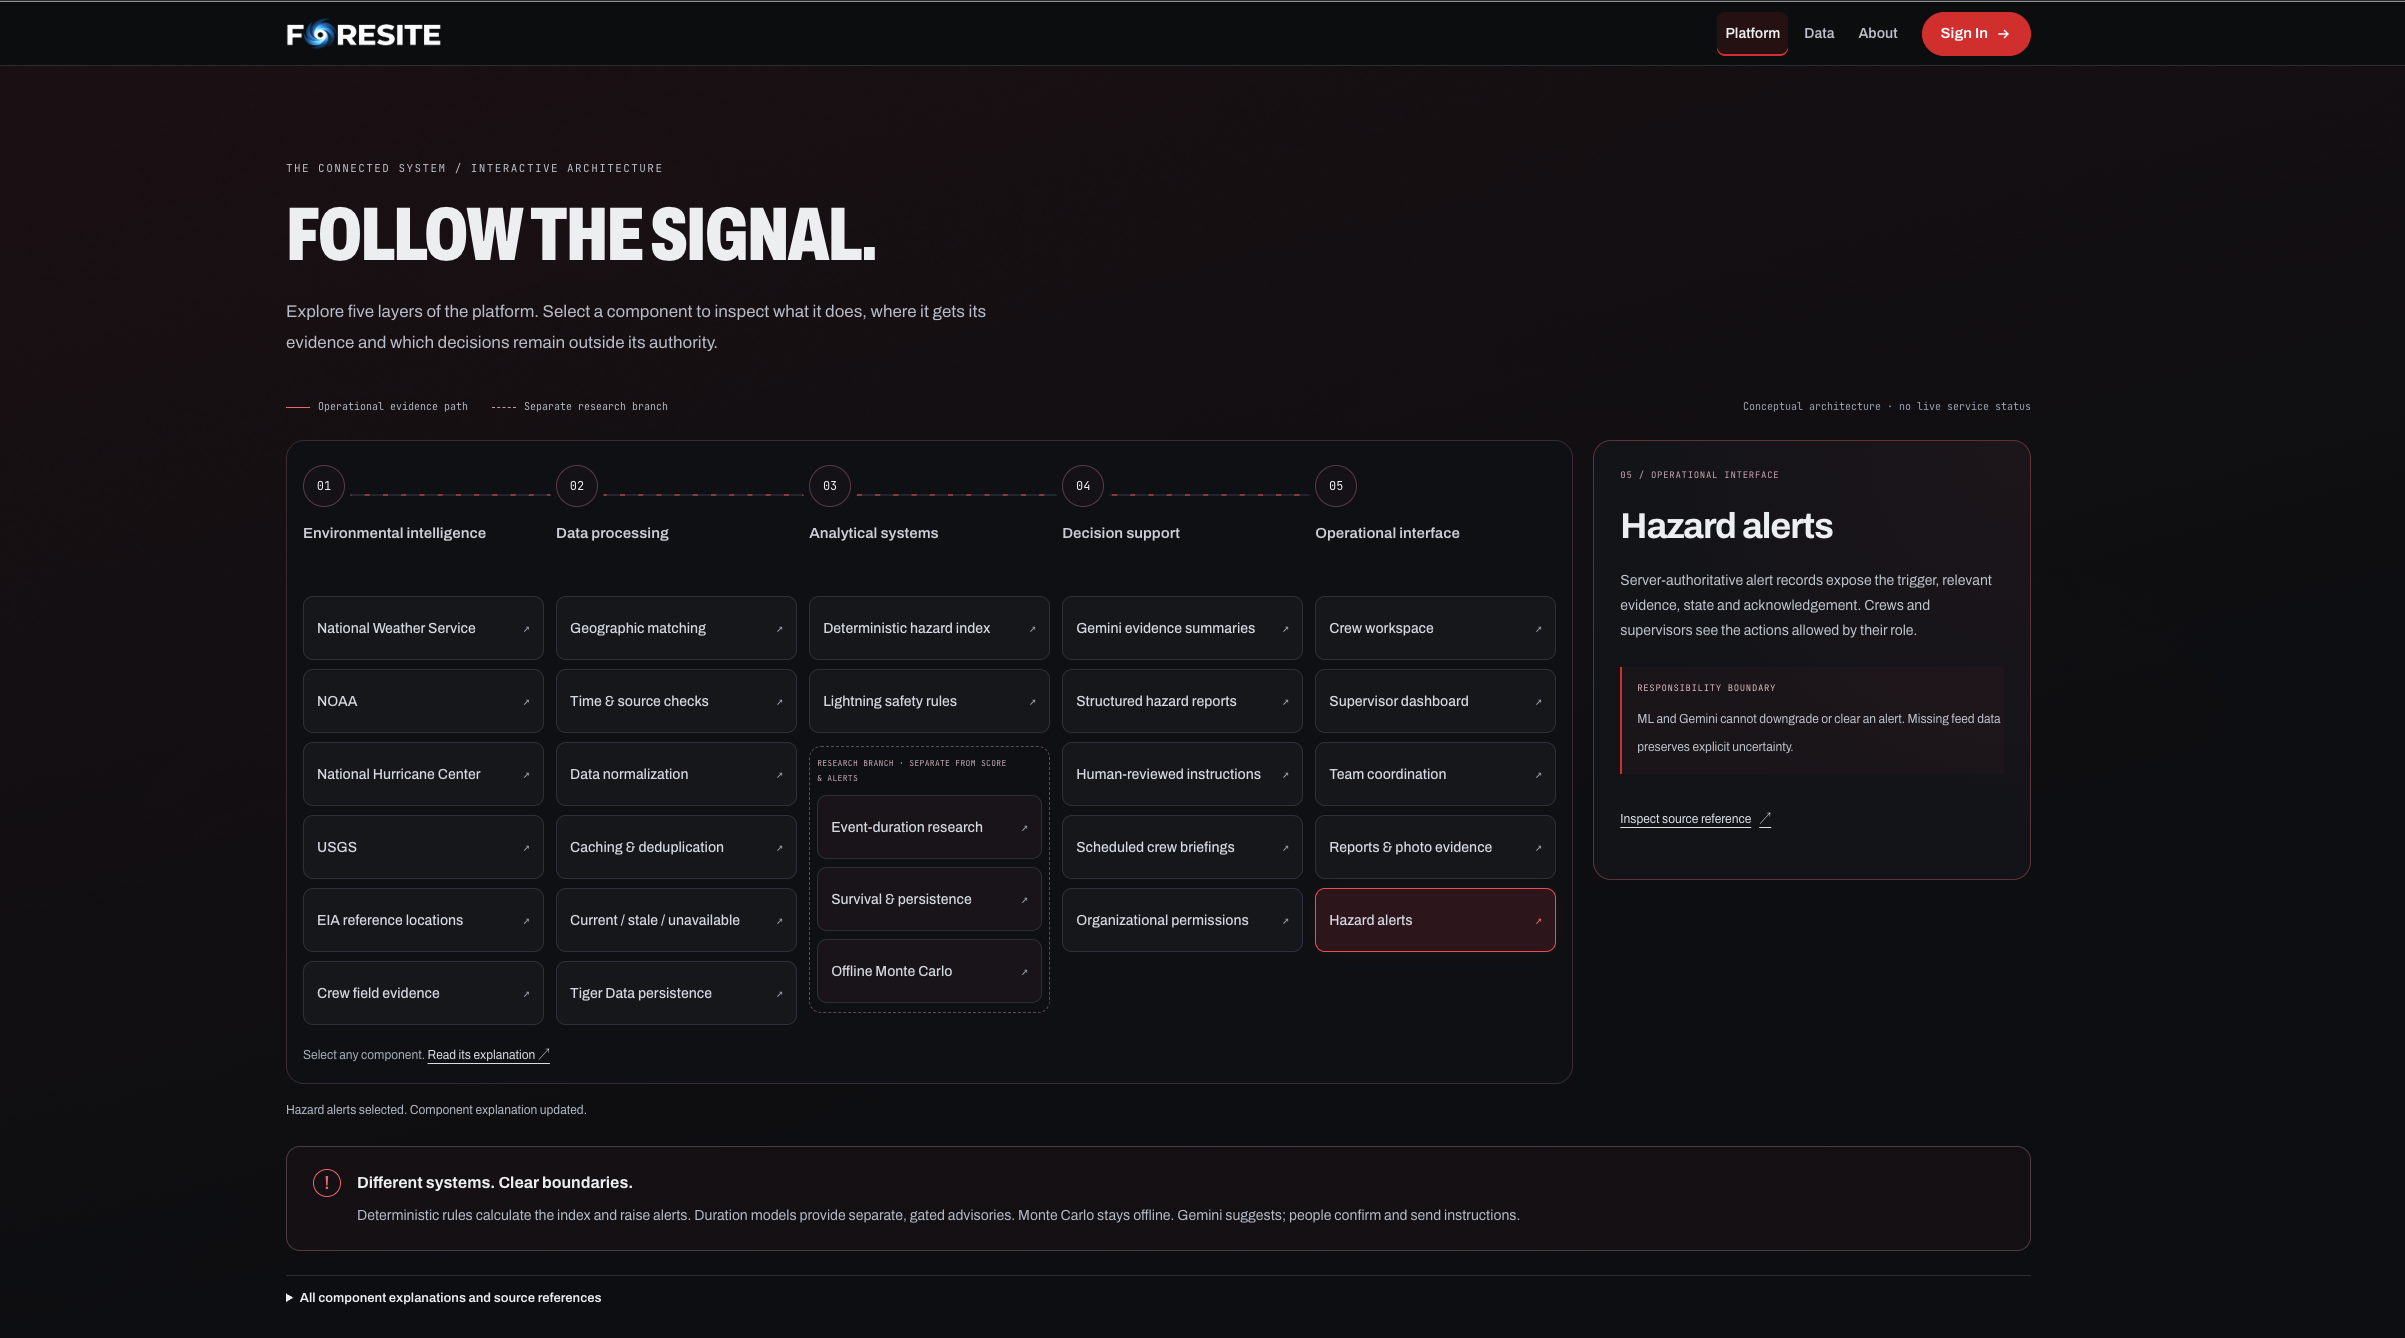
FORESITE separates these systems deliberately: *deterministic rules handle safety alerts, machine learning estimates event persistence, Gemini summarizes evidence, and supervisors retain decision-making authority.
Challenges we ran into
One of the challenges we faced was integration of API requests and data coming from different sources and maintaining awareness of purpose of each of them.
Historical disaster records contain missing values, geographic uncertainty, correlated observations, and information that may only become available after an event ends.
We had to prevent data leakage, preserve correct event chronology, validate model calibration, and distinguish real predictive evidence from retrospective information.
Moreover, we needed to serve two very different purposes. Workers required a fast and simple view in the field, while supervisors need a context to analyze worker reports and coordinate sites. Thus, we designed separate workflows for each group of users.
Accomplishments we're proud of
We managed to integrate site information and crew reporting into one common workflow. Our team managed the creation of fast and efficient experience for both crew and supervisor. We are also proud of our explainable alerts and the process of supervisor reviewing each worker report as a part of our safety protocol.
What we learned
Field safety application requires simplicity in its interface and availability of the next step to perform. A worker can be a newcomer to the area and could be unaware of local hazards and laws such as an alligator in Florida marshlands or a protected manatee in a spring.
We learned how duration estimates can help the supervisor to evaluate the cost of weather delay and conditions of work of the crew.
What's next for FORESITE
We want to improve the mobile experience and to add SMS reporting feature allowing workers to report about site issues without internet connection. Moreover, we plan to implement more hazard categories supported by reliable and up-to-date sources. In addition, we would like to add ability for supervisor to assign sites and analyze activities of workers.
Built With
- aiforgood
- auth0
- datavisualization
- fastapi
- foresite
- geminiai
- montecarlosimulation
- noaa
- nws
- python
- react
- safetytech
- scikitlearn
- tailwindcss
- tigerdata
- timescaledb
- typescript
- usgs
- vite
- vultr



Log in or sign up for Devpost to join the conversation.