Inspiration
On mission-critical builds like data centers, thousands of materials — switchgear, cooling units, steel, cabling — are ordered from dozens of suppliers. The moment an order is placed, visibility collapses: Is the submittal approved? Is it being fabricated, or stuck in a queue? Is it delayed — by how much? Where is it right now? Will it arrive by its Required-On-Job (ROJ) date — the day the schedule actually needs it?
Today these answers are scattered across emails, calls, PDFs, and disconnected systems. So slippage is found too late, after crews are already idle. And one late item doesn't stay contained: late steel blocks concrete, which blocks MEP, which pushes the handover date. Delays cascade. Mission-critical megaprojects average ~79% cost overruns, with material slippage a leading cause. We asked: what if a system could not only flag a delay, but reason through exactly what it breaks — and what to do about it?
What it does
Foreman is not a dashboard. It's a reasoning brain.
Most tools stop at a delay-prediction dashboard — a warning light. It can't tell you why, what else breaks, what to do, or how confident it is.
Foreman builds a living knowledge graph of the post-order supply chain and connects it to the construction schedule (critical path):
Material → Purchase Order → Submittal/Approval → Supplier → Shipment → Schedule Activity → Milestone
On top of it:
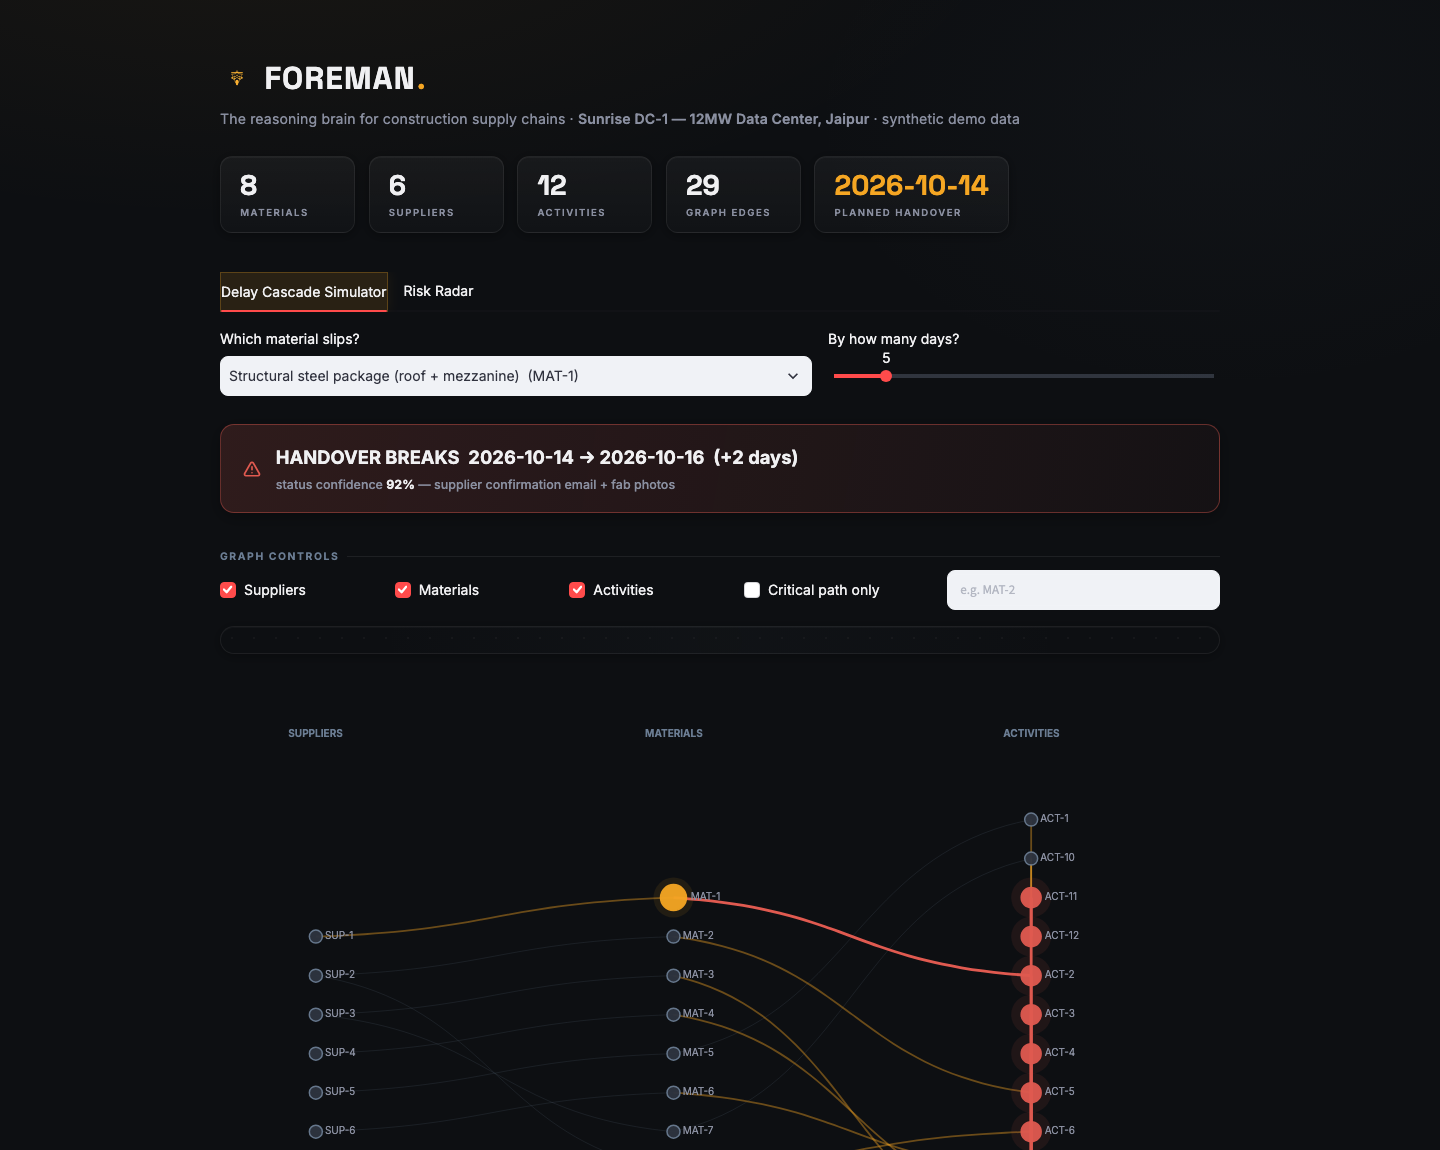
- Delay Cascade Simulator — pick any material and a delay length, and Foreman propagates it through the dependency chain using real Critical Path Method math: "Activities A, B, D slip; commissioning moves 6 days; float on C absorbs 2; cheapest fix — expedite the busway to recover 4 days."
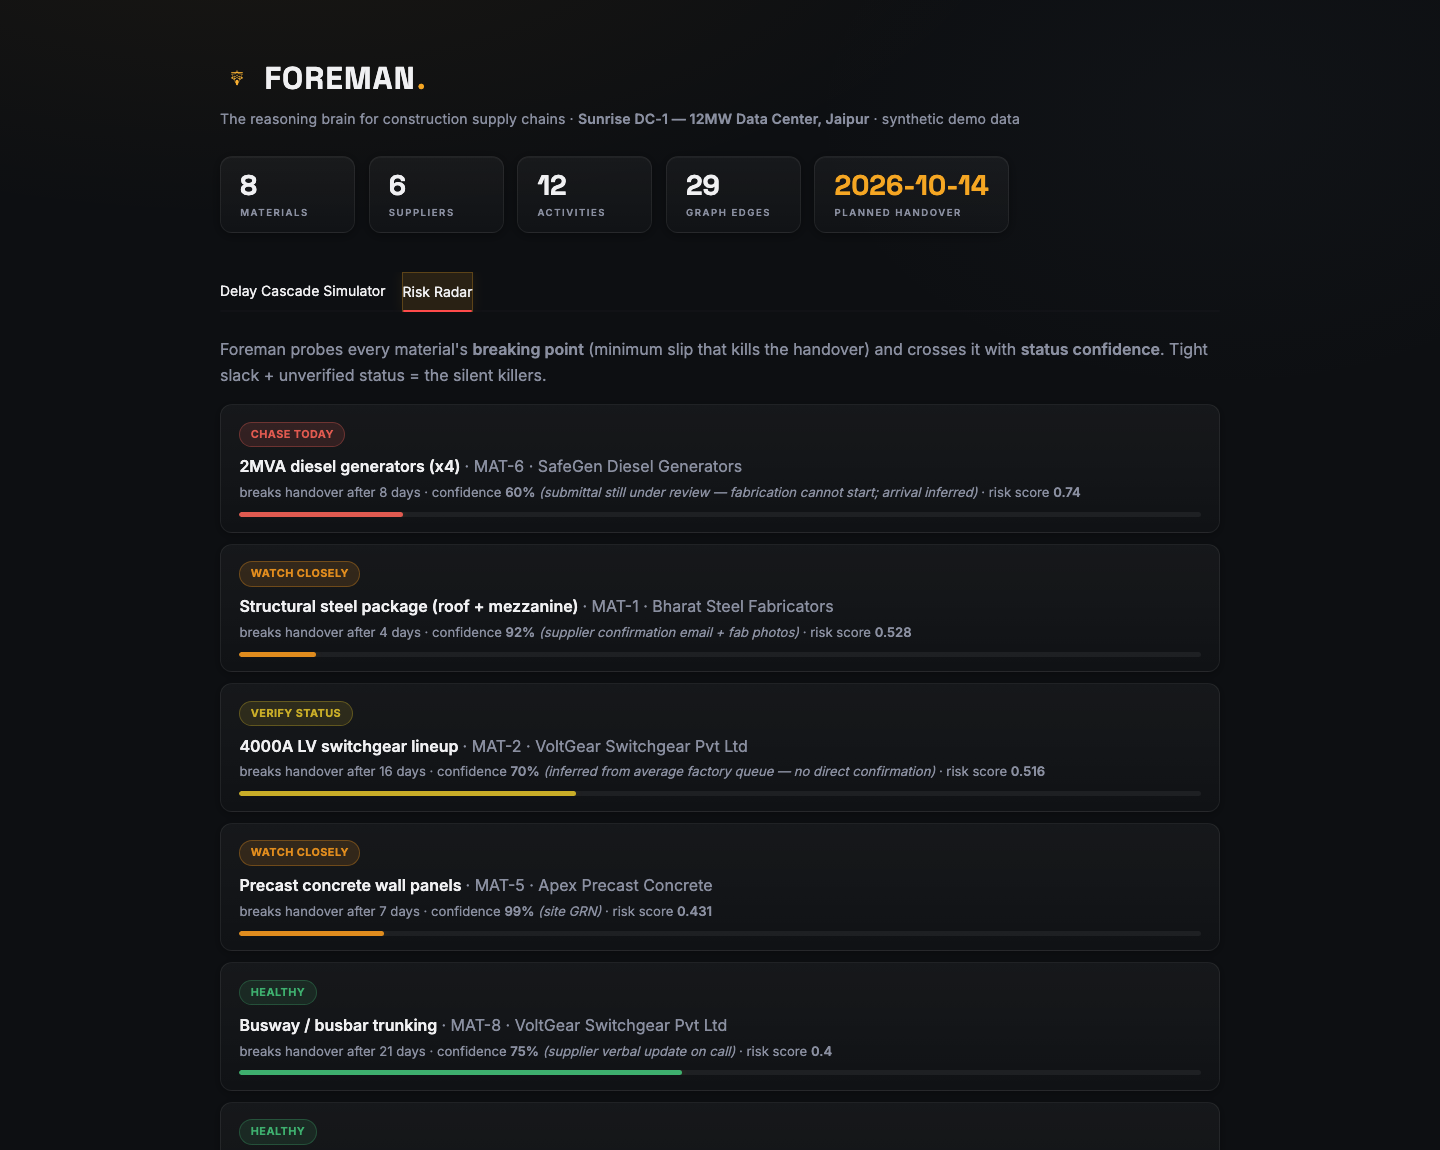
- Risk Radar — proactively probes every material's breaking point (minimum slip that kills the handover) crossed with status confidence, surfacing the "silent killer" no one's watching yet.
Every fact carries a calibrated confidence score (supplier confirmation > tracking feed > inferred average), so Foreman says how sure it is — auditable, not a black box.
Kaya tells you where your material is. Foreman tells you what breaks if it's late — and how to save the date.
How we built it
- Knowledge graph: Python + NetworkX, modeling a synthetic 12MW data-center project (8 materials, 6 suppliers, 12 schedule activities) with typed nodes/edges and per-edge confidence.
- Cascade engine: a real Critical Path Method forward pass — computes each activity's earliest start/finish honoring both dependencies and material arrival constraints, then diffs a delay scenario against baseline to find exactly what slips, what's absorbed by float, and whether the handover breaks.
- Risk radar: binary-searches the cascade engine per material to find its breaking point, then ranks by breaking-point × confidence.
- UI: Streamlit + Plotly, dark/amber themed, with an interactive graph visualization that highlights the live cascade path.
- Built collaboratively as Team Gozers, iterating together on the graph schema, the CPM logic, and the UI.
Challenges we ran into
- Making the cascade mathematically real, not simulated. It would've been easy to fake a delay dashboard with hardcoded outputs. We instead implemented an actual CPM forward pass with dependency + material constraints, so every "handover breaks by N days" answer is computed, not scripted.
- Keeping the demo honest. Early in polishing the UI, we caught ourselves adding a countdown-timer element that was partly cosmetic (a mock value dressed as real data). We removed it — every number on screen needed to be something we could defend if a judge asked "how did you get that?"
- Scoping for a 2-day build. We deliberately chose NetworkX over Neo4j and a simulator over a full LLM agent so we could ship something real and working rather than an ambitious but broken Stage 1 demo. The bigger architecture (LLM agents, Neo4j, live document ingestion) is designed and ready for Stage 2.
Accomplishments that we're proud of
- A cascade engine that gives genuinely different, correct answers depending on schedule float — e.g. steel slipping 5 days breaks the handover, but switchgear slipping 15 days is safely absorbed. That contrast is the intelligence.
- A proactive Risk Radar that surfaces a "silent killer" material (generators — only 8 days of slack, 60% confidence, submittal stuck in review) before anyone reports it late.
- A UI that feels like a real product, not a hackathon script — done in a Streamlit + Plotly stack with a coherent dark/amber design system, a working logo, and an interactive live-updating graph.
What we learned
That the hardest part of "AI for construction" isn't the AI — it's modeling the domain logic correctly (critical path method, float, ROJ dates) so the reasoning on top is trustworthy. We also learned to catch ourselves when a feature started prioritizing "looks impressive" over "is actually true," and to fix that before it reached a judge.
What's next for FOREMAN
Stage 2: an LLM agent layer (LangGraph) so Foreman can answer natural-language questions like "Will the CRAC units make ROJ?" directly; Neo4j for production-scale graph persistence; uncertainty-guided agentic graph construction that builds the knowledge graph automatically from live POs, emails, and tracking feeds; and integration with a real Kaya data feed so Foreman becomes a genuine intelligence layer on top of Amber.

Log in or sign up for Devpost to join the conversation.