-
-
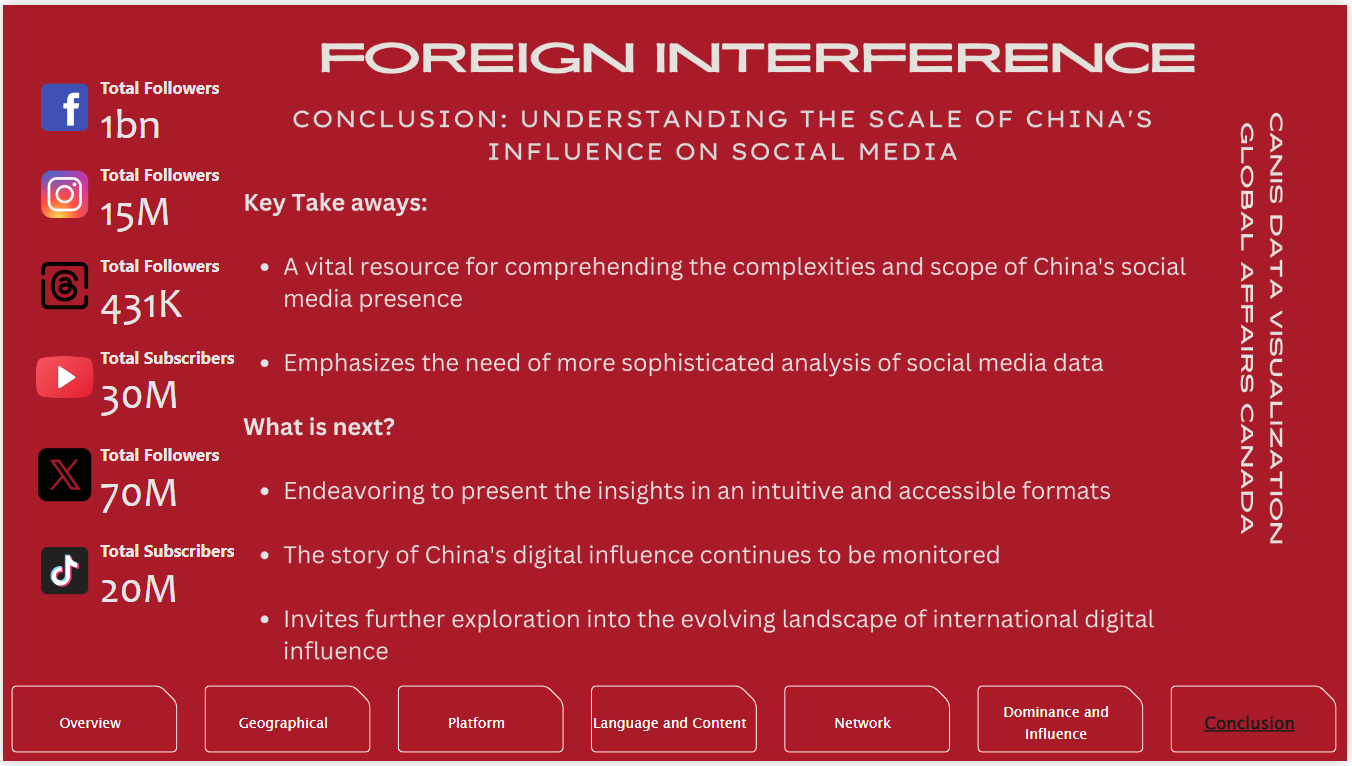
Power BI page 1
-
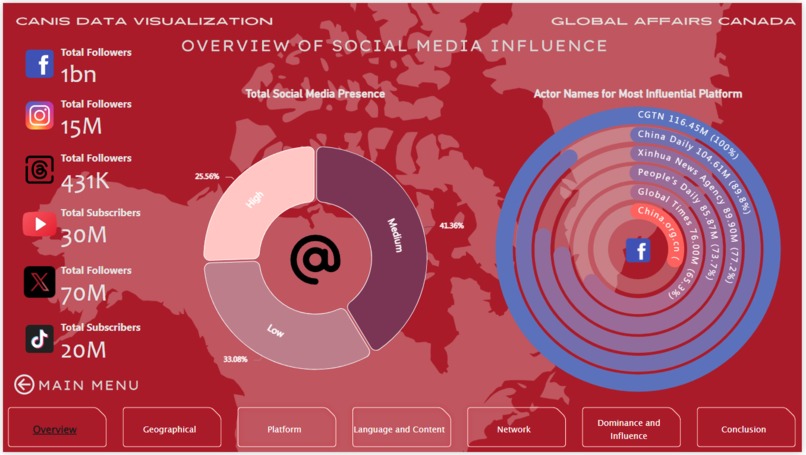
Power BI page 2
-
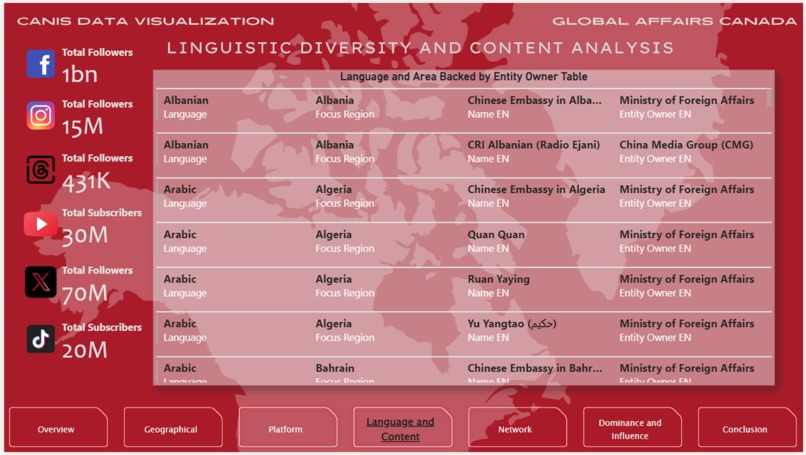
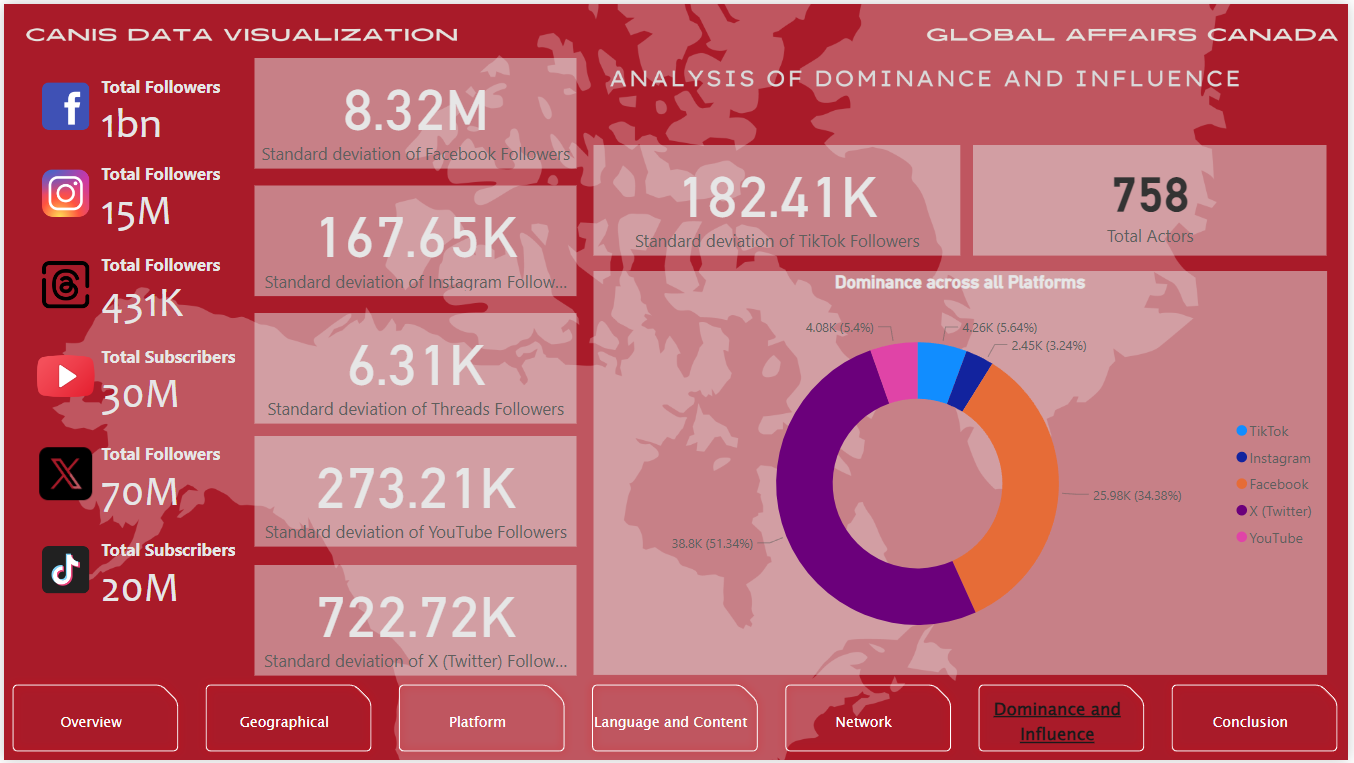
Power BI page 4
-

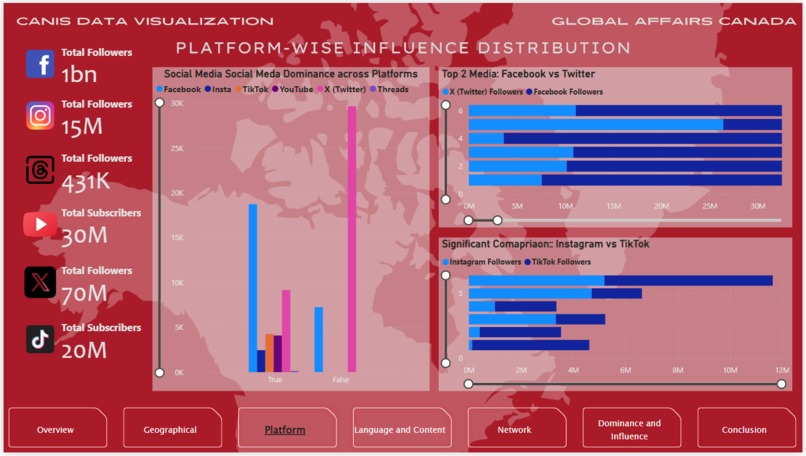
Power BI page 3
-
Power BI page 5
-
Power BI page 6
-
Power BI page 8
-

Power BI page 7


Power BI Dashboard File
NOTE: Please navigate to my GITHUB link and test out using the .pbix file by clicking here.
Inspiration and Motivation
My journey into the complex world of hackathons began with a profound determination to make a difference in the digital age, where misinformation and foreign influence are rampant. The challenge of creating a tool that not only raises awareness about these pressing issues but also enables users to identify and understand the nuances of digital influence on global platforms was my primary motivation. This project was an embodiment of my long-standing aspiration to contribute meaningfully in the fight against digital disinformation; specially via the methodology of Visualizations.
Functionality Overview
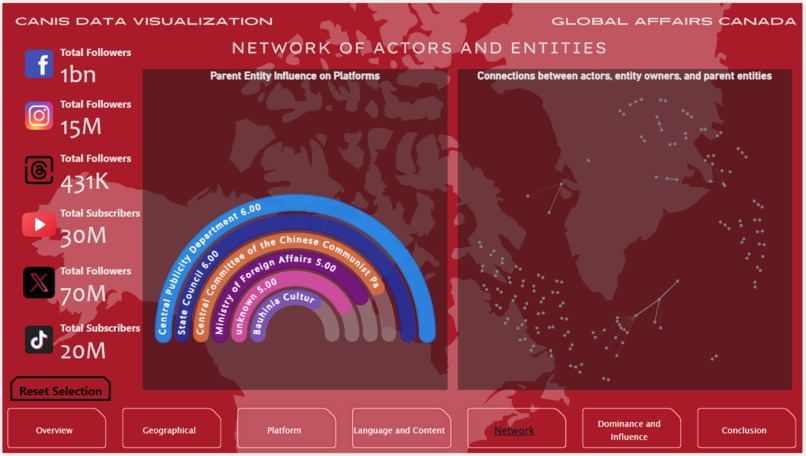
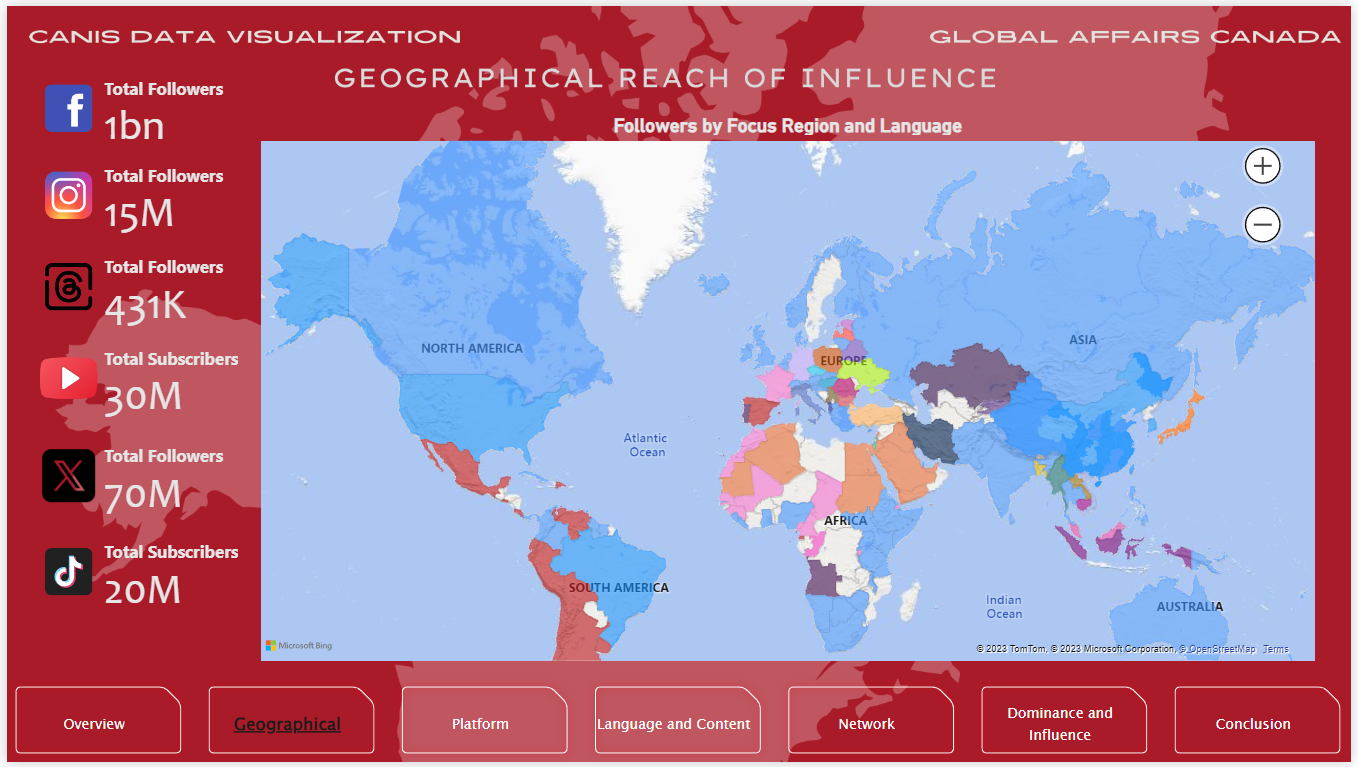
The Foreign Interference Analysis Dashboard stands as a testament to user-centric design, offering an advanced yet accessible interface for analyzing and visualizing foreign influence on social media. This tool adeptly categorizes and quantifies the impact of state actors and influencers, providing insights into their reach, influence, and targeted regions. It bridges the gap between complex data and actionable intelligence, making it a crucial asset for understanding digital geopolitics.
Development Journey
This dashboard was designed through a collaboration between robust data analysis and intuitive visualization. Leveraging Power BI for its dynamic and user-friendly capabilities, I transformed a meticulously cleaned and processed excel data file into an interactive platform. The backbone of this project was Python, utilized for its powerful libraries like Pandas, which facilitated sophisticated data processing and modeling.
Challenges Faced
Navigating the intricacies of distinguishing state actors from influencers posed a significant intellectual challenge, requiring deep dives into entity ownership and underlying intentions. Handling voluminous data from diverse social media platforms while ensuring accuracy was another formidable task. Undertaking this project solo, especially while fighting with illness, tested my resilience and dedication, pushing me to my limits.
Adapting to Technical Limitations
In the realm of technology, we often encounter constraints that test our adaptability and creativity. One such challenge in this project was the limitation in directly uploading the Power BI project. To overcome this and still effectively showcase the dashboard, I resorted to an alternative approach—using screenshots/slides. This method, while not as dynamic as a live dashboard, still provided a comprehensive view of the dashboard's capabilities and design.
Proud Accomplishments
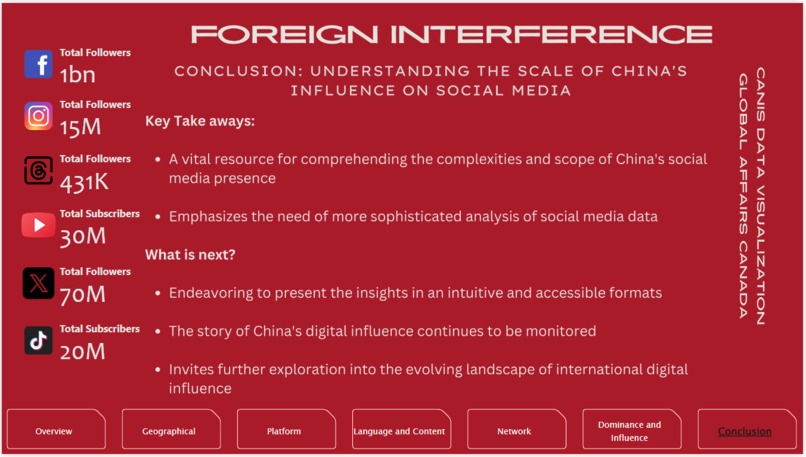
What fills me with immense pride is the dashboard's capability to demystify the complex interplay of influence and interference in an easily digestible format. The innovative use of network graphs to represent follower dynamics is a highlight of this project. This journey has been a crucible for my technical growth, deepening my understanding of data processing and enhancing my proficiency with the Pandas library beyond my previous experiences.
Learnings and Discoveries
This endeavor expanded my horizon in data analysis, particularly in the context of social media. I delved into advanced data classification techniques and grappled with the ethical dimensions of data management. The power of visual storytelling in making data comprehensible and engaging was a key revelation, shaping my approach to data presentation.
Technologies Used
Analytical Tool(s): Power BI Programming Language(s): Python Libraries Used: Pandas, IO, OS
Future Aspirations
Looking ahead, I aim to evolve the Foreign Interference Analysis Dashboard into a more dynamic tool, incorporating real-time data analysis and leveraging machine learning for predictive insights. The next phase of development envisions transforming this dashboard into a comprehensive full-stack website. I'm also eager to embrace collaborative environments, believing that diverse perspectives will further enrich this project. This is not just a conclusion but a gateway to new beginnings in my journey through the world of data and hackathons.

Log in or sign up for Devpost to join the conversation.