-
-
Thumbnail
-
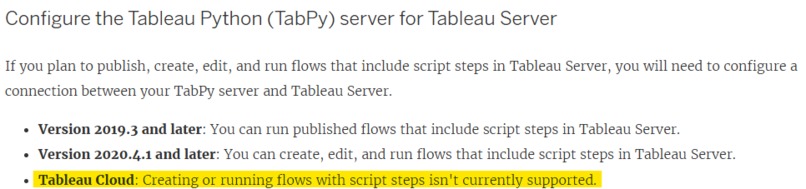
Cannot publish the Prep flow with the Script step
-
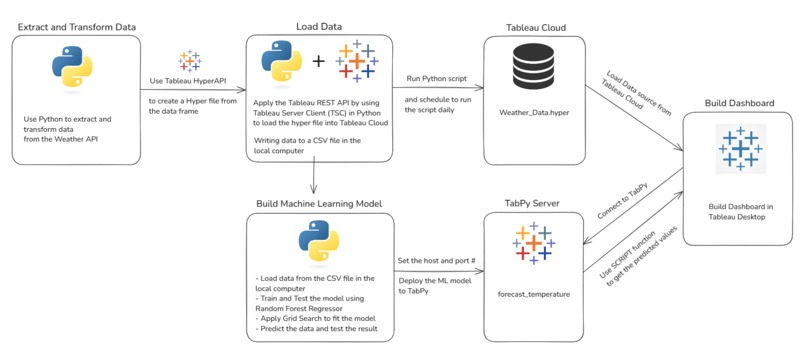
ETL pipeline
-

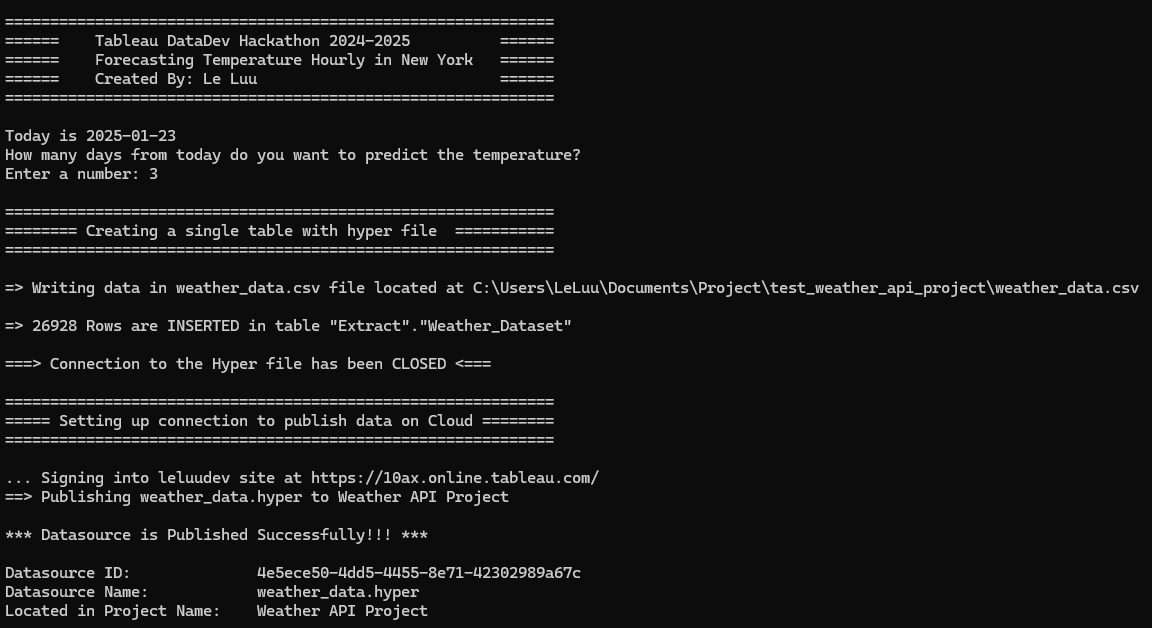
Publish the Data Source on Tableau Cloud
-
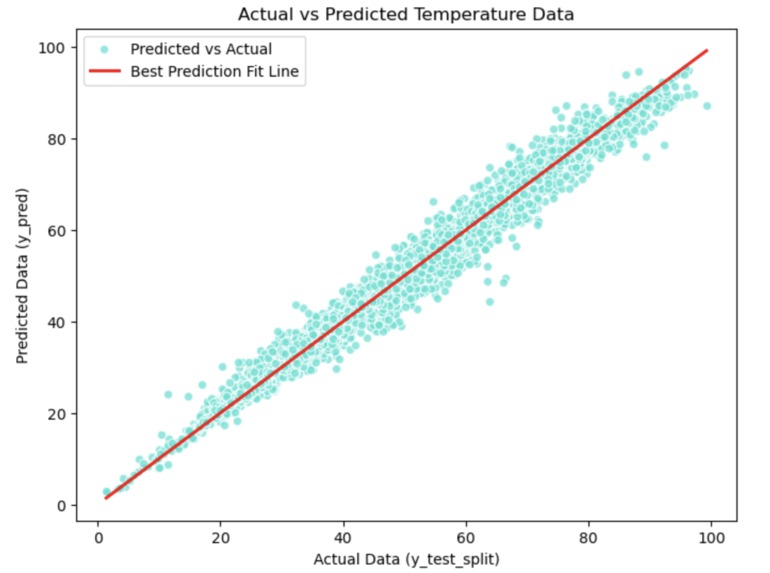
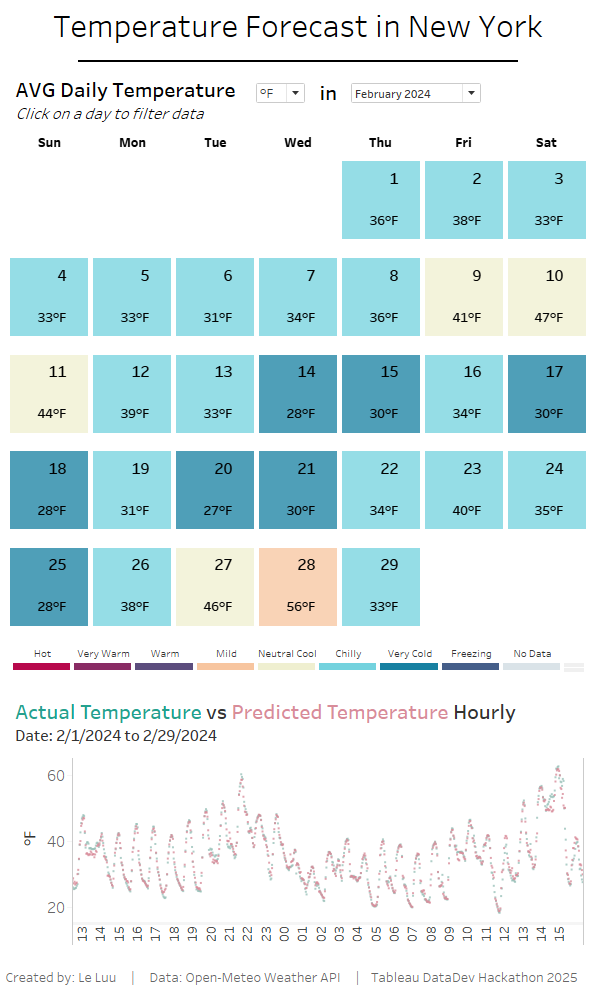
Actual vs Predicted Data
-
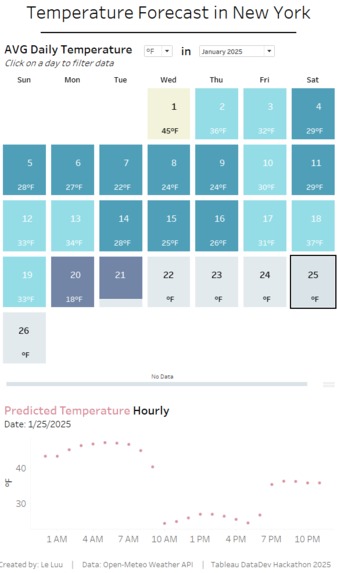
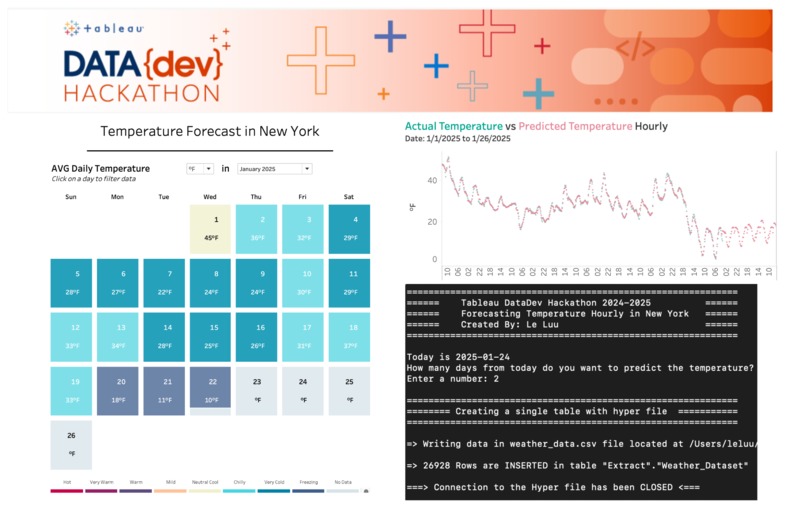
Forecasting the temperature in the future date
-

Tableau Dashboard comparing Actual and Predicted Data


Inspiration
I want to use the Tableau Platform to extract data from an API. Tableau Prep Builder allows me to extract the data using the Script tool. However, I cannot publish workflows containing the Script tool to Tableau Cloud for scheduled execution. Therefore, I need to find an alternative method to extract, transform, and load the data into Tableau Cloud and make predictions to display on a Tableau dashboard.
What it does
- Create an automated workflow to extract data from the Weather API using Tableau tools
- Publish the data source on Tableau Cloud/ Server and refresh data
- Build a Machine Learning model to predict the data from the published data source
- Apply the Machine Learning model in Tableau Desktop using TabPy
- Build the dashboard in Tableau Desktop to show the predicted data and compare it with the actual data
How we built it
- Build an ETL pipeline model (refer to the attached ETL pipeline image).
- Extract data from the API using the requests package in Python, and transform the data within Python.
- Load the transformed data into Tableau Cloud by converting the DataFrame into a Hyper file using HyperAPI, and publish it to Tableau Cloud using Tableau Server Client (TSC).
- Combine all functions into a single Python script (refer to the attached "Publish Data Source to Tableau Cloud" image). The script also outputs a CSV file for training the machine learning model.
- Load the CSV file from the local computer into a DataFrame in Python to train the machine learning model. This approach simplifies the process compared to downloading the data source from Tableau Cloud via TSC, converting it, and loading the .tdsx file into a DataFrame for training.
- Apply Grid Search to optimize parameters and minimize errors in the prediction model.
- Evaluate the model by testing the predicted data and checking the R-squared error.
- Deploy the trained machine learning model on the TabPy server, specifying the host and port number.
- Build a Tableau Desktop dashboard to track daily temperatures for a specified month and compare the actual hourly temperatures with predicted temperatures for a selected day.
Challenges we ran into
TabPy is required to extract data from an API and parse JSON using the Script tool in Tableau Prep Builder. However, workflows containing the Script tool in Tableau Prep Builder cannot be published to Tableau Cloud. (Source: https://help.tableau.com/current/prep/en-us/prep_scripts_TabPy.htm)
Due to this limitation, it is not possible to schedule the workflow for data refresh on Tableau Cloud. Therefore, I need to find an alternative solution to schedule the workflow to run daily.
Once the data source is published on Tableau Cloud, downloading it via Tableau Server Client (TSC) and converting the Hyper file or .tdsx file into a DataFrame can be a complex process.
Develop a machine learning model and integrate it into Tableau Desktop via TabPy.
Consider how to make the machine learning model accessible in Tableau Desktop for all users, including those without a Computer Science background.
Accomplishments that we're proud of
- Automate the update of the latest day for the data source when running the script.
- Allow users to dynamically choose how many days from today to predict the data.
- Display the number of rows inserted into the data source.
- Output a CSV file on the local computer for users to transform the data as needed.
- Print the location details of the data source on Tableau Cloud, including the site name, server, data source name, data source ID, and project name.
- Achieve an R-squared error greater than 98%, with the prediction line for the model being linear.
- Enable Tableau users to predict temperature data by applying a simple Python script in a calculated field.
- Allow users to compare actual and predicted data in Tableau Desktop using the live data source.
What we learned
- I found an alternative way to publish the data source on Tableau Cloud when using a Python script to solve the problem.
- I learned how to convert a DataFrame into a Hyper file using HyperAPI before publishing the data source on Tableau Cloud via Tableau Server Client (TSC) and also how to reverse this process.
- I considered users who build dashboards in Tableau Desktop but may not have a computer science background. Therefore, the calculations in the calculated fields should be simple and easy for them to use.
What's next for Forecasting Temperature in New York
- Currently, the Python script (including the data source loading, training, and deployment functions on TabPy) is run manually in the terminal or a Python IDE. To schedule it to run daily for loading the data source into Tableau Cloud, the task can be scheduled using the operating system's task scheduler or services like Amazon Web Services (AWS Lambda, EC2, or Glue).
- When the Python script runs, the data source is replaced on Tableau Cloud. This approach could impact performance due to the live data source updates. In the future, I plan to find a way to append new data to the existing data source instead of replacing it entirely each time.
- Add more types of regression models to compare predicted values and associated errors.
- Create a dashboard to evaluate the performance of the regression models by displaying key metrics when comparing actual data and predicted data.
Built With
- hyperapi
- jupyternotebook
- machine-learning
- python
- rainforestregression
- tableaucloud
- tableaurestapi
- tableauserverclient
- tabpy
- weatherapi

Log in or sign up for Devpost to join the conversation.