-
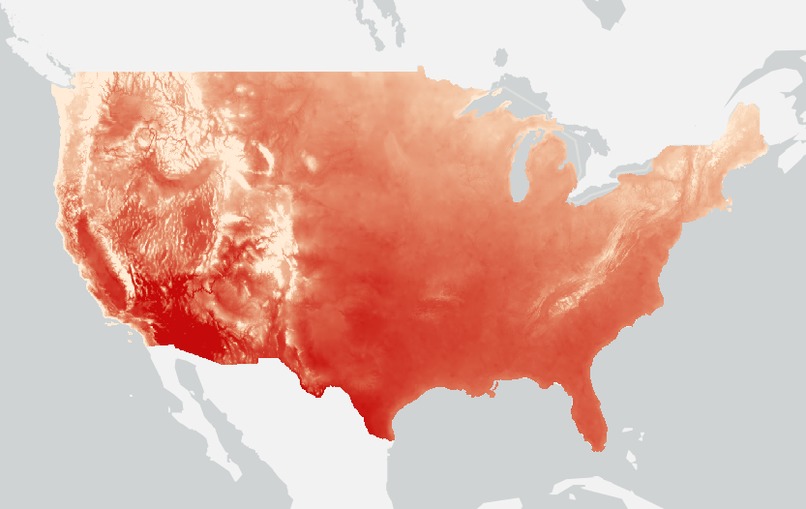
Max Temperature Averages for 2040-2069
-
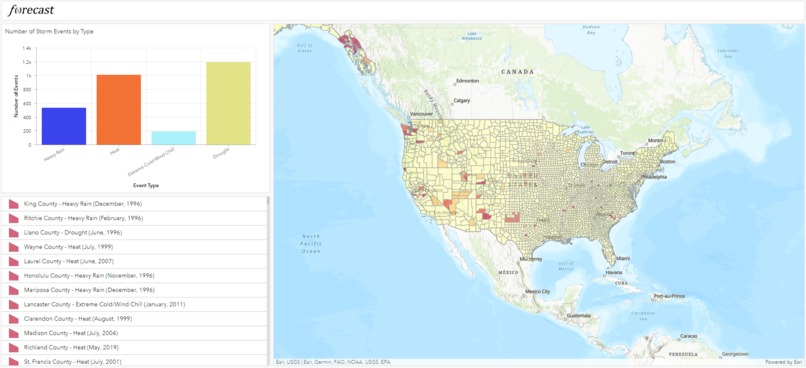
Dashboard of Historic Damages


Inspiration
FEMA's Risk Index is a wildly useful tool for visualizing climate risks. However, it doesn't leverage future climate models in its analysis. We would like to see how the FEMA Risk Index might change over time.
What it does
Our tool will allow you to visualize a FEMA Risk Index prediction for any climate event type, for whichever year you want, from 2022 to 2100. Currently, we are in the initial phases of gathering multidimensional data into usable formats to train with our historic damages-by-climate-event map.
How we built it
We built our project with ArcGIS Pro, ArcGIS Online, Esri Dashboards, Esri Living Atlas, Python, Excel
Challenges we ran into
Working with multidimensional raster datasets (.netCDF) is difficult because to utilize spatial analysis tools like Generalized Linear Regression, all the data needs to be in one feature layer. The datasets were too massive and we spent a lot of time trying to format the data properly. Additionally, standardizing attribute formats like time and damage values across different data sets proved to be difficult, yet we were able to leverage Python and Arcade to generate useful data.
Accomplishments that we're proud of
We are proud to have created a map of all United States counties displaying all storm events that have taken place between 1950-2021 and the associated damages. This is a great setup to continue the Machine Learning aspects of our project and be able to accurately predict the risk of living in each county across the United States until 2100. We are also proud of our ability to work effectively as a team, and how much we have learned about Esri products during the Hackathon.
What we learned
- Python is a great tool within ArcGIS Pro to make calculated fields. Real climate data is messy and Python provides the capability to transform that data to desired formats.
- Working with and processing extremely large datasets.
- Efficiently utilizing ArcGIS online to collaborate on GIS work.
- Using machine learning tools embedded within ArcGIS Pro
What's next for Forecast
The forecast team anticipates significant additional functions for the tool and novel dataset. The roadmap includes:
- Integration with ArcGIS Business Analyst
- Climate change refugee migration predictions for potential population numbers and resettlement efforts
- Additional hazard types as predictions become more reliable
- Crowdsourced, geolocated, visual library of climate change impacts over time. Sorted for hazard types and historical timelines
- Resources for public and private organizations emergency managers, insurance agents and analyst, real estate agents, city managers to integrate predictions into business plans.
- Social media integration:
- Sharing impacts and resources
- Memability for social media spread
- Grassroots campaigns and causes


Log in or sign up for Devpost to join the conversation.