-
-
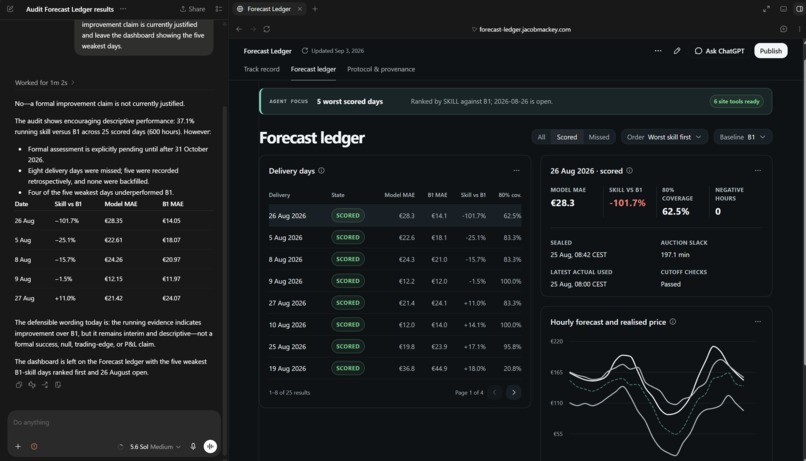
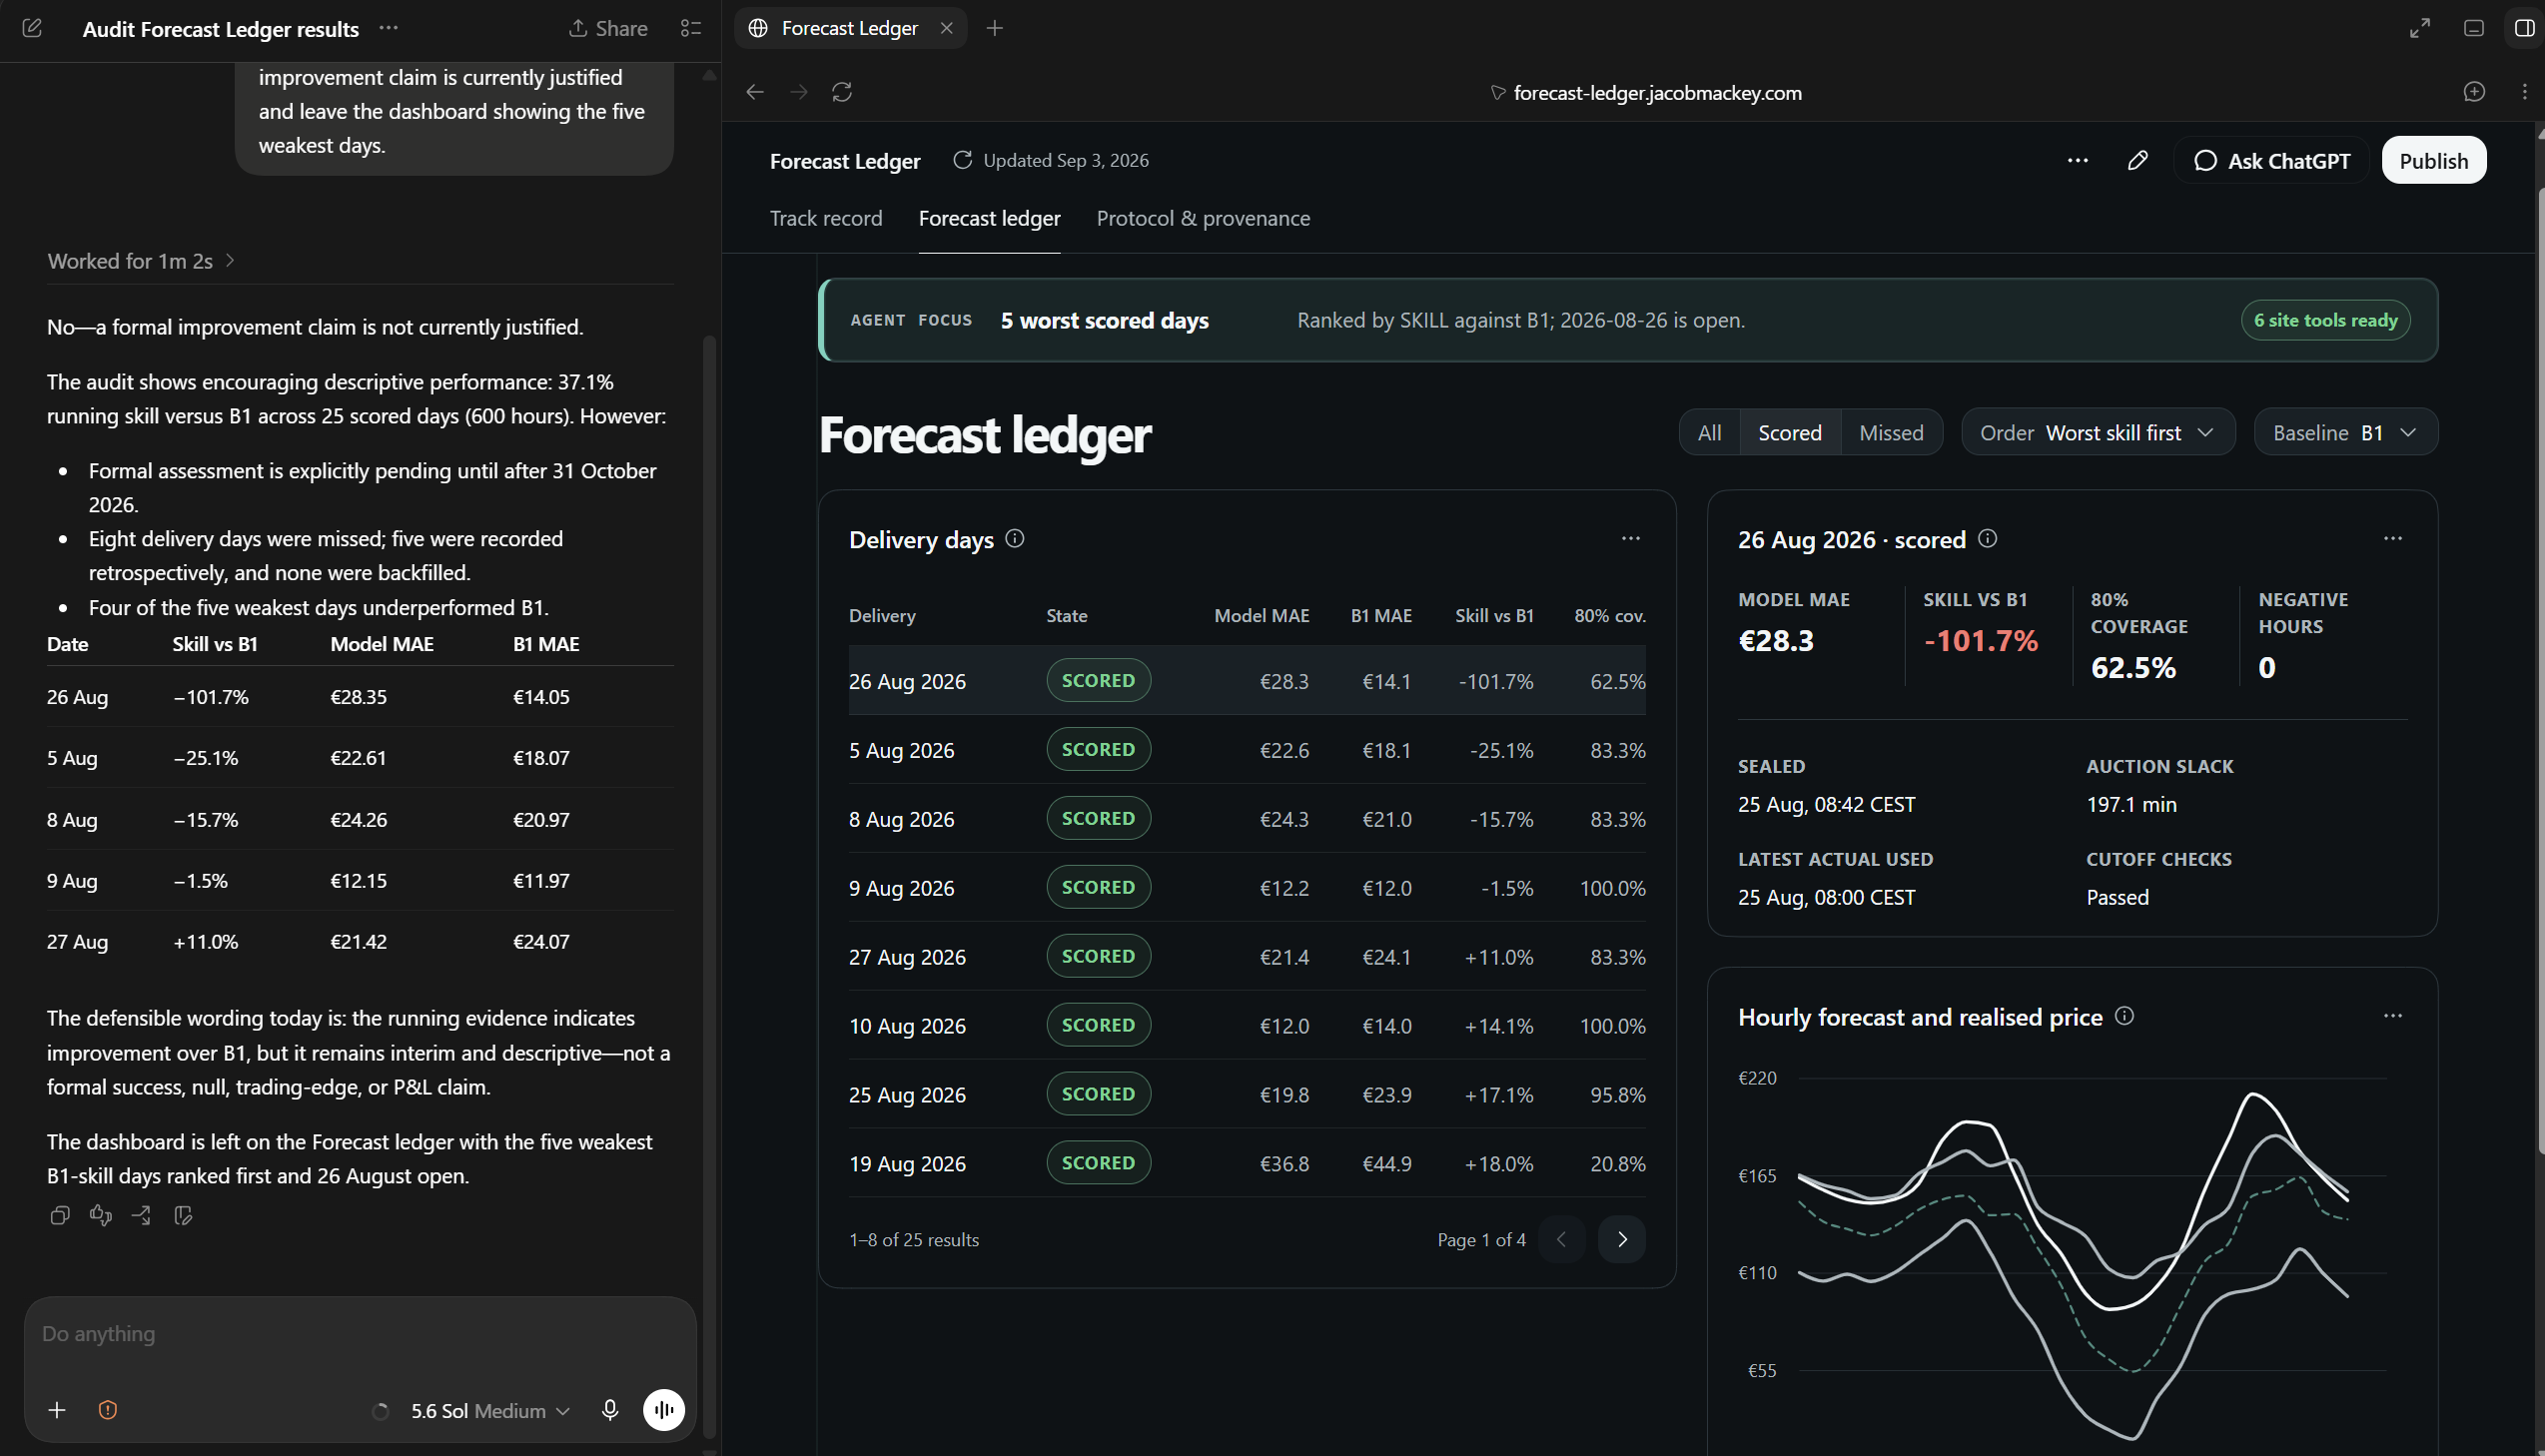
Successful codex audit - Codex’s completed answer alongside the dashboard reordered to the five weakest days.
-
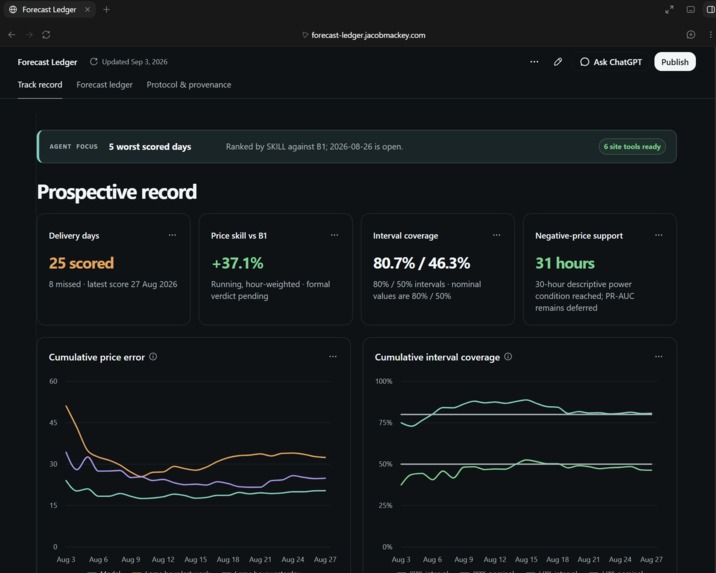
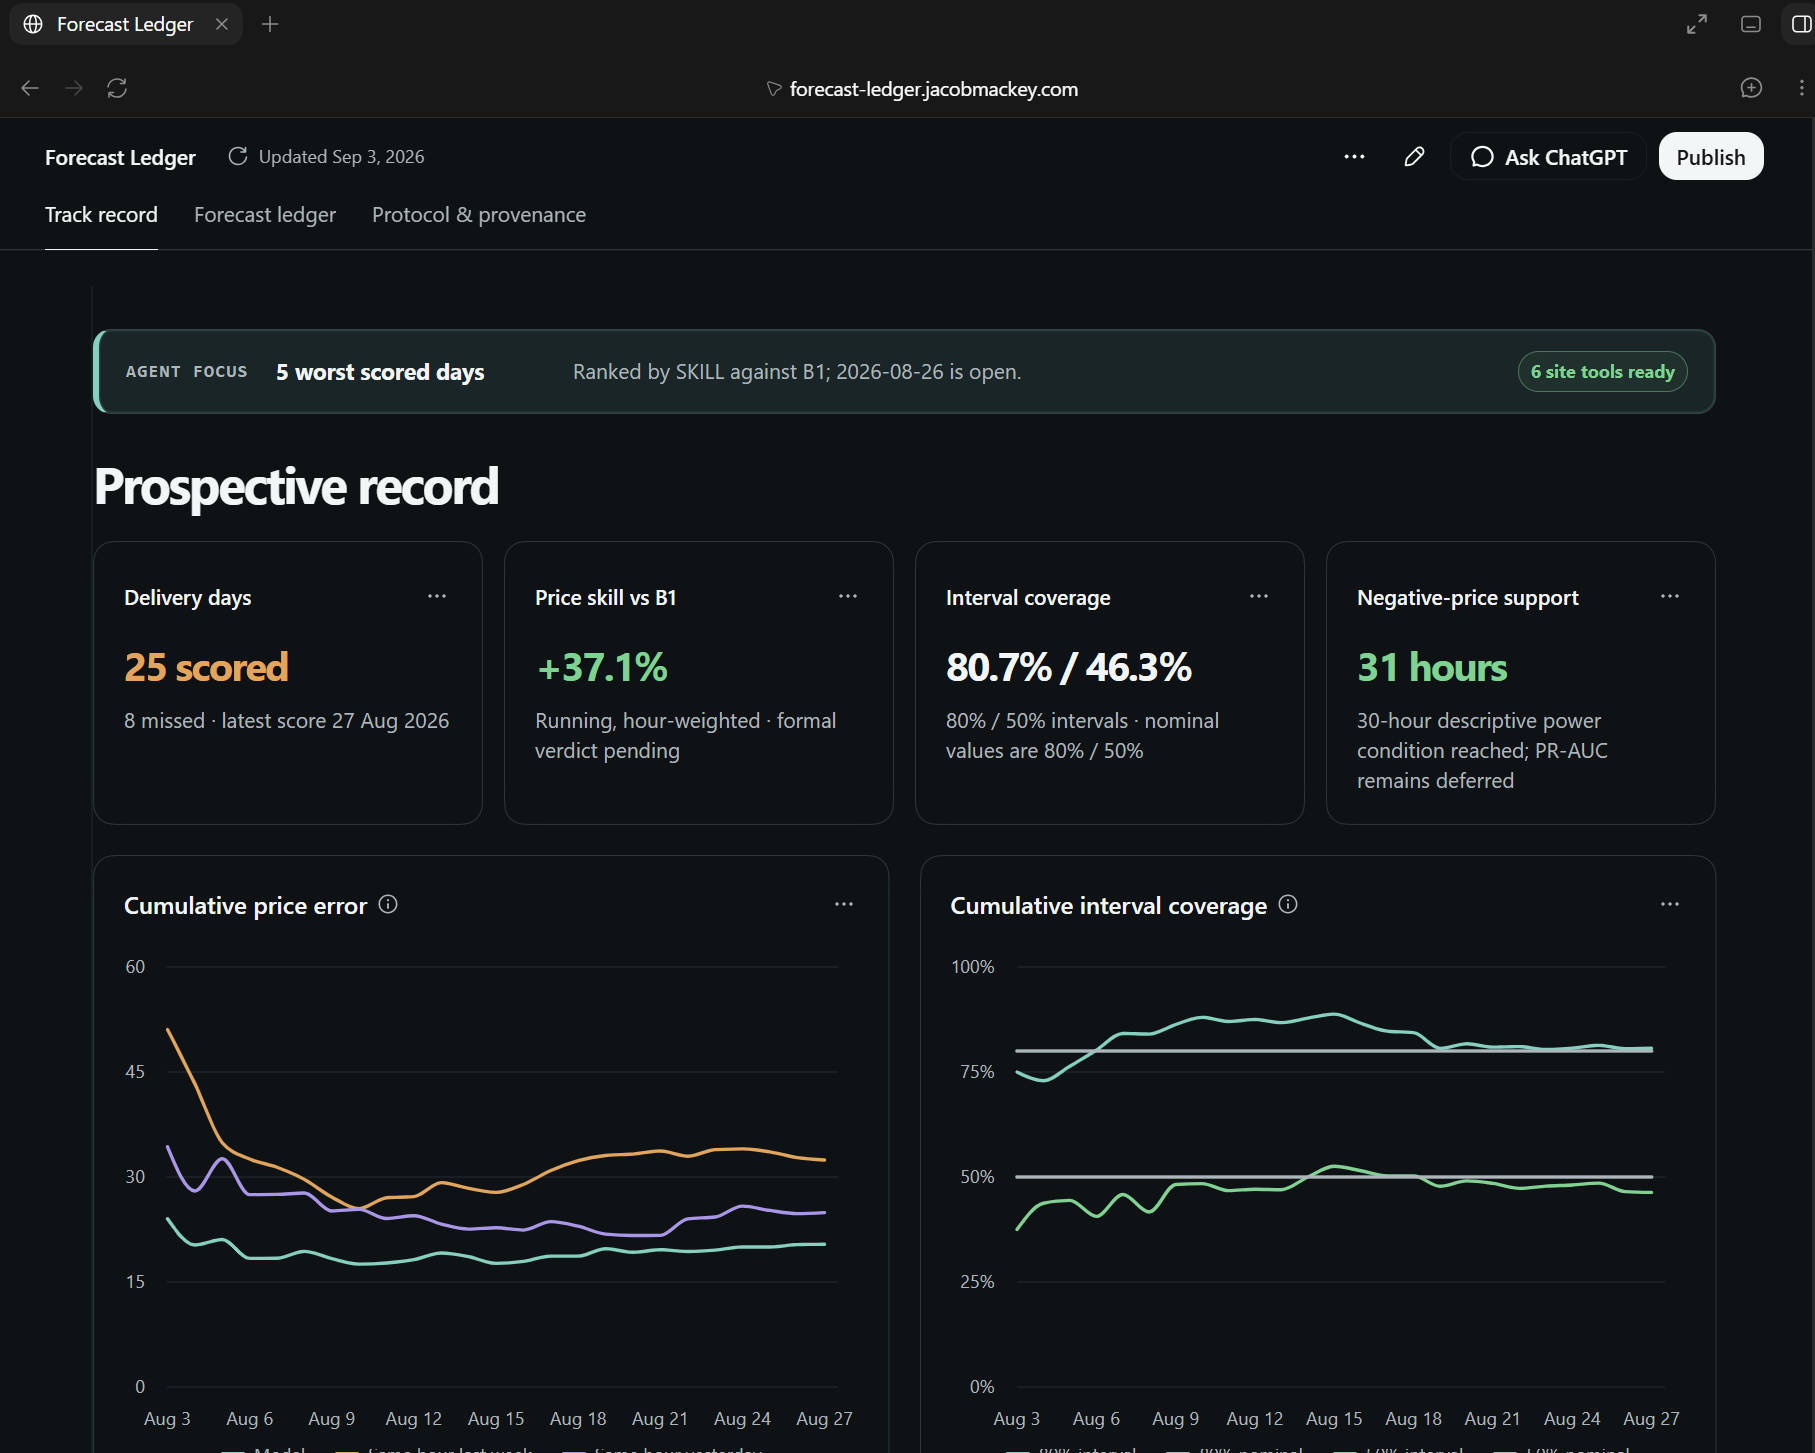
Track-record overview The dashboard at the top with “6 site tools ready,” the running evidence and visible evaluation boundary
-
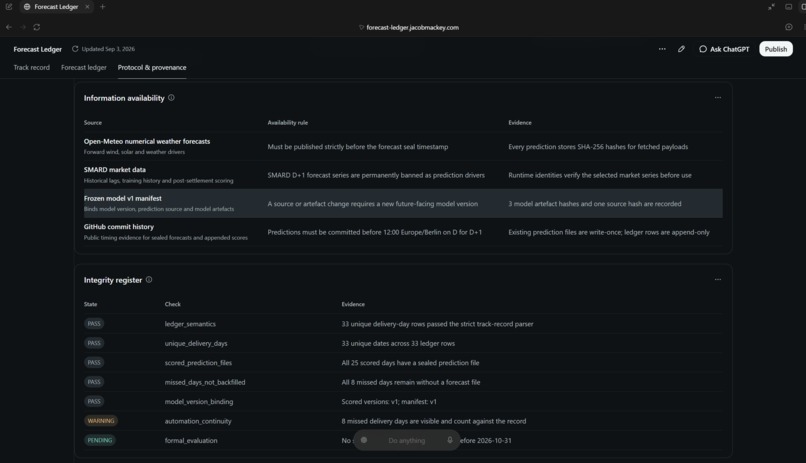
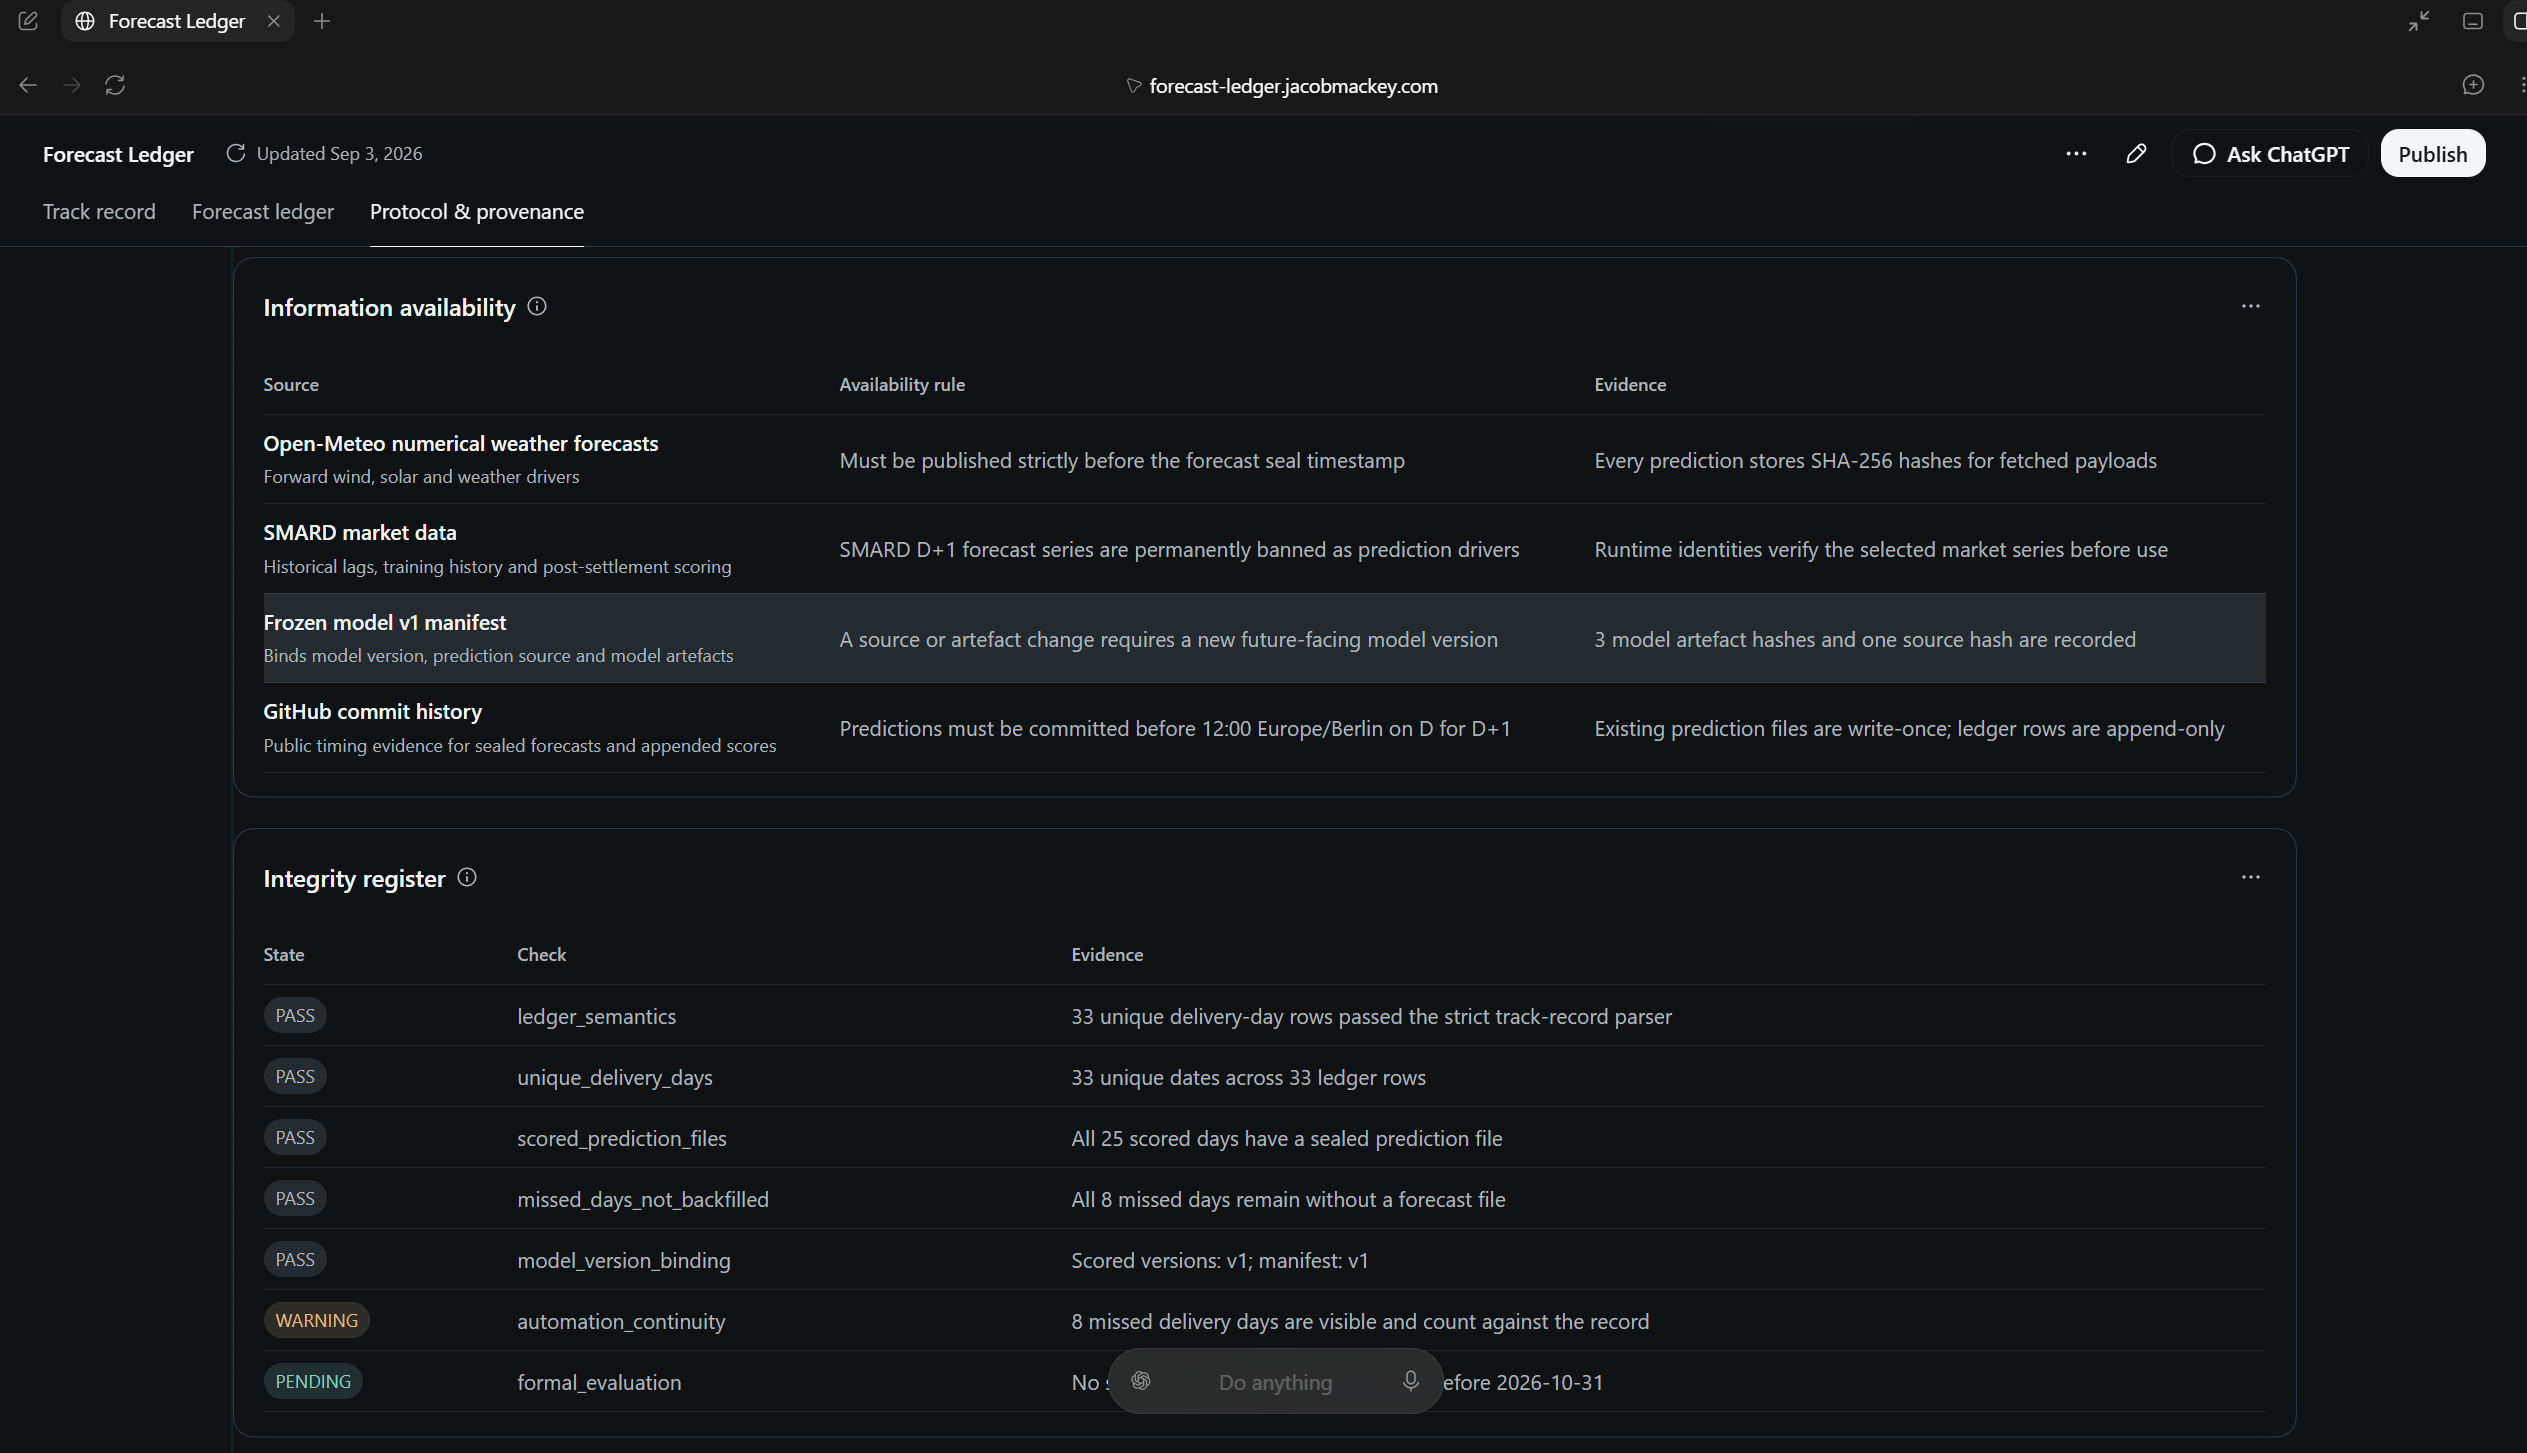
Protocol and provenance The Information availability view showing sources, cutoff rules and integrity evidence.
-
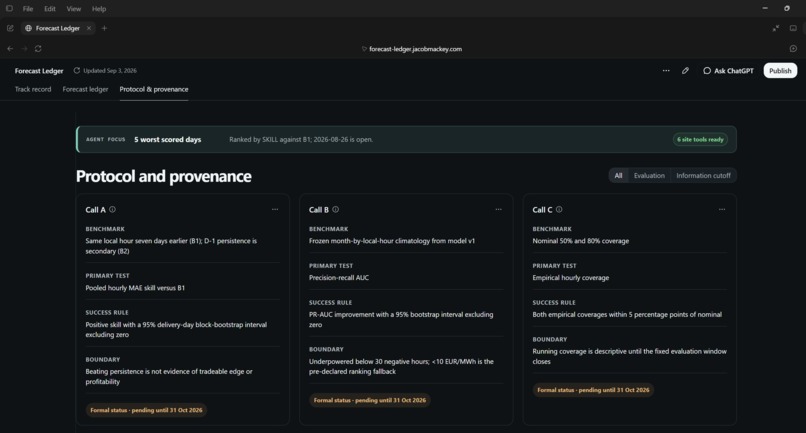
Protocol and provenance The Information availability view showing sources, cutoff rules and integrity evidence.
Inspiration
The original reason I started this work was quite personal. I am planning to reapply to Cobblestone Energy, a proprietary trading firm in European energy markets for the job role of a junior data scientist, in November after interviewing with them in May. I wanted to use the time beforehand to build something directly related to power markets.
I did not want to make another project that only produced a good-looking model score. I wanted to show that I could produce forecasts before the outcomes were known and be honest about the result, even if it did not work.
That became a project forecasting hourly electricity prices in Germany’s day-ahead market, where electricity for the following day is bought and sold through an auction. Each forecast has to be saved and timestamped before that auction closes, meaning the actual prices cannot influence the prediction. Once those prices are published, the score is added without changing the original forecast. If the forecasting process fails on a particular day, that day remains recorded as missed rather than being filled in later.
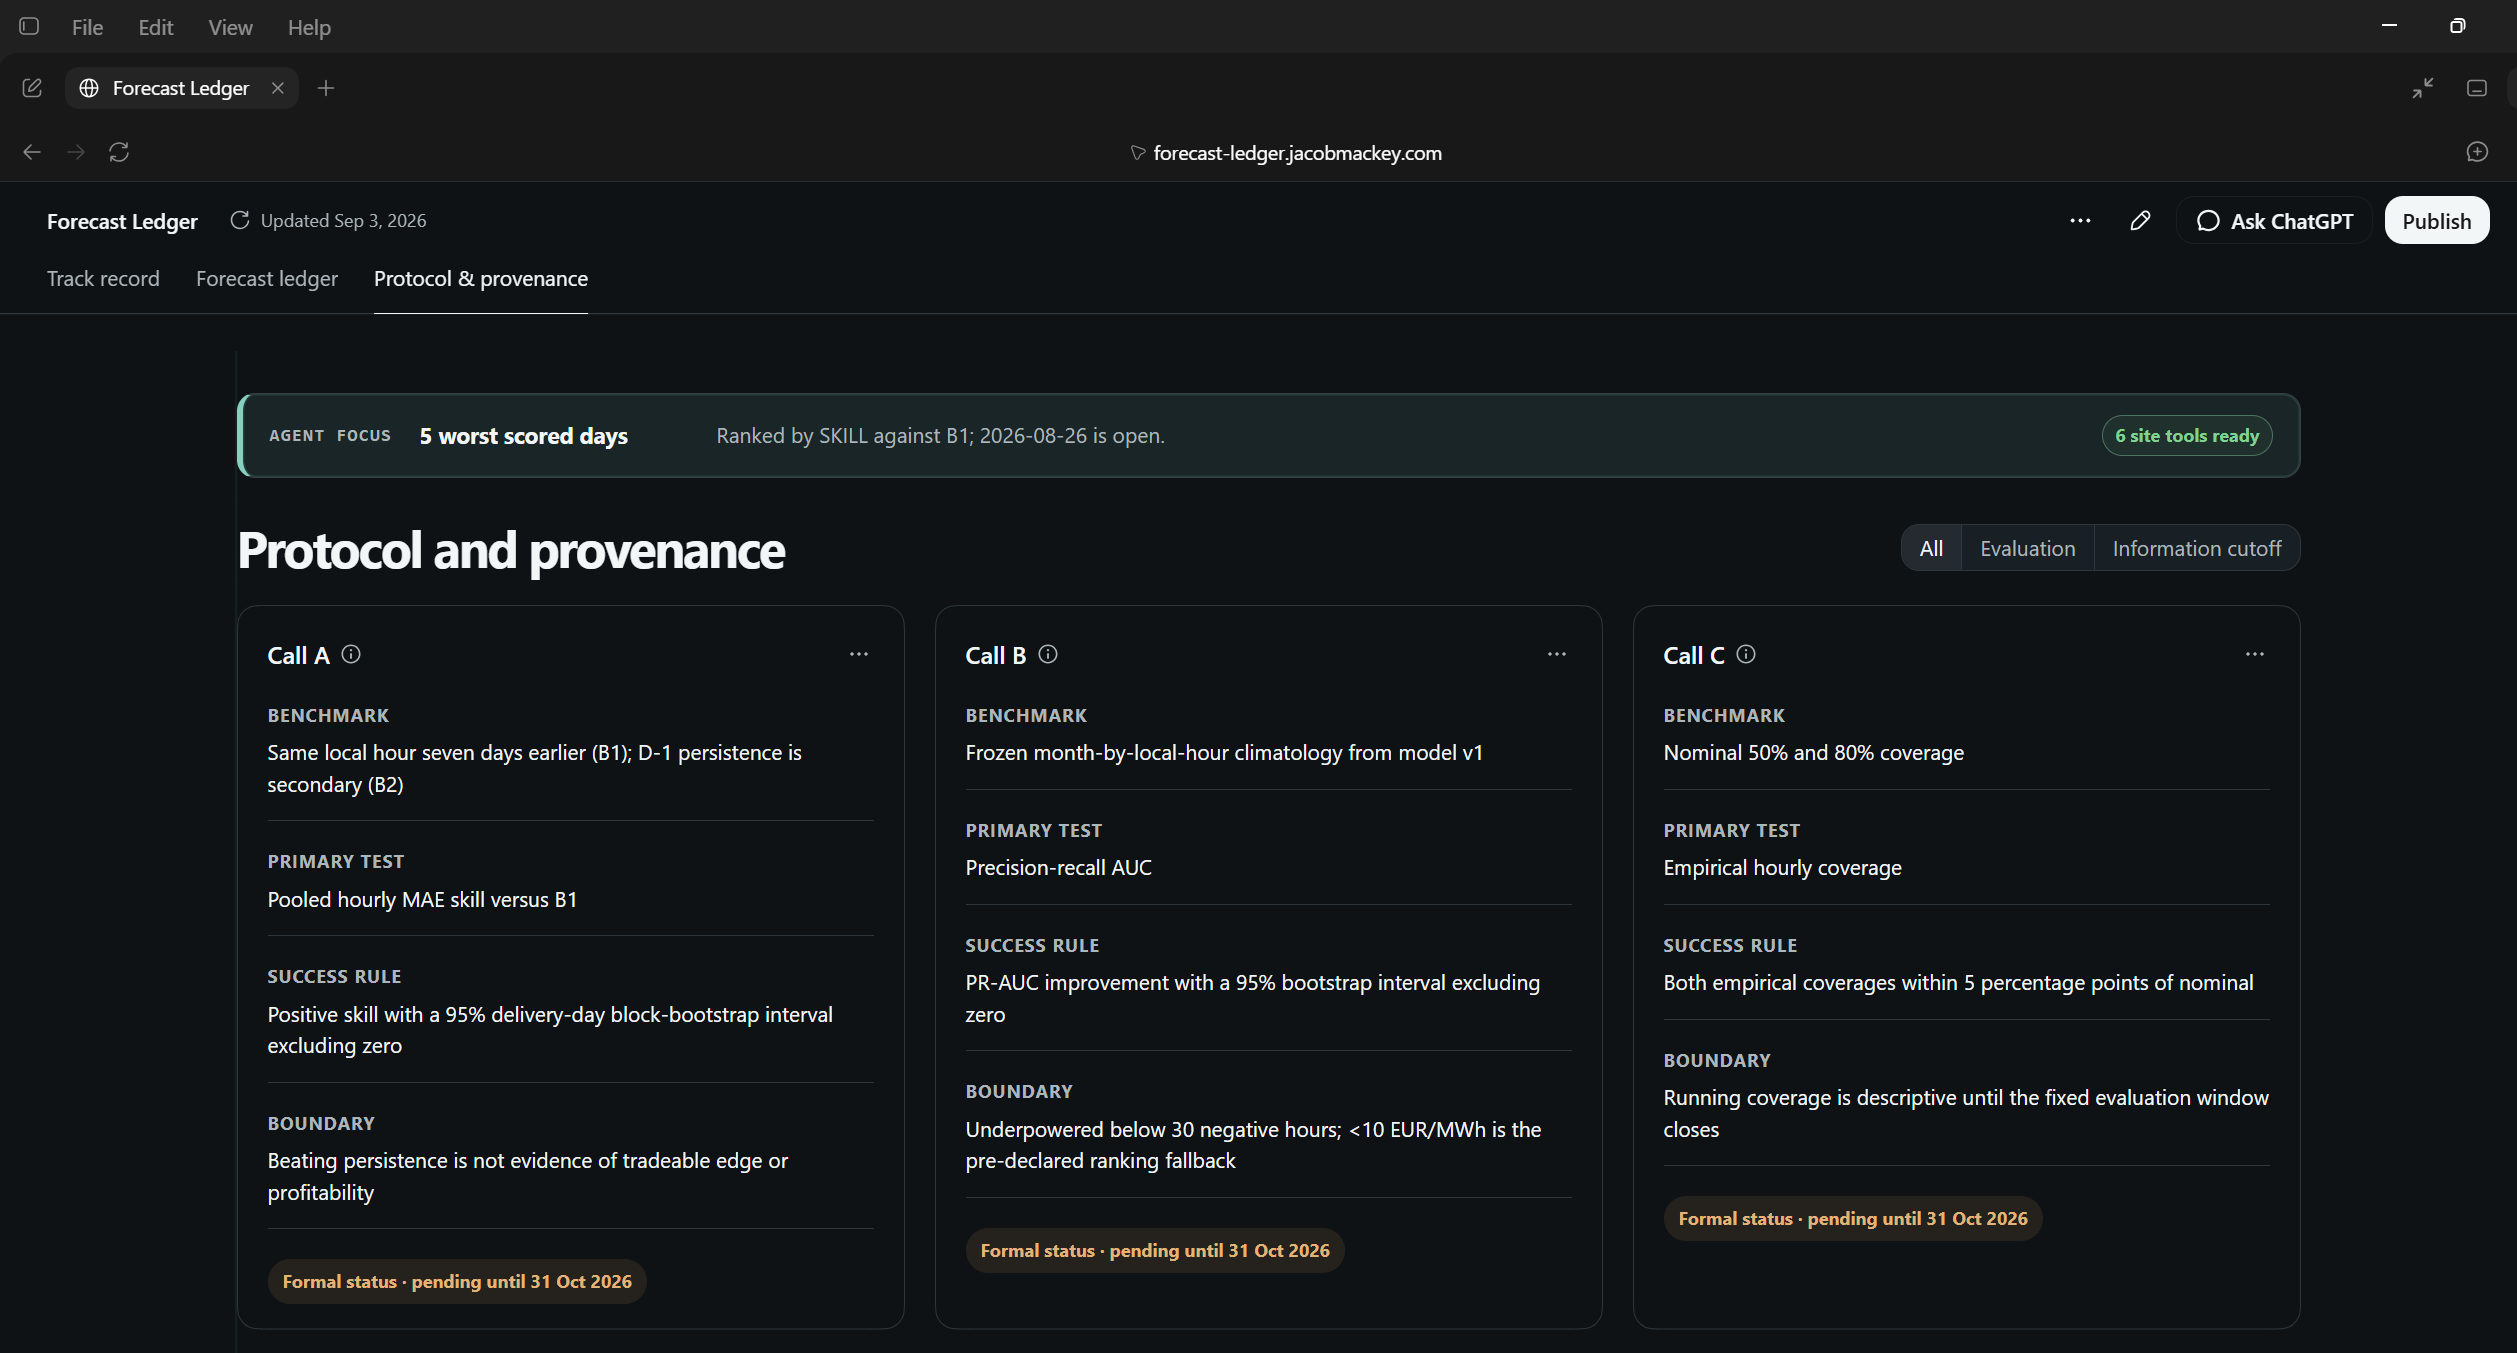
I also decided the evaluation rules in advance. These safeguards reduce the risk of accidentally using future information or only presenting the days when the model worked. Without them, a forecasting chart can look convincing without showing whether the result could really have been achieved at the time.
When I saw the WebMCP Challenge, it seemed like a natural extension of what I was already building. The evidence was there, but it was spread across files, tables and charts. A person could investigate it, while an agent would still have to scrape the page and guess what everything meant. Forecast Ledger was my attempt to let both of them inspect the same record and use the same dashboard, without adding a chatbot or changing the forecasting model itself.
What it does
The site is split into three main views. The track record shows the results collected so far and explains why the final assessment against the pre-agreed rules is still pending. The forecast ledger keeps every scored and missed day visible, while the protocol page explains the tests, data sources and deadlines for when information was allowed to enter each forecast.
I added six WebMCP tools that Codex can discover directly from the page. It can audit the complete record, inspect missed runs, rank the weakest days, open a particular forecast date and check the research protocol.
It can also compare the model with two simple benchmarks: using the price from the same hour one week earlier or the same hour one day earlier. These comparisons help show whether the forecasting model adds anything beyond assuming that recent price patterns will continue.
The main feature is that a tool call also changes what the person using the site can see. In my demo, one prompt asks Codex to audit the record, inspect the misses and rank the five weakest days. The ledger then reorders itself and opens the weakest day. Codex and the person watching are therefore looking at the same evidence rather than separate versions of the analysis.
Why WebMCP
WebMCP lets a website give an AI agent a set of clearly defined tools that it can call.
Without WebMCP, an agent can read parts of the page, but it has to work out for itself which dates, benchmarks and information checks belong together. It may be able to describe a chart, but it does not reliably understand how the different parts of the research record are connected.
With WebMCP, the site tells Codex what it can do and what information each tool needs. Codex receives the evidence in a structured form, while I still have the visual dashboard and can check the result for myself.
How I built it
The existing Python project creates and timestamps the forecasts, then adds their scores to a public record once the actual prices are known. For the challenge, I built an exporter that matches each fixed forecast with its later outcome and writes a checked copy of the record for the browser app.
I built the interface with React, Vite and Recharts, then registered the six tools using document.modelContext.registerTool(). The tools reuse the dashboard’s existing filters, sorting and selections instead of creating a separate interface for Codex.
Each tool defines the information it accepts through a JSON schema and checks dates and allowed options before running. I also made each tool wait for the dashboard to reach the requested view before returning. This helps ensure that the answer Codex gives matches the evidence visible on the screen.
I added tests covering the calculations, tool registration, valid and invalid inputs, interface changes and the static deployment.
There is no OpenAI API backend. The AI in this project is Codex using the WebMCP tools supplied by the page.
Challenges
The first challenge was keeping the WebMCP work separate from the forecasting project that was already running. I did not want the new interface to interfere with the live record, so I preserved the Git history, marked where the challenge work began and switched off the copied automatic forecast jobs. The original repository still handles the forecasts and scoring, while the challenge version only displays a checked snapshot.
The second challenge was getting to grips with WebMCP. I had heard of MCP and understood the general idea, but registering tools inside a website I had built and then getting Codex to run them against the live page was new to me. Understanding how the structured inputs, tool results and visible dashboard state needed to work together was a real learning curve.
The final challenge was presenting the project clearly in a two-minute video. I had to work out when to move between sections, how far to scroll and how quickly I could speak without rushing. The Codex audit also takes close to a minute, so I had to show that it was genuinely running while speeding up the waiting section enough to keep the whole video within the limit.
What I learned
The main thing I learned is that WebMCP works best when the tools use the same actions already available to a person using the site. Reusing the dashboard’s real filters, sorting and selections meant that Codex and the person watching were always looking at the same evidence.
I also learned the difference between changing the evidence and changing how it is displayed. The research record itself is read-only: Codex cannot alter the forecasts, scores or rules. It can still move between tabs, filter the ledger, change its order and select a day to help the person using the site investigate the record.
Boundaries
Forecast Ledger is for auditing forecasting research, not making trades. It does not calculate profit and loss. Its benchmarks are simple historical comparisons rather than a test against the market’s own expectations.
Missed runs cannot be repaired later, and the project will not decide whether the model passed its pre-agreed tests until the evaluation period ends. The current result may look encouraging, but the final evaluation could still find no meaningful improvement.

Log in or sign up for Devpost to join the conversation.