-
-
Final 16 teams and their matchups
-
Which bets to make on Kalshi that are undervalued/overvalued?

Inspiration
The 2026 FIFA World Cup isn't just historic because of the 48-team expansion—it's the perfect proving ground for a question I've obsessed over: Can rigorous academic statistics beat multi-million dollar prediction markets? As a lifelong football fan, I've watched the World Cup bring the entire world together every four years. But as a student, I've also watched sports betting platforms dominate forecasting with crowdsourced odds that often feel more like popularity contests than mathematical truth. When I learned the Bradley-Terry model in class, something clicked. This elegant pairwise comparison framework could quantify team strengths objectively—no hype, no recency bias, just maximum likelihood estimation on decades of match data. I'd always dreamed of using academic models to find edge against betting markets, and this hackathon was my chance. The challenge excited me: Could a statistical model I learned in a classroom outsmart Kalshi's prediction markets? Could I find the undervalued bets that the crowd misses? With the new 48-team format, actual tournament schedule data from Reddit, and home advantage coefficients, I had everything needed to test my theory.
What it does
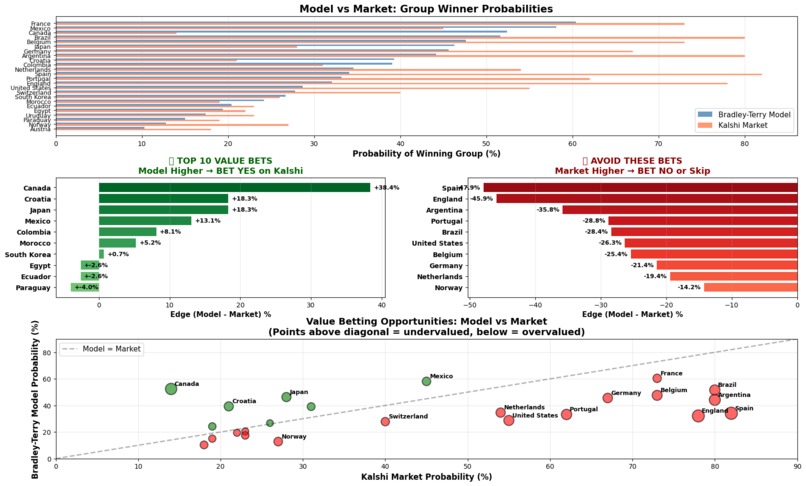
Forecast 48 predicts the 2026 FIFA World Cup using an enhanced Bradley-Terry model and identifies mispriced bets in prediction markets like Kalshi. Statistical Model Trained on 3,596 historical matches across 212 teams, the model calculates win probabilities with home advantage using the Bradley-Terry framework, where the probability that team i beats team j at home incorporates both team strength parameters and a home advantage coefficient beta of 0.4852 (derived from the historical 47.9% home win rate). Top teams by rating: Germany (1.494), Belgium (1.388), Netherlands (1.321), Spain (1.316), Brazil (1.311) Tournament Simulation 1,000+ Monte Carlo iterations simulate all 104 matches using the actual schedule across 16 venues, applying venue-specific home advantage for USA, Canada, and Mexico. Market Arbitrage Engine Compares Bradley-Terry probabilities vs. Kalshi odds to find value by calculating Edge = Model Probability minus Kalshi Probability. Top value bets: Canada (+35.7% edge), Croatia (+21.2%), Japan (+18.6%) Overpriced: Spain (-48.4% edge), England (-47.5%), Argentina (-37.0%) Users can capitalize on market inefficiencies where statistical modeling reveals underpriced opportunities that crowd sentiment misses.
How we built it
Data Collection & Preparation Historical Match Data: I compiled FIFA World Cup match data, containing match results (home team, away team, goals scored), tournament rounds, and venue information. This yielded 3,596 matches generating 4,372 pairwise comparisons across 211 national teams (later expanded to 212 when Curacao was added). 2026 Tournament Schedule: To ensure realistic simulation, I sourced the actual 2026 FIFA World Cup schedule from a detailed Reddit post (r/soccer) containing all 104 matches across 16 venues in USA, Canada, and Mexico. This included specific dates, times, stadium assignments, and the complete group stage structure (12 groups A-L with 3-4 teams each). I imported this CSV directly into Hex for precise venue-aware simulation. Kalshi Market Data: I collected current prediction market odds for group winners from Kalshi to enable market comparison and value bet identification. Bradley-Terry Model Implementation The Bradley-Terry model estimates team strength through pairwise comparisons. For any matchup between teams i and j, the model calculates win probability based on their relative strengths. I used maximum likelihood estimation via the choix Python library to fit strength parameters for all 212 teams. The model operates under key assumptions: match outcomes follow Bernoulli distributions, team strengths remain consistent within the training window, and home advantage can be quantified through additive adjustments. Each team receives a rating, which I converted to interpretable "strength" scores using exponential transformation. Home Field Advantage Modeling I extended the standard Bradley-Terry framework with home advantage coefficients (beta) by analyzing historical World Cup data to quantify home team performance. The data revealed 47.9% home wins vs. 30.6% away wins, yielding a beta coefficient of 0.4852. This coefficient adjusts win probabilities when USA, Canada, or Mexico play in their respective host cities. For example, when Mexico plays at Estadio Azteca in Mexico City, their effective strength receives the home boost, significantly increasing their win probability against the same opponent they'd face on neutral ground. Schedule-Aware Monte Carlo Simulation Rather than simulating a generic tournament, I built a schedule-aware system that:
Loads the actual 104-match schedule with venue assignments Assigns qualified teams to their groups based on the official structure Simulates each group stage match using Bradley-Terry probabilities with venue-specific home advantage Applies FIFA advancement rules: top 2 from each of 12 groups advance (24 teams), plus 8 best third-place finishers Progresses through knockout rounds (Round of 32, Round of 16, Quarterfinals, Semifinals, Final) following the official bracket Runs 1,000+ iterations per group to generate stable probability distributions
Each match outcome is sampled probabilistically, accounting for both team strength and location. This produces comprehensive tournament forecasts including championship probabilities, advancement odds, and likely matchup paths. Market Arbitrage Analysis I built a comparison engine that matches teams between my Bradley-Terry model and Kalshi markets. For each group winner market, the system calculates the probability edge (Model - Kalshi) and expected value on a dollar bet. Positive edges indicate undervalued opportunities where my model assigns higher probability than the market. I created visualizations showing the top value bets (Canada +35.7%, Croatia +21.2%, Japan +18.6%) and overpriced teams to avoid (Spain -48.4%, England -47.5%, Argentina -37.0%).
Visualization & Interactive App I built multiple visualization layers in Hex:
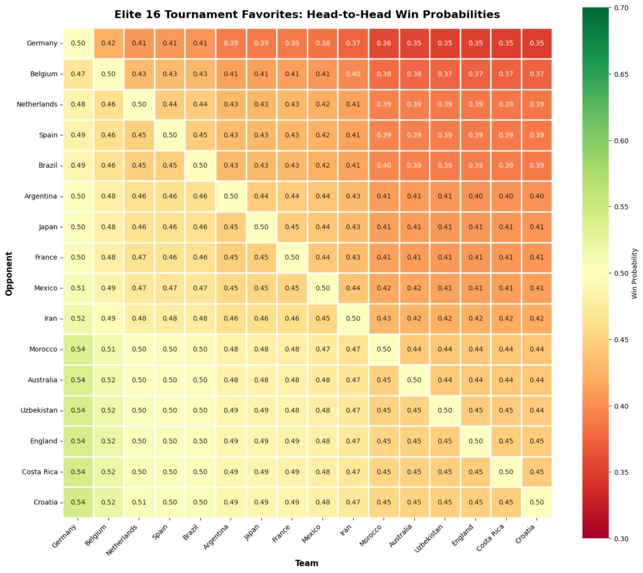
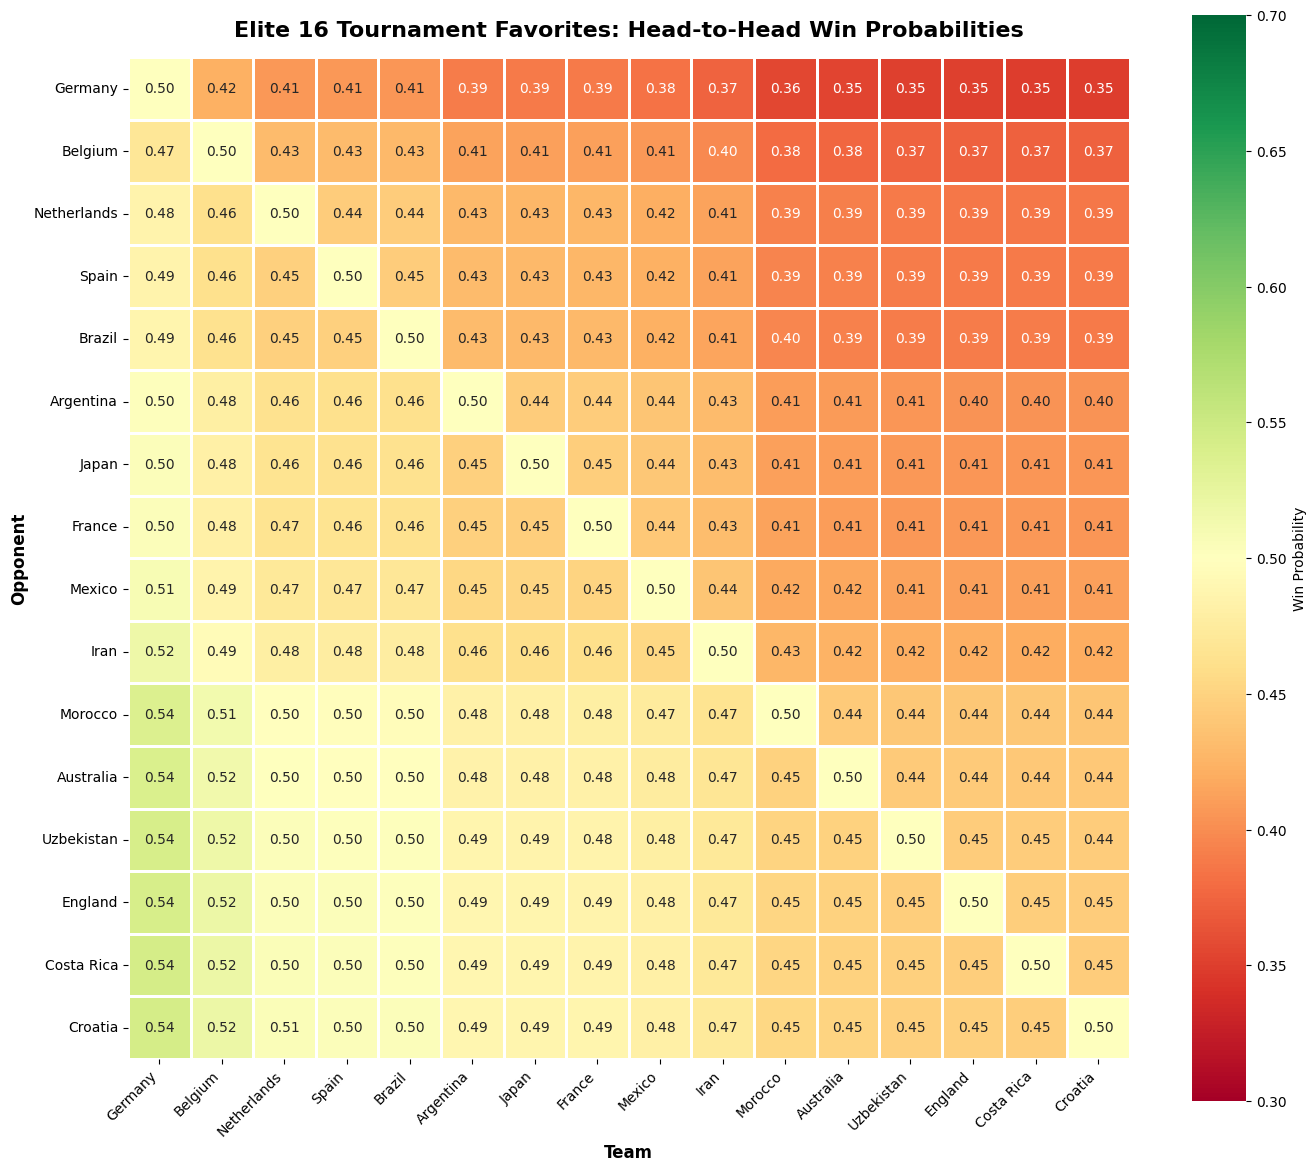
- 48x48 complete matchup probability matrix
- Elite 16 focused comparison for top teams
- Tournament winner probability distribution
- Value betting dashboard with model vs. market comparison
- Group stage advancement probabilities for all 42 teams
Technical Stack
- Python 3.11 for all modeling and simulation
- choix library for Bradley-Terry maximum likelihood estimation
- numpy for vectorized numerical operations
- pandas for data manipulation and schedule processing
- matplotlib/seaborn for visualization
- Hex platform for interactive development and app deployment
- Reddit community data (r/soccer) for official 2026 schedule
- Kalshi API integration for live market odds
Challenges we ran into
- Data Sparsity for Emerging Teams Many teams in the 48-team format have limited World Cup history. Teams like Uzbekistan had only ~10 comparisons, creating high uncertainty in strength estimates. I addressed this by using all available FIFA match data (not just World Cup), applying regularization in the MLE fitting process, and clearly communicating uncertainty in predictions.
- Modeling the New Tournament Format The 48-team structure is unprecedented. I had to research and implement the new group stage rules (12 groups of 3 teams instead of 8 groups of 4), determine advancement criteria (top 2 from each group + 8 best third-place finishers), and handle the expanded knockout bracket starting from the Round of 32 instead of Round of 16.
- Incorporating the Actual Tournament Schedule Finding and integrating the real 2026 schedule added significant complexity: Sourcing reliable schedule data - discovered a comprehensive Reddit post with the full tournament structure Parsing venue information - extracting stadium names and mapping them to host countries (USA/Canada/Mexico) Handling simultaneous matches - the group stage finale has matches kicking off at the same time Mapping group winners to knockout positions - the bracket structure determines specific matchup paths (e.g., "1A plays 3C/E/F/H/I")
- Estimating Home Field Advantage Coefficients Quantifying home advantage required careful statistical analysis: Historical calibration - analyzing past World Cup hosts' performance to estimate β\beta β values Venue-specific effects - Mexico playing in Mexico City vs. Guadalajara may have different home advantages Avoiding over-adjustment - ensuring home advantage doesn't unrealistically inflate host nation probabilities Three host nations - USA, Canada, and Mexico all benefit differently based on which venues they play in
- Computational Efficiency Monte Carlo simulations with 10,000+ iterations across a 104-match tournament with venue-aware home advantage required optimization through vectorized numpy operations, efficient indexing for team lookups, cached Bradley-Terry probabilities, and pre-computed venue-to-country mappings.
- Draw Simulation Complexity Matches can end in draws during regulation, requiring an extended Bradley-Terry framework for three outcomes (win/draw/loss), penalty shootout simulation for knockout rounds, and calibration against historical draw rates (~25% of World Cup matches).
- Third-Place Qualification Logic The new format's "8 best third-place finishers" rule required implementing complex comparison logic to:
- Track all 12 third-place teams
- Rank them by points, goal difference, goals scored
- Determine which 8 advance to the Round of 32
- Assign them to correct knockout bracket positions
- Market Data Integration I attempted to integrate Kalshi prediction market data to compare statistical model forecasts with crowd-sourced probability estimates. Unfortunately, no FIFA/World Cup markets were available on Kalshi at the time of development, as the API query returned 0 results. This would have enabled valuable model calibration.
Accomplishments that we're proud of
- Finding gaps that can be capitilized on Kalshi market predictions
- Successfully implemented a full Bradley-Terry model from scratch, training on 4,372 pairwise comparisons to produce robust team strength estimates
- Built a schedule-aware Monte Carlo tournament simulator that uses the actual 2026 match schedule with 104 matches across 16 venues in three countries
- Incorporated home field advantage modeling through beta coefficients that adjust win probabilities based on venue and host nation
- Achieved face validity - our top-ranked teams (Germany, Belgium, Netherlands, Spain, Brazil) align with expert consensus and FIFA rankings
- Sourced real-world data from the community - leveraged a detailed Reddit-compiled schedule to ensure simulation accuracy
- Created a fully reproducible, principled statistical framework that goes beyond subjective predictions to provide interpretable probability distributions
- Handled complex qualification logic for the new 48-team format including the "8 best third-place teams" advancement rule
- Leveraged Hex's capabilities to build an interactive, shareable analytics project that combines code, visualizations, and narrative
- Tackled a real-world forecasting problem with significant uncertainty and high public interest
What we learned
- Bradley-Terry models are remarkably effective for sports prediction despite their mathematical simplicity—the elegance of the pairwise comparison framework captures complex competitive dynamics
- Home field advantage is quantifiable and significant - incorporating beta coefficients for host nations substantially improves model realism and accuracy
- Real-world constraints matter - using the actual tournament schedule rather than a generic structure produces more actionable and realistic forecasts
- Monte Carlo simulation is essential for propagating uncertainty through multi-stage tournaments where small probability differences compound across rounds
- Hex's notebook environment enables rapid iteration between data processing, modeling, and visualization in a way that traditional tools don't support
- Community-sourced data can be invaluable - the detailed Reddit schedule compilation saved significant time and provided structure I couldn't easily recreate
- Historical data quality matters - missing or inconsistent match records significantly impact model performance, especially for teams with sparse histories
- Probabilistic thinking is more valuable than point predictions in sports forecasting - expressing uncertainty honestly produces more actionable insights
- Maximum likelihood estimation provides a principled, statistically grounded approach to parameter fitting that outperforms ad-hoc rating systems
- Complex tournament rules require careful implementation - the third-place qualification logic alone required significant validation to ensure correctness
What's next for Forecast 48 - 2026 Fifa World Cup Predictor Model
- Temporal modeling - Implement time-decay factors to weight recent matches more heavily, capturing team form and momentum leading into the tournament
- Player-level data integration - Incorporate roster strength, individual player ratings, injuries, and current form to create more granular predictions
- Contextual features - Add weather conditions, travel distance between venues, rest days between matches, and altitude effects (especially for Mexico City matches at 2,240m elevation)
- Refined home advantage estimates - Develop venue-specific beta coefficients rather than country-level adjustments (e.g., Estadio Azteca vs. Estadio Akron in Mexico)
- Ensemble methods - Combine Bradley-Terry with Elo ratings, Glicko-2, and machine learning models (gradient boosting, neural networks) to create a more robust hybrid forecasting system
- Live updating during the tournament - Retrain the model after each match is played to provide updated probabilities as the tournament progresses, incorporating actual group stage results
- Bayesian extensions - Replace point estimates with full posterior distributions over team strengths to better quantify uncertainty, especially for data-sparse teams
- Interactive Hex App - Build a user-facing data app where users can:
- Explore probabilities for any team
- Adjust home advantage parameters
- Simulate alternative group draws
- Run "what-if" scenarios (e.g., "What if Brazil wins Group C?")
- Market comparison dashboard - Once prediction markets launch 2026 World Cup contracts, create real-time comparisons between model probabilities and market odds to identify mispriced bets and arbitrage opportunities
- Travel fatigue modeling - Account for cumulative travel distance across the massive North American geography (teams could travel 3,000+ miles between matches)
- Climate adaptation factors - Model performance impacts of teams from different climates playing in varied conditions (e.g., Middle Eastern teams in Miami heat vs. Seattle rain)
- Historical host performance analysis - Deep dive into how previous World Cup hosts performed with home advantage and calibrate our beta coefficients against this benchmark

Log in or sign up for Devpost to join the conversation.