-
-
-
cover
-
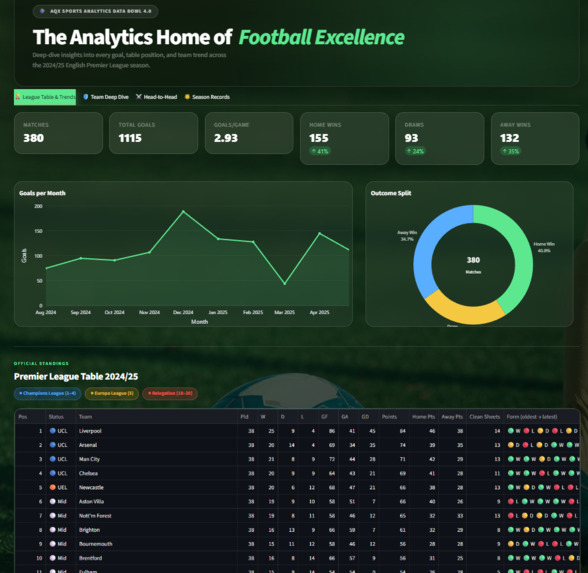
League Table Trend page
-
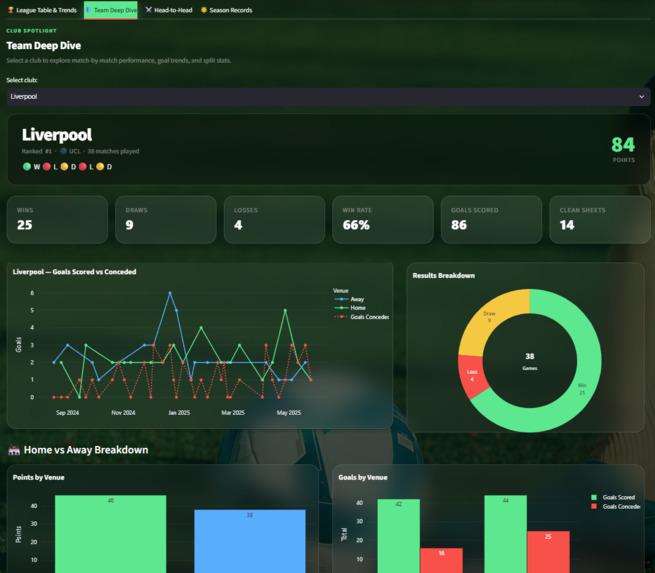
Team Deep Dive page
-
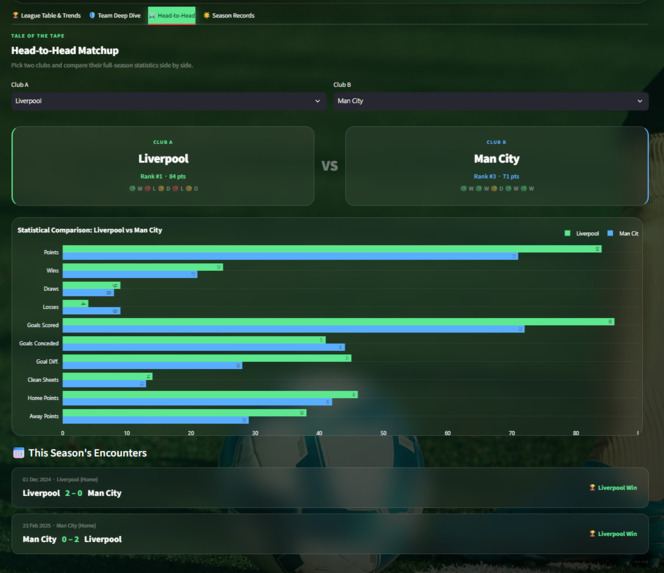
Head To Head page
-
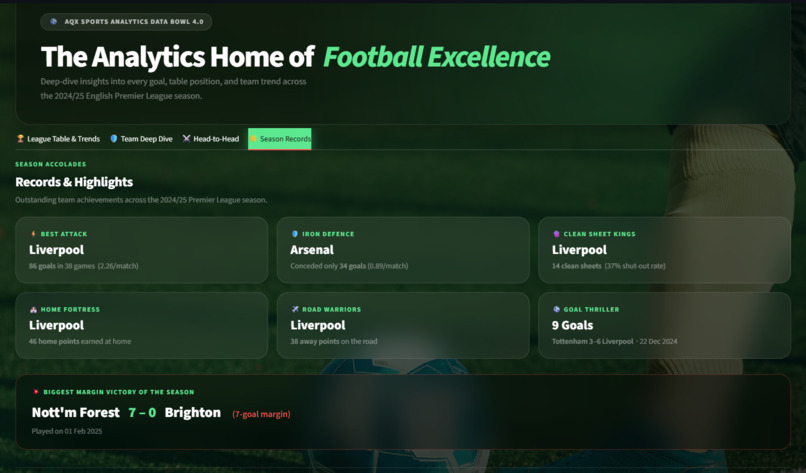
Season Record page
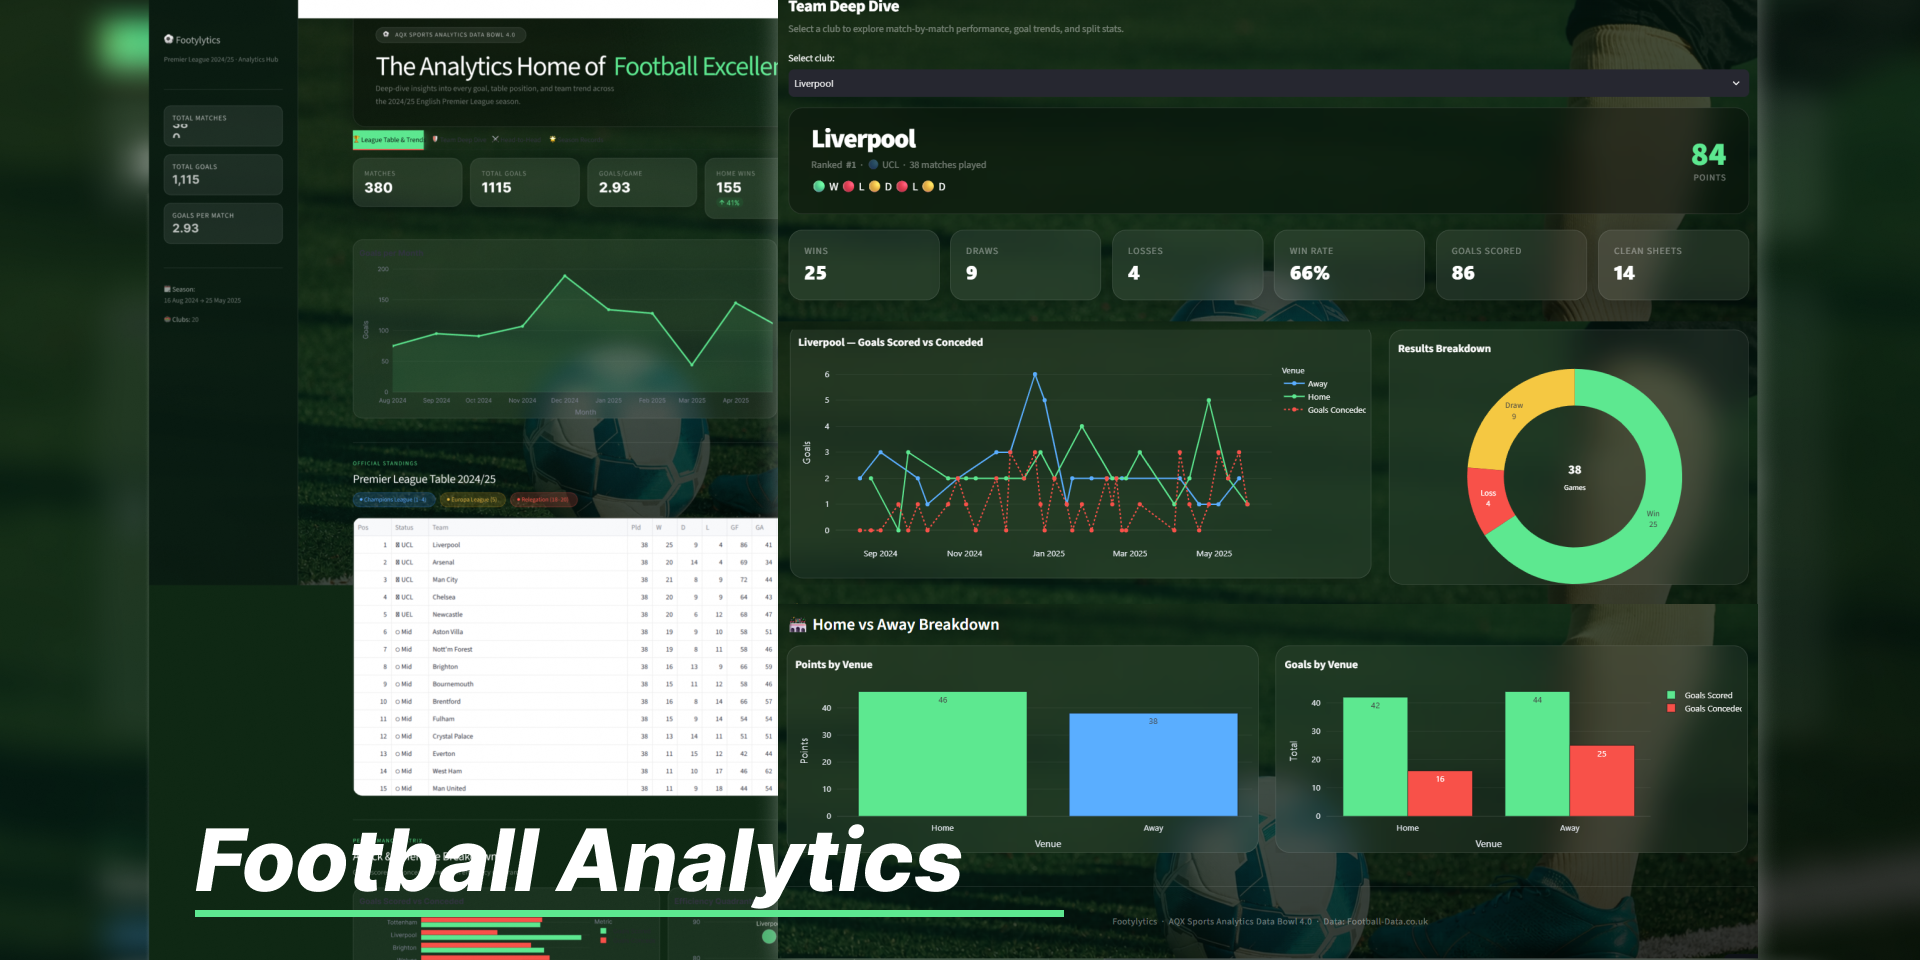
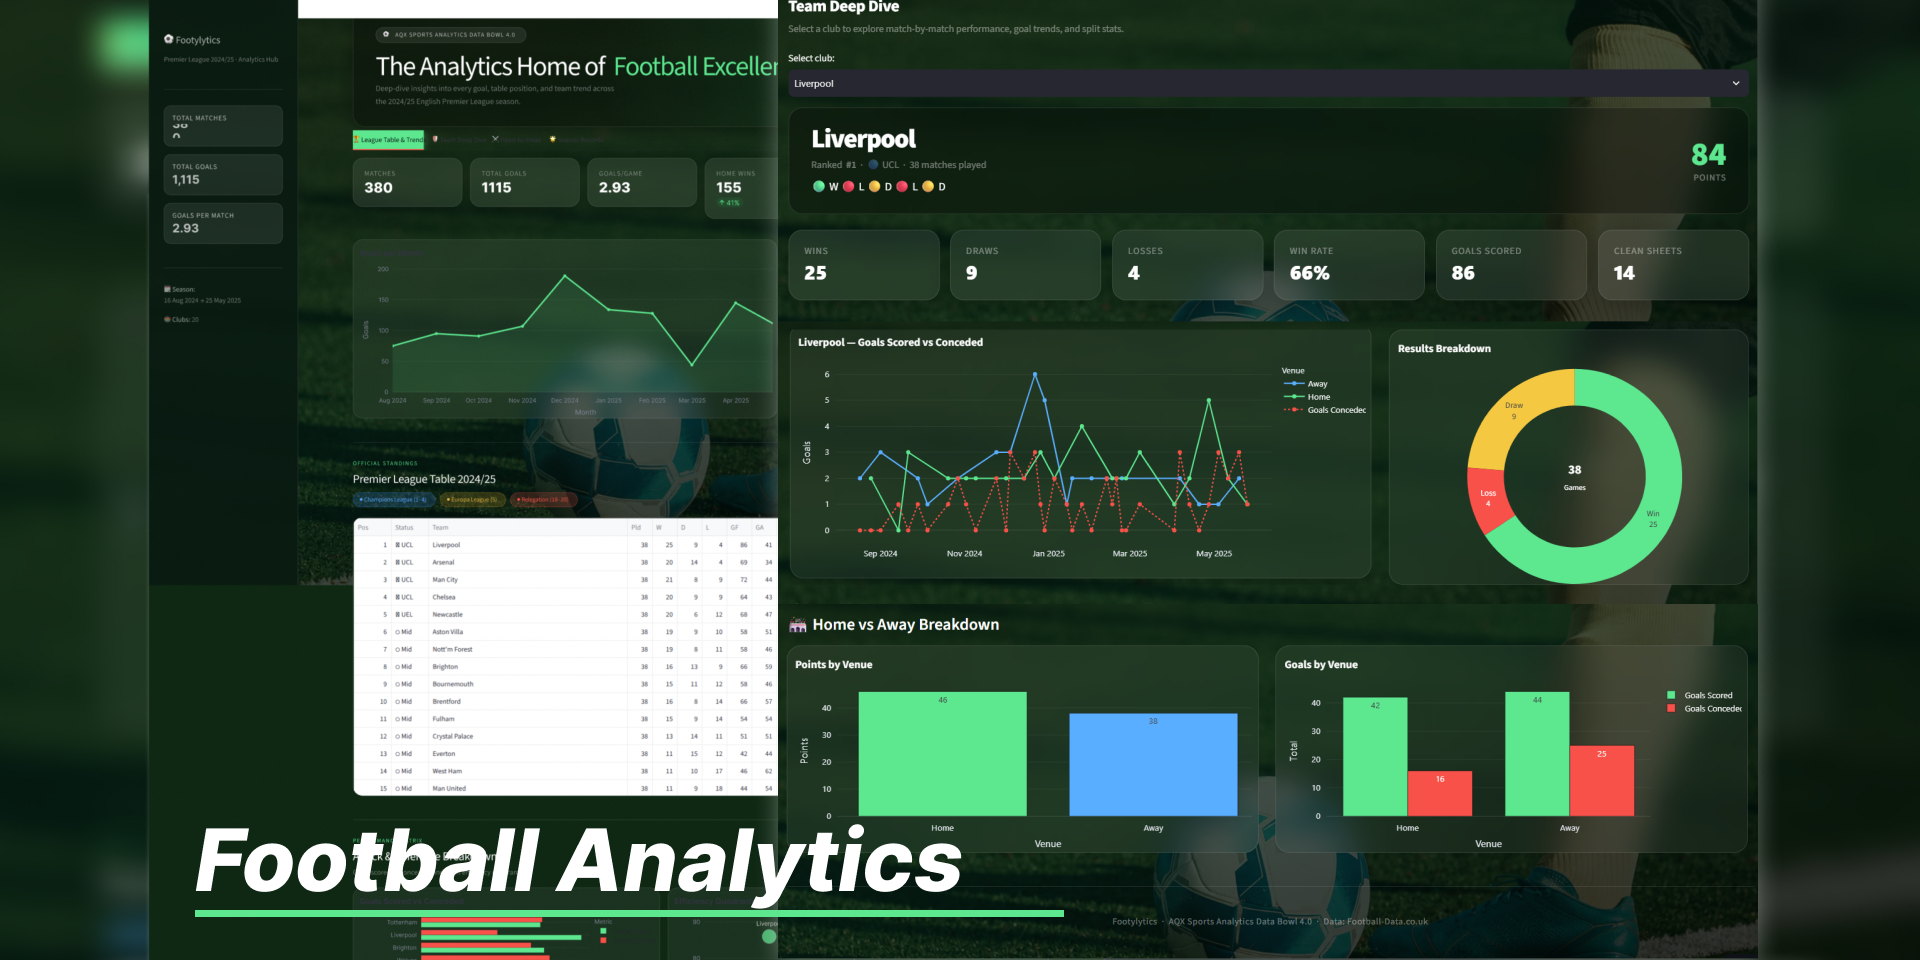
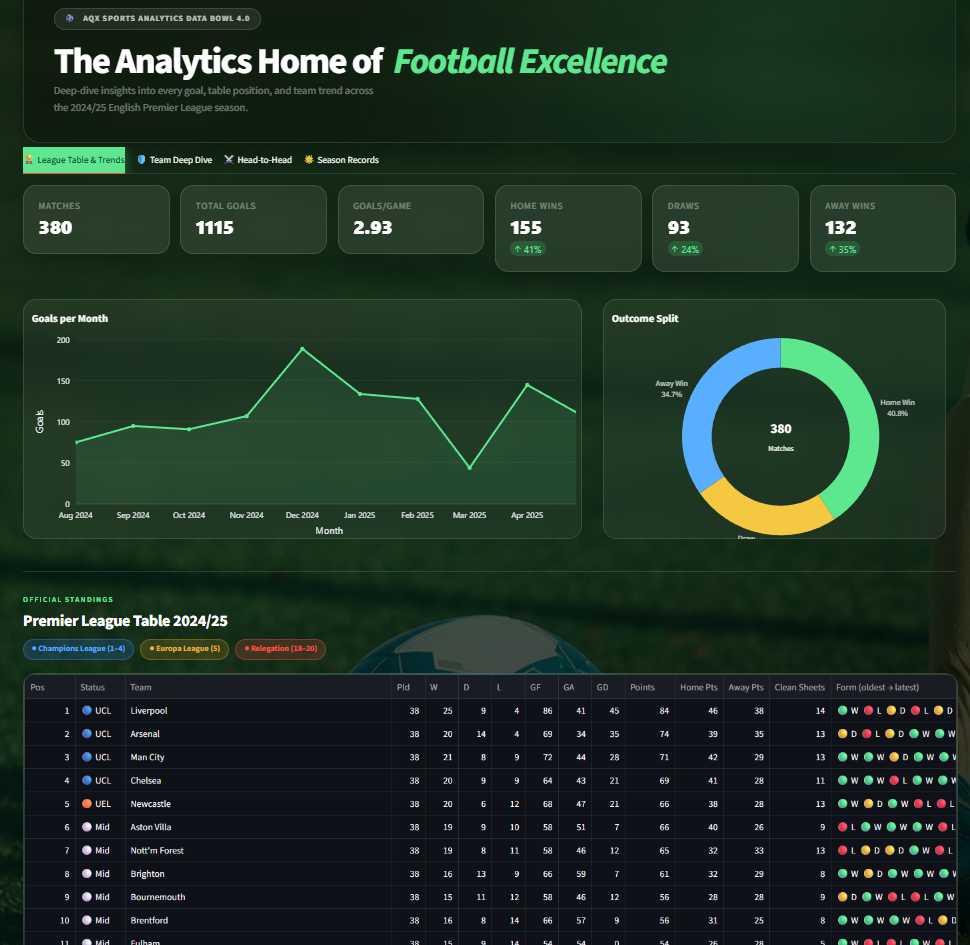
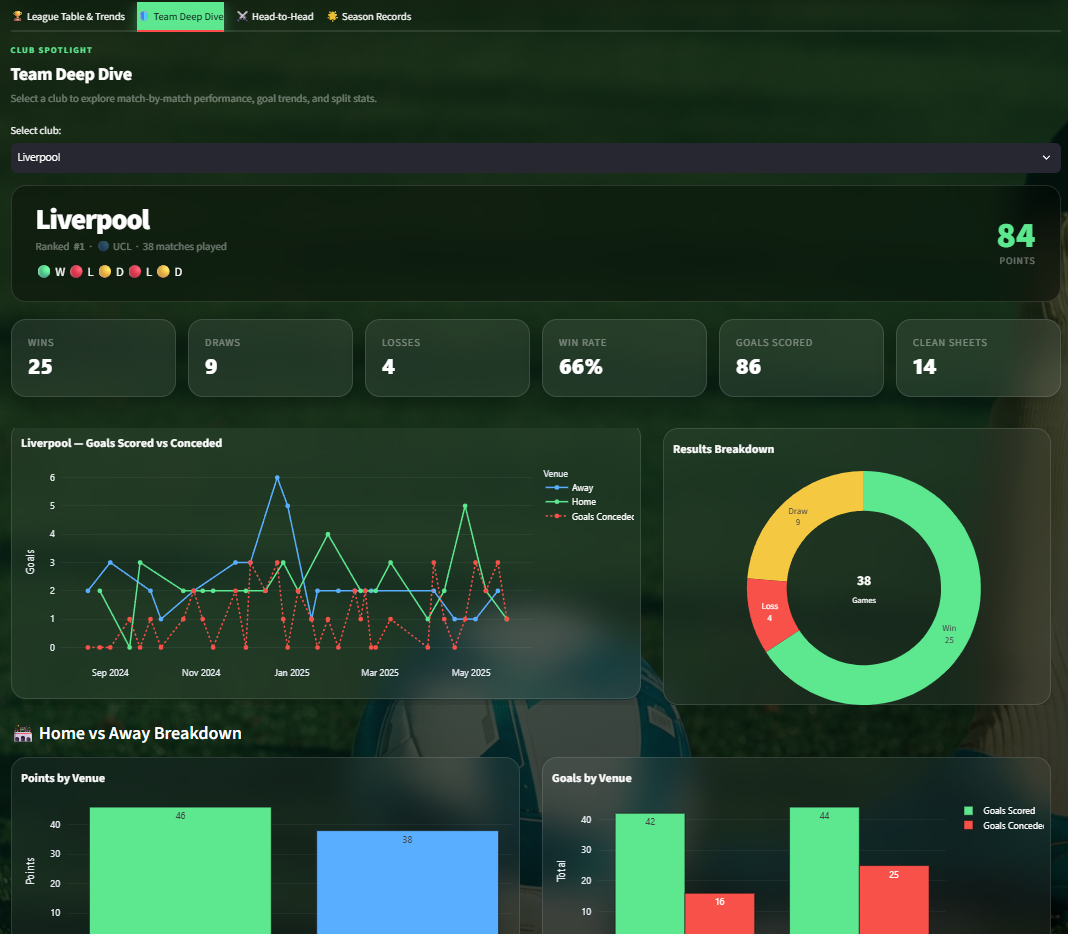
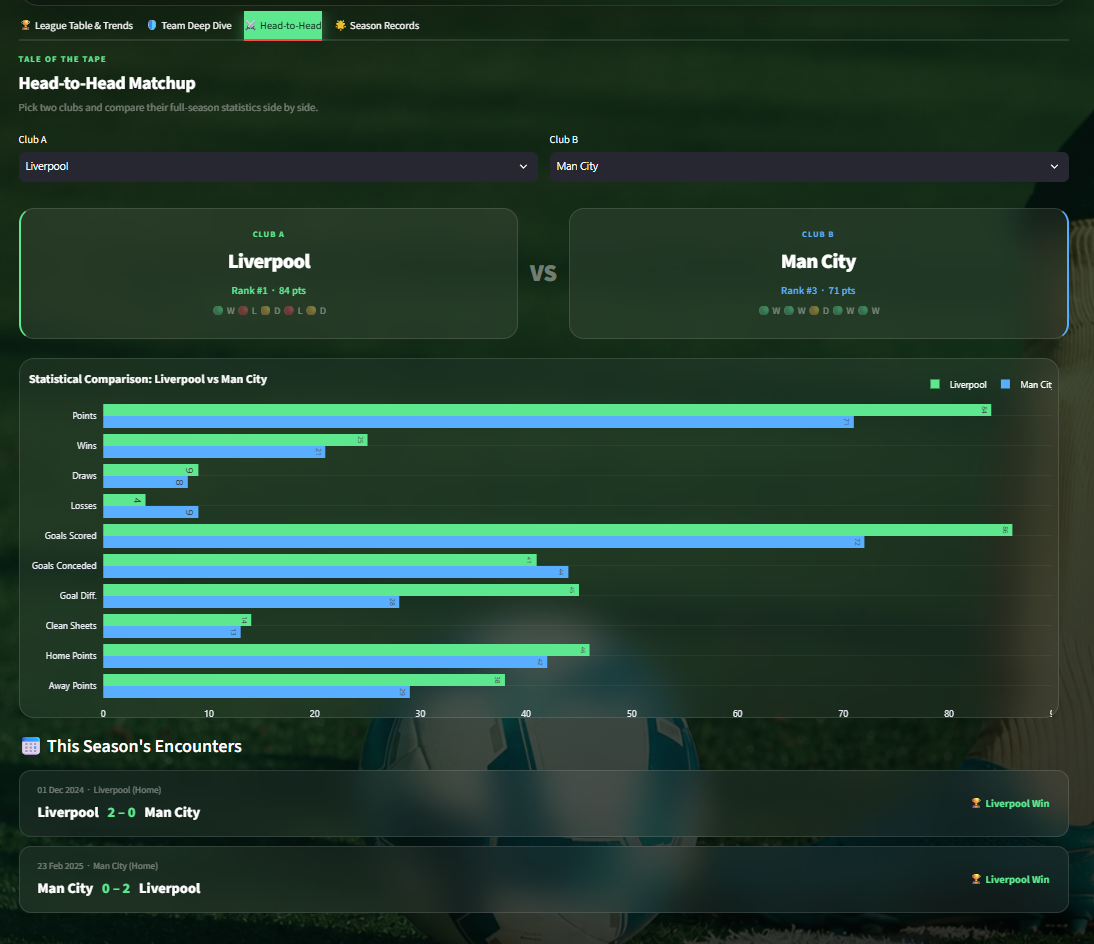
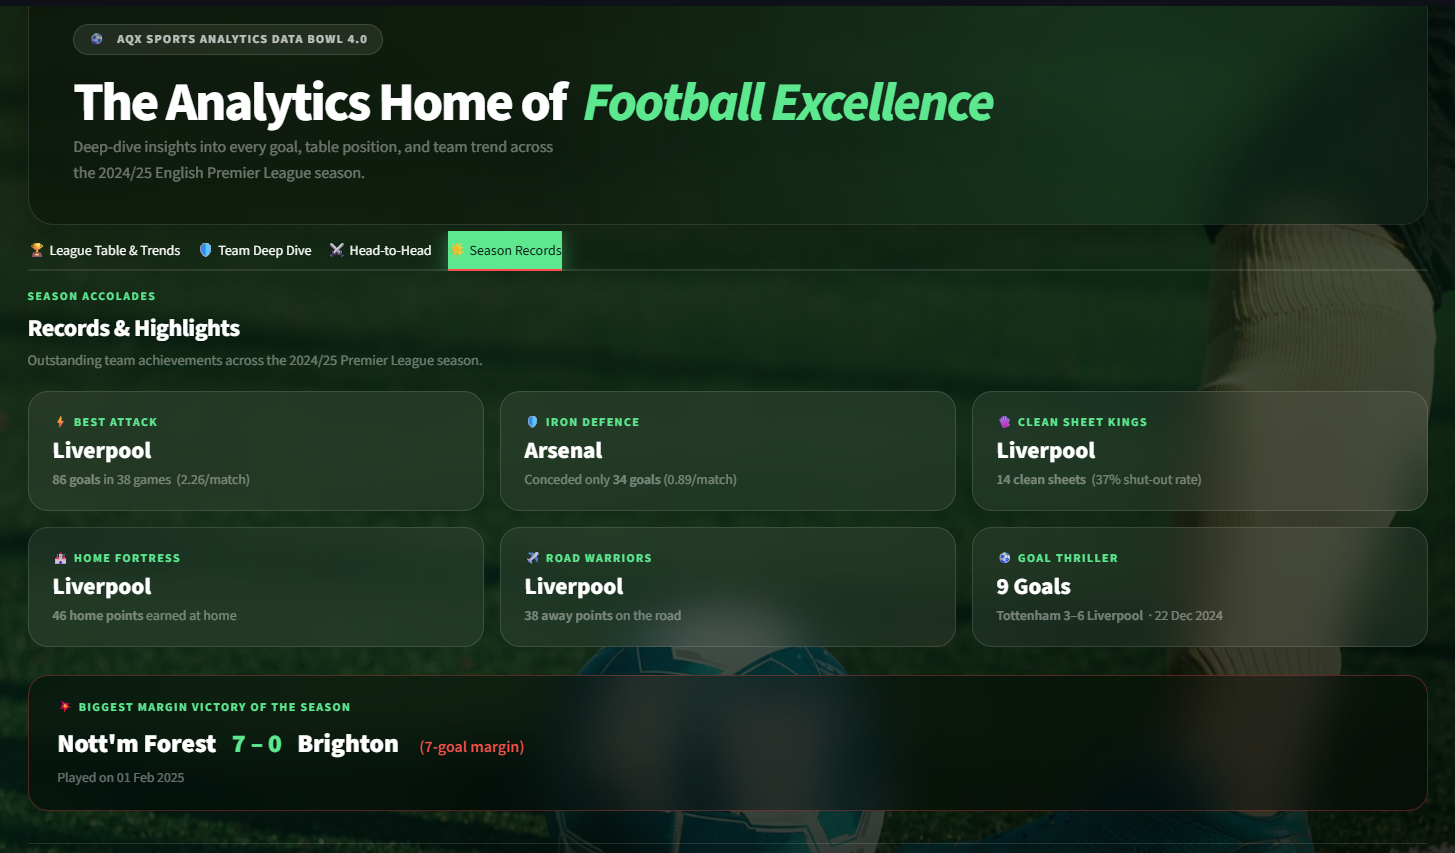
Inspiration
Footylytics-Analytics was inspired by our shared interest in football and curiosity about how data can reveal insights beyond match results. Football generates a large amount of statistical data, but understanding team performance requires more than simply looking at league standings.
As a team, we wanted to build a project that transforms raw football match data into meaningful insights, allowing users to explore team performance, compare clubs, and discover patterns throughout the English Premier League 2024/2025 season.
What it does
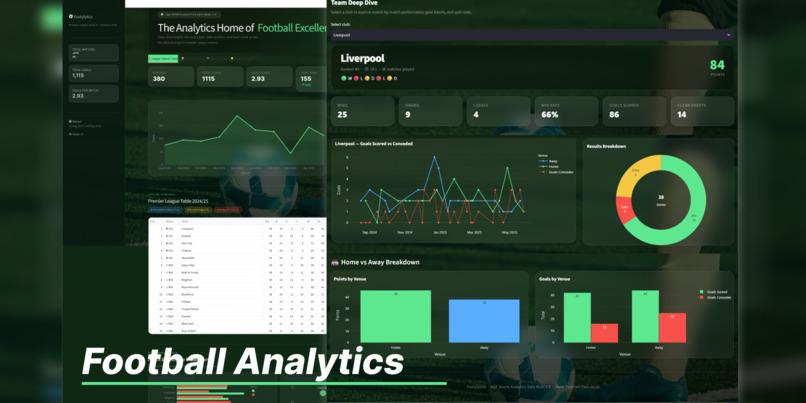
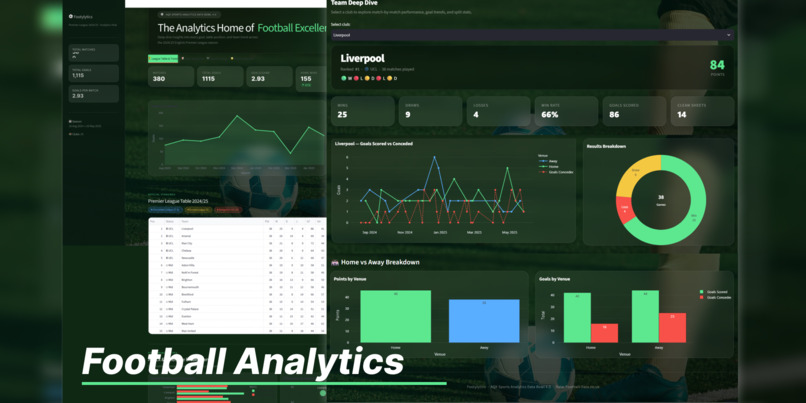
Footylytics-Analytics is a football data analytics dashboard focused on the English Premier League 2024/2025 season.
The application provides:
- League Standings: Displays team rankings, points, wins, draws, losses, and goal differences.
- Goals Analysis: Visualizes goals scored and conceded by each team.
- Team Performance: Explores team statistics and performance throughout the season.
- Home vs. Away Analysis: Compares team performance in home and away matches.
- Team Comparison: Provides statistical comparisons between selected clubs.
- Performance Insights: Helps users identify interesting patterns and trends from football statistics.
How we built it
We developed Footylytics-Analytics using Python and several data analytics libraries.
- Python: Main programming language for the project.
- Pandas: Used for data cleaning, processing, and statistical calculations.
- Plotly: Used to create interactive charts and data visualizations.
- Streamlit: Used to develop the interactive web-based dashboard.
- Football-Data.co.uk: Data source for Premier League match statistics.
- Git & GitHub: Used for version control and project collaboration.
Our development process involved collecting and processing match data, calculating relevant performance metrics, and transforming the results into interactive visualizations through the dashboard. We collaborated throughout the development process to combine our ideas and technical contributions into one application.
Challenges we ran into
One of the main challenges we encountered was processing raw football match data and transforming it into meaningful statistics. Ensuring that calculations such as league points, goal differences, and team performance were accurate required careful data processing.
Another challenge was designing visualizations that could communicate statistical information clearly without overwhelming users with too much data.
We also had to coordinate our work, organize the project structure, and integrate different contributions into a single application while maintaining consistency across the codebase.
Accomplishments that we're proud of
We are proud to have successfully developed an interactive football analytics dashboard that brings together different aspects of Premier League statistics in one place.
Some of our key accomplishments include:
- Successfully processing a full season of Premier League match data.
- Building interactive visualizations to explore team performance.
- Creating statistical comparisons between football clubs.
- Integrating data processing and visualization into a functional web application.

Log in or sign up for Devpost to join the conversation.