-
-
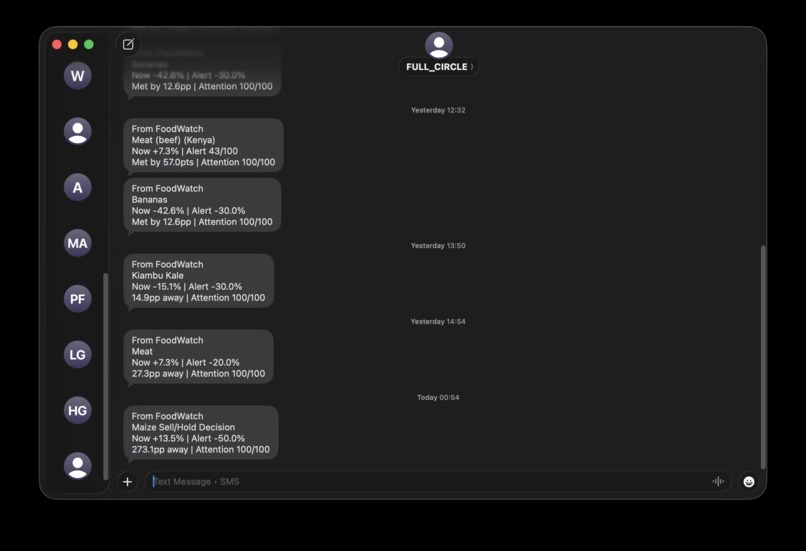
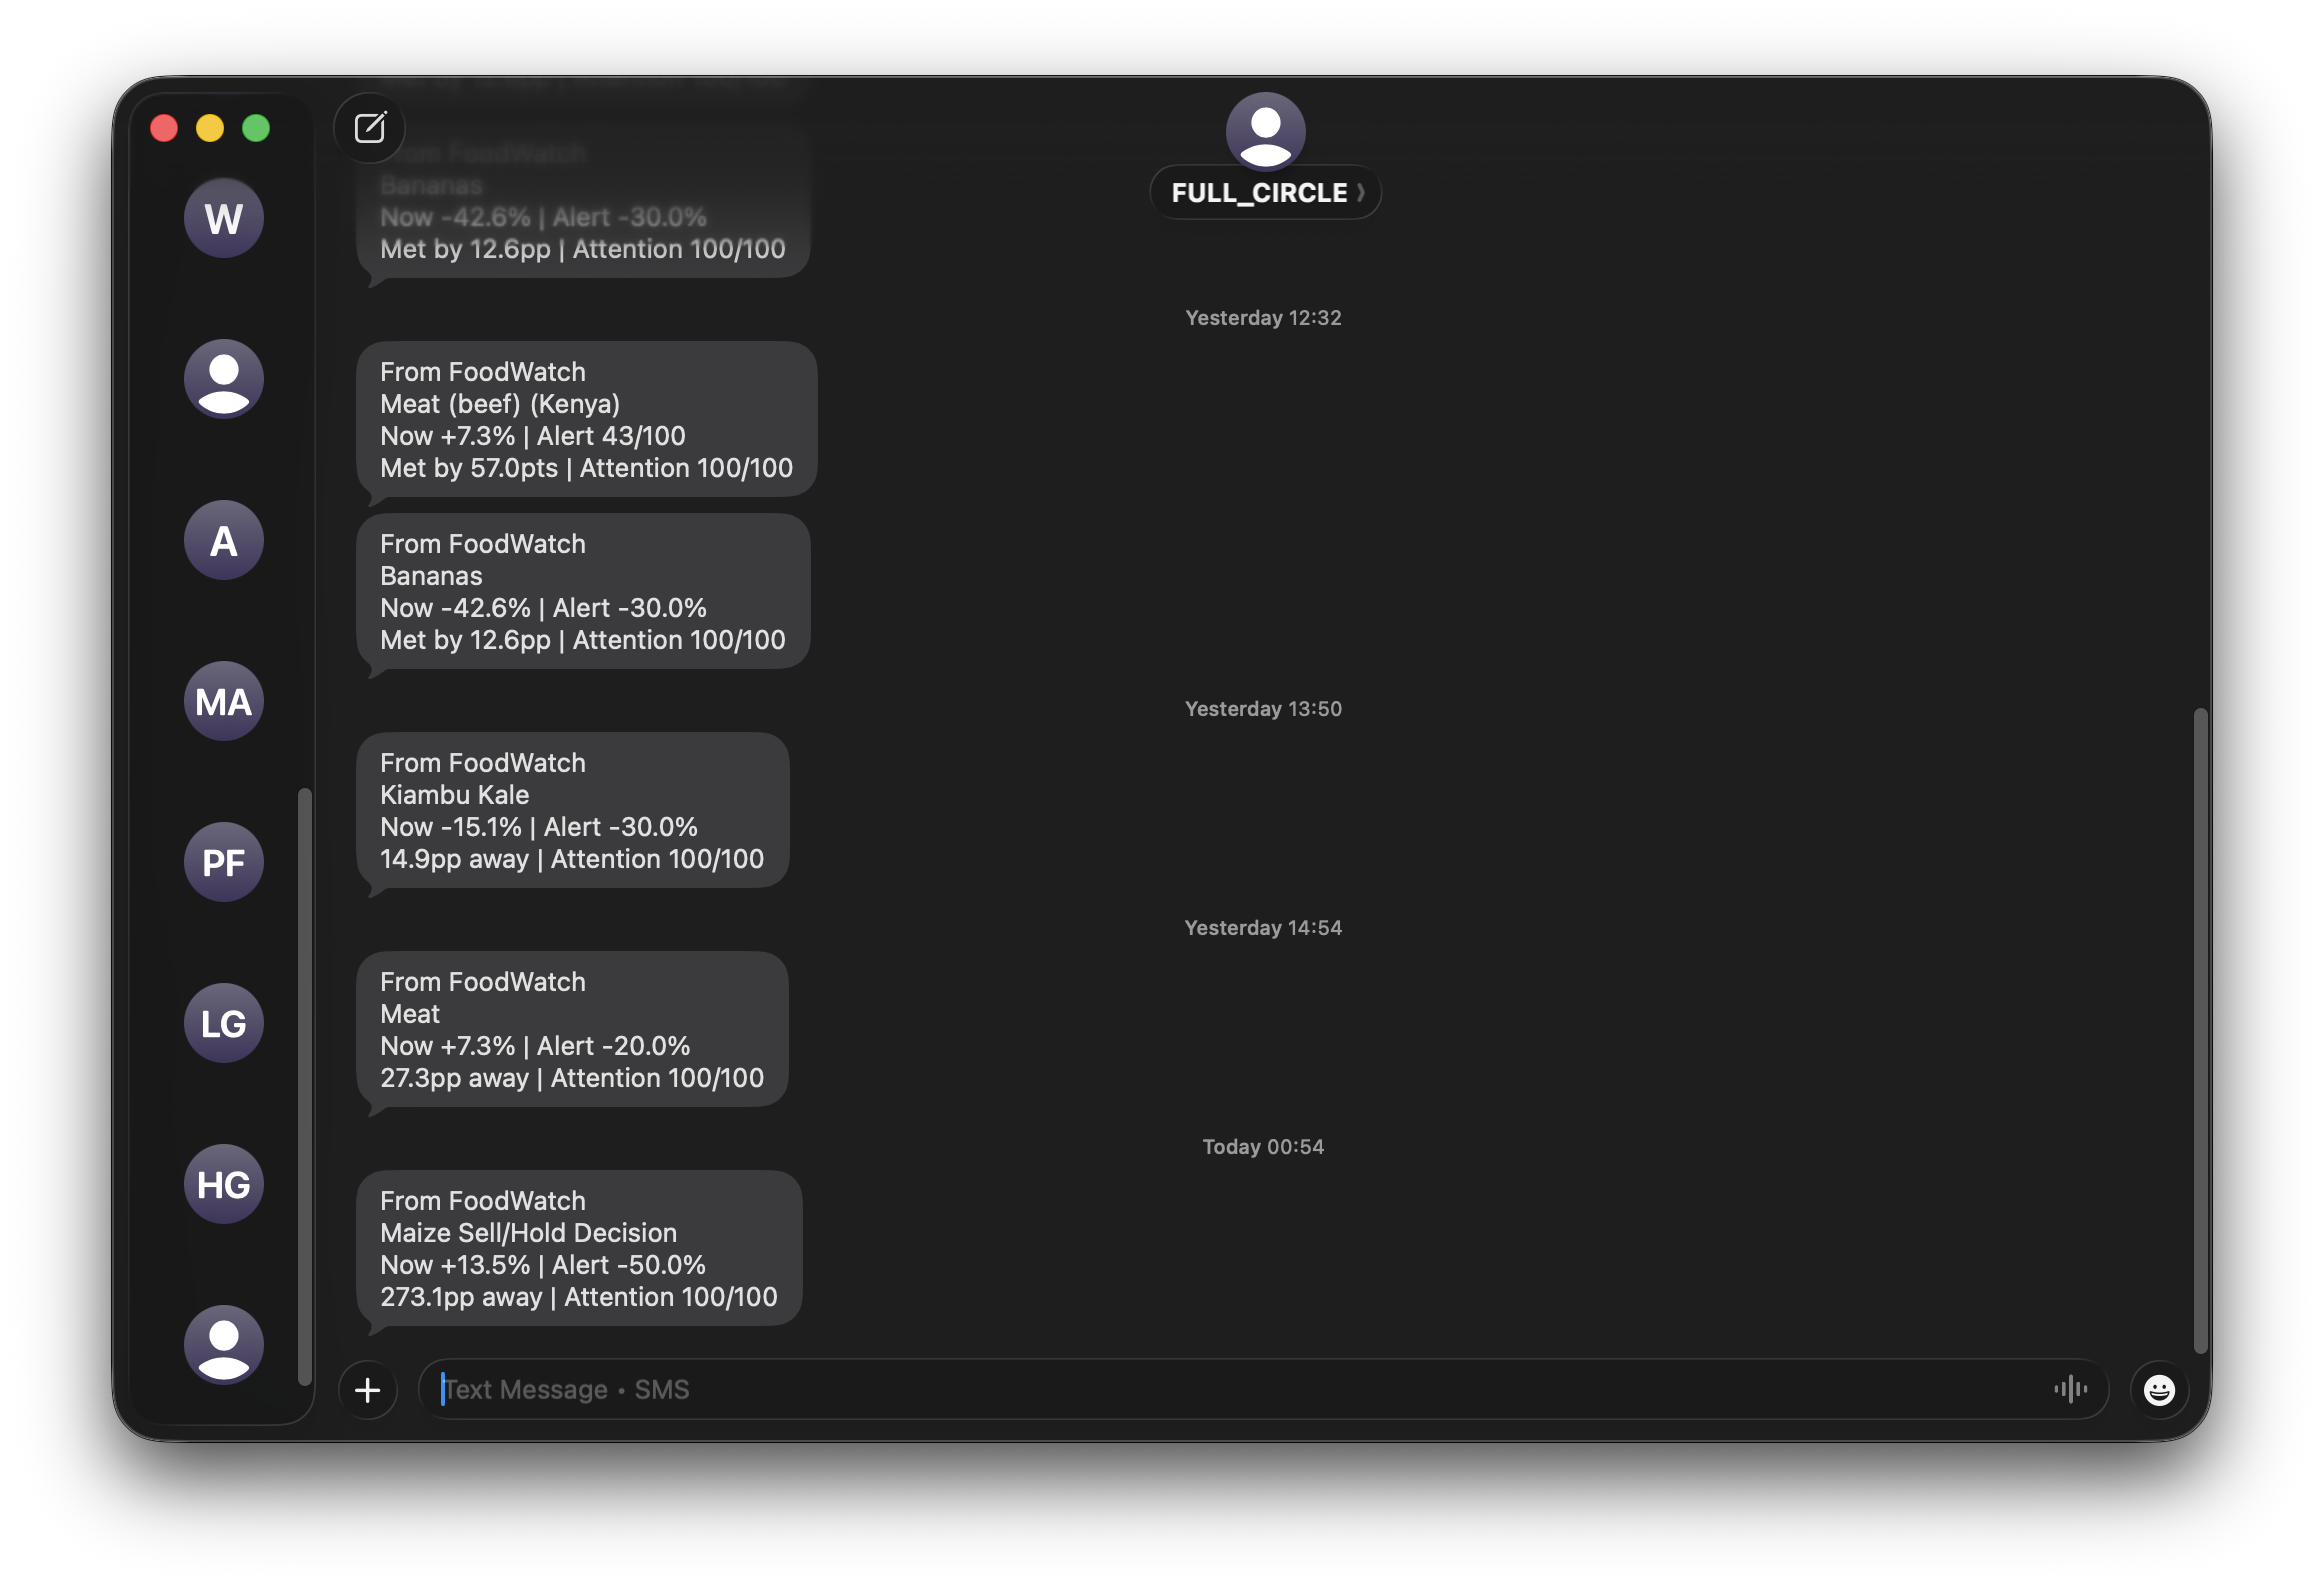
customisable sms alers
-
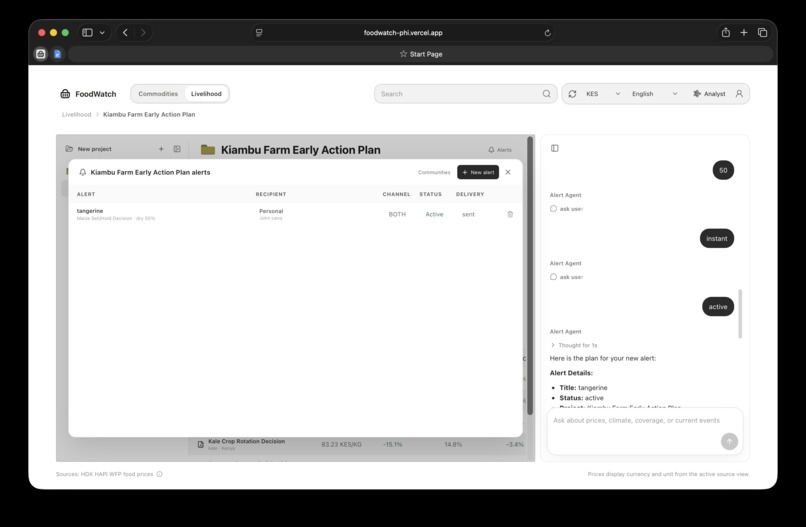
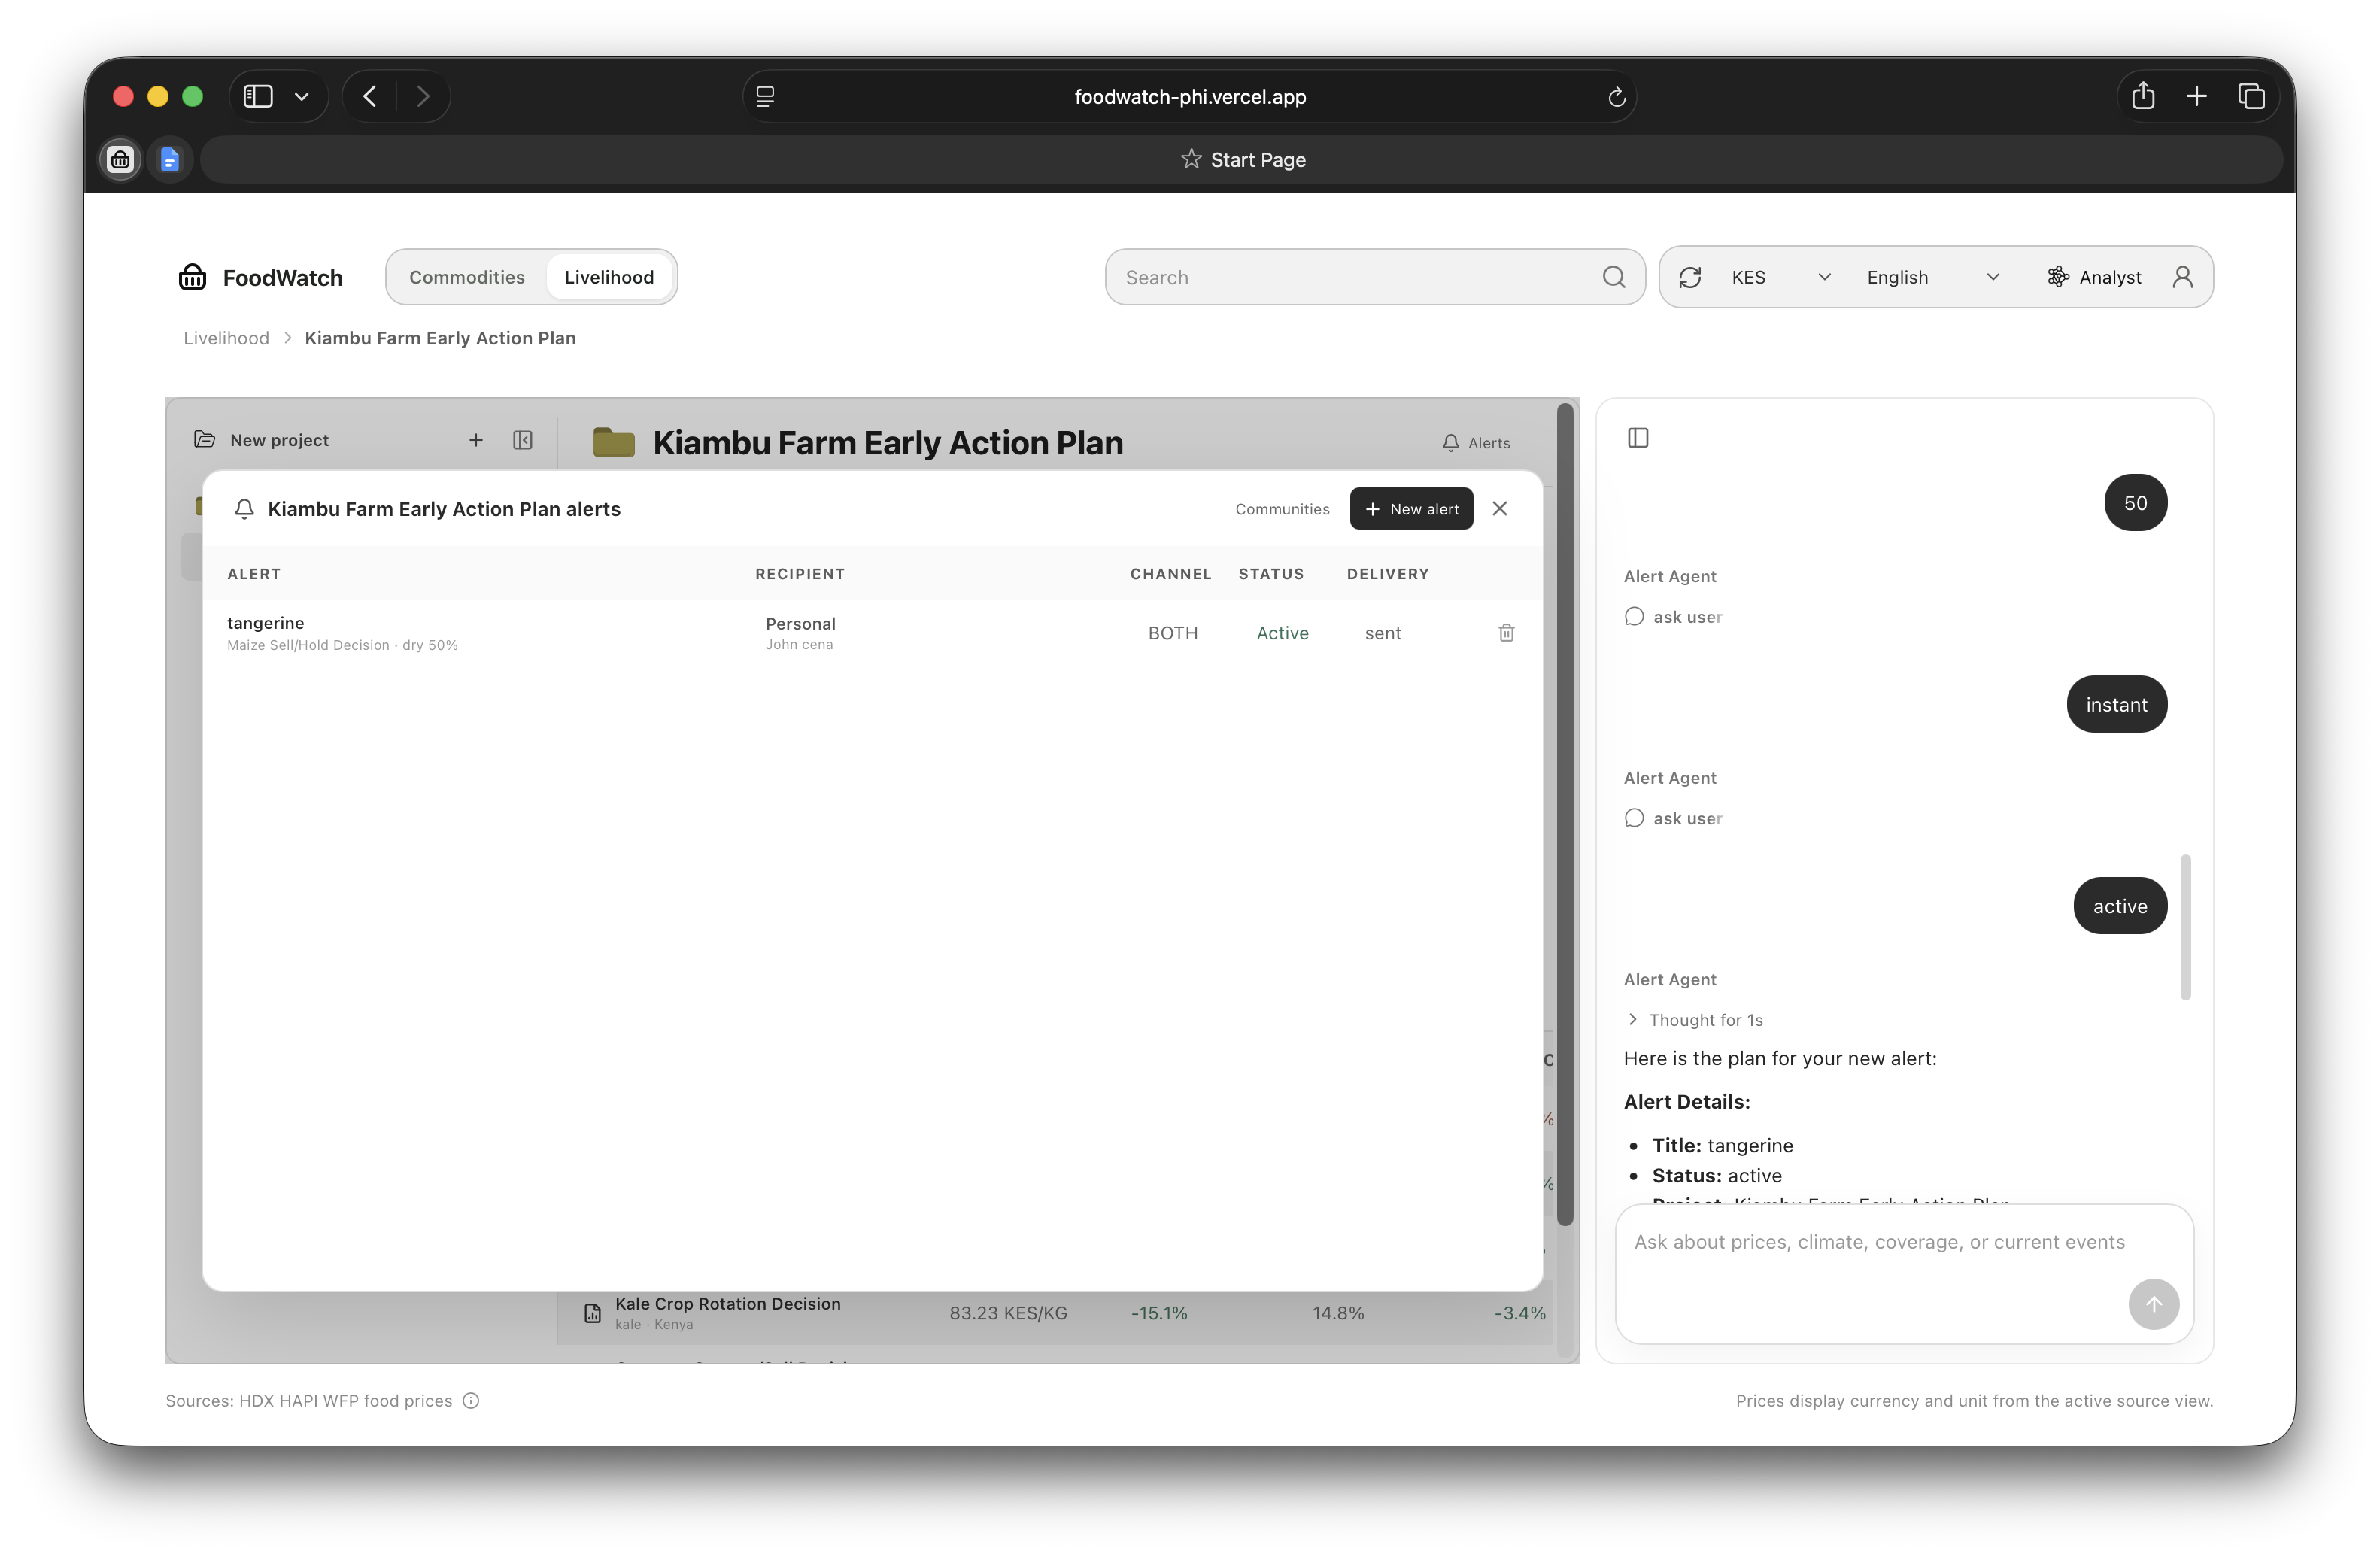
alerts setup
-
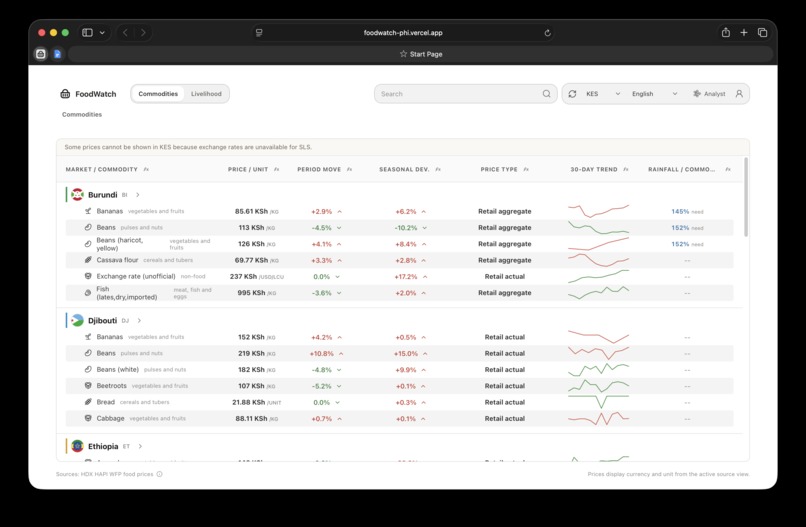
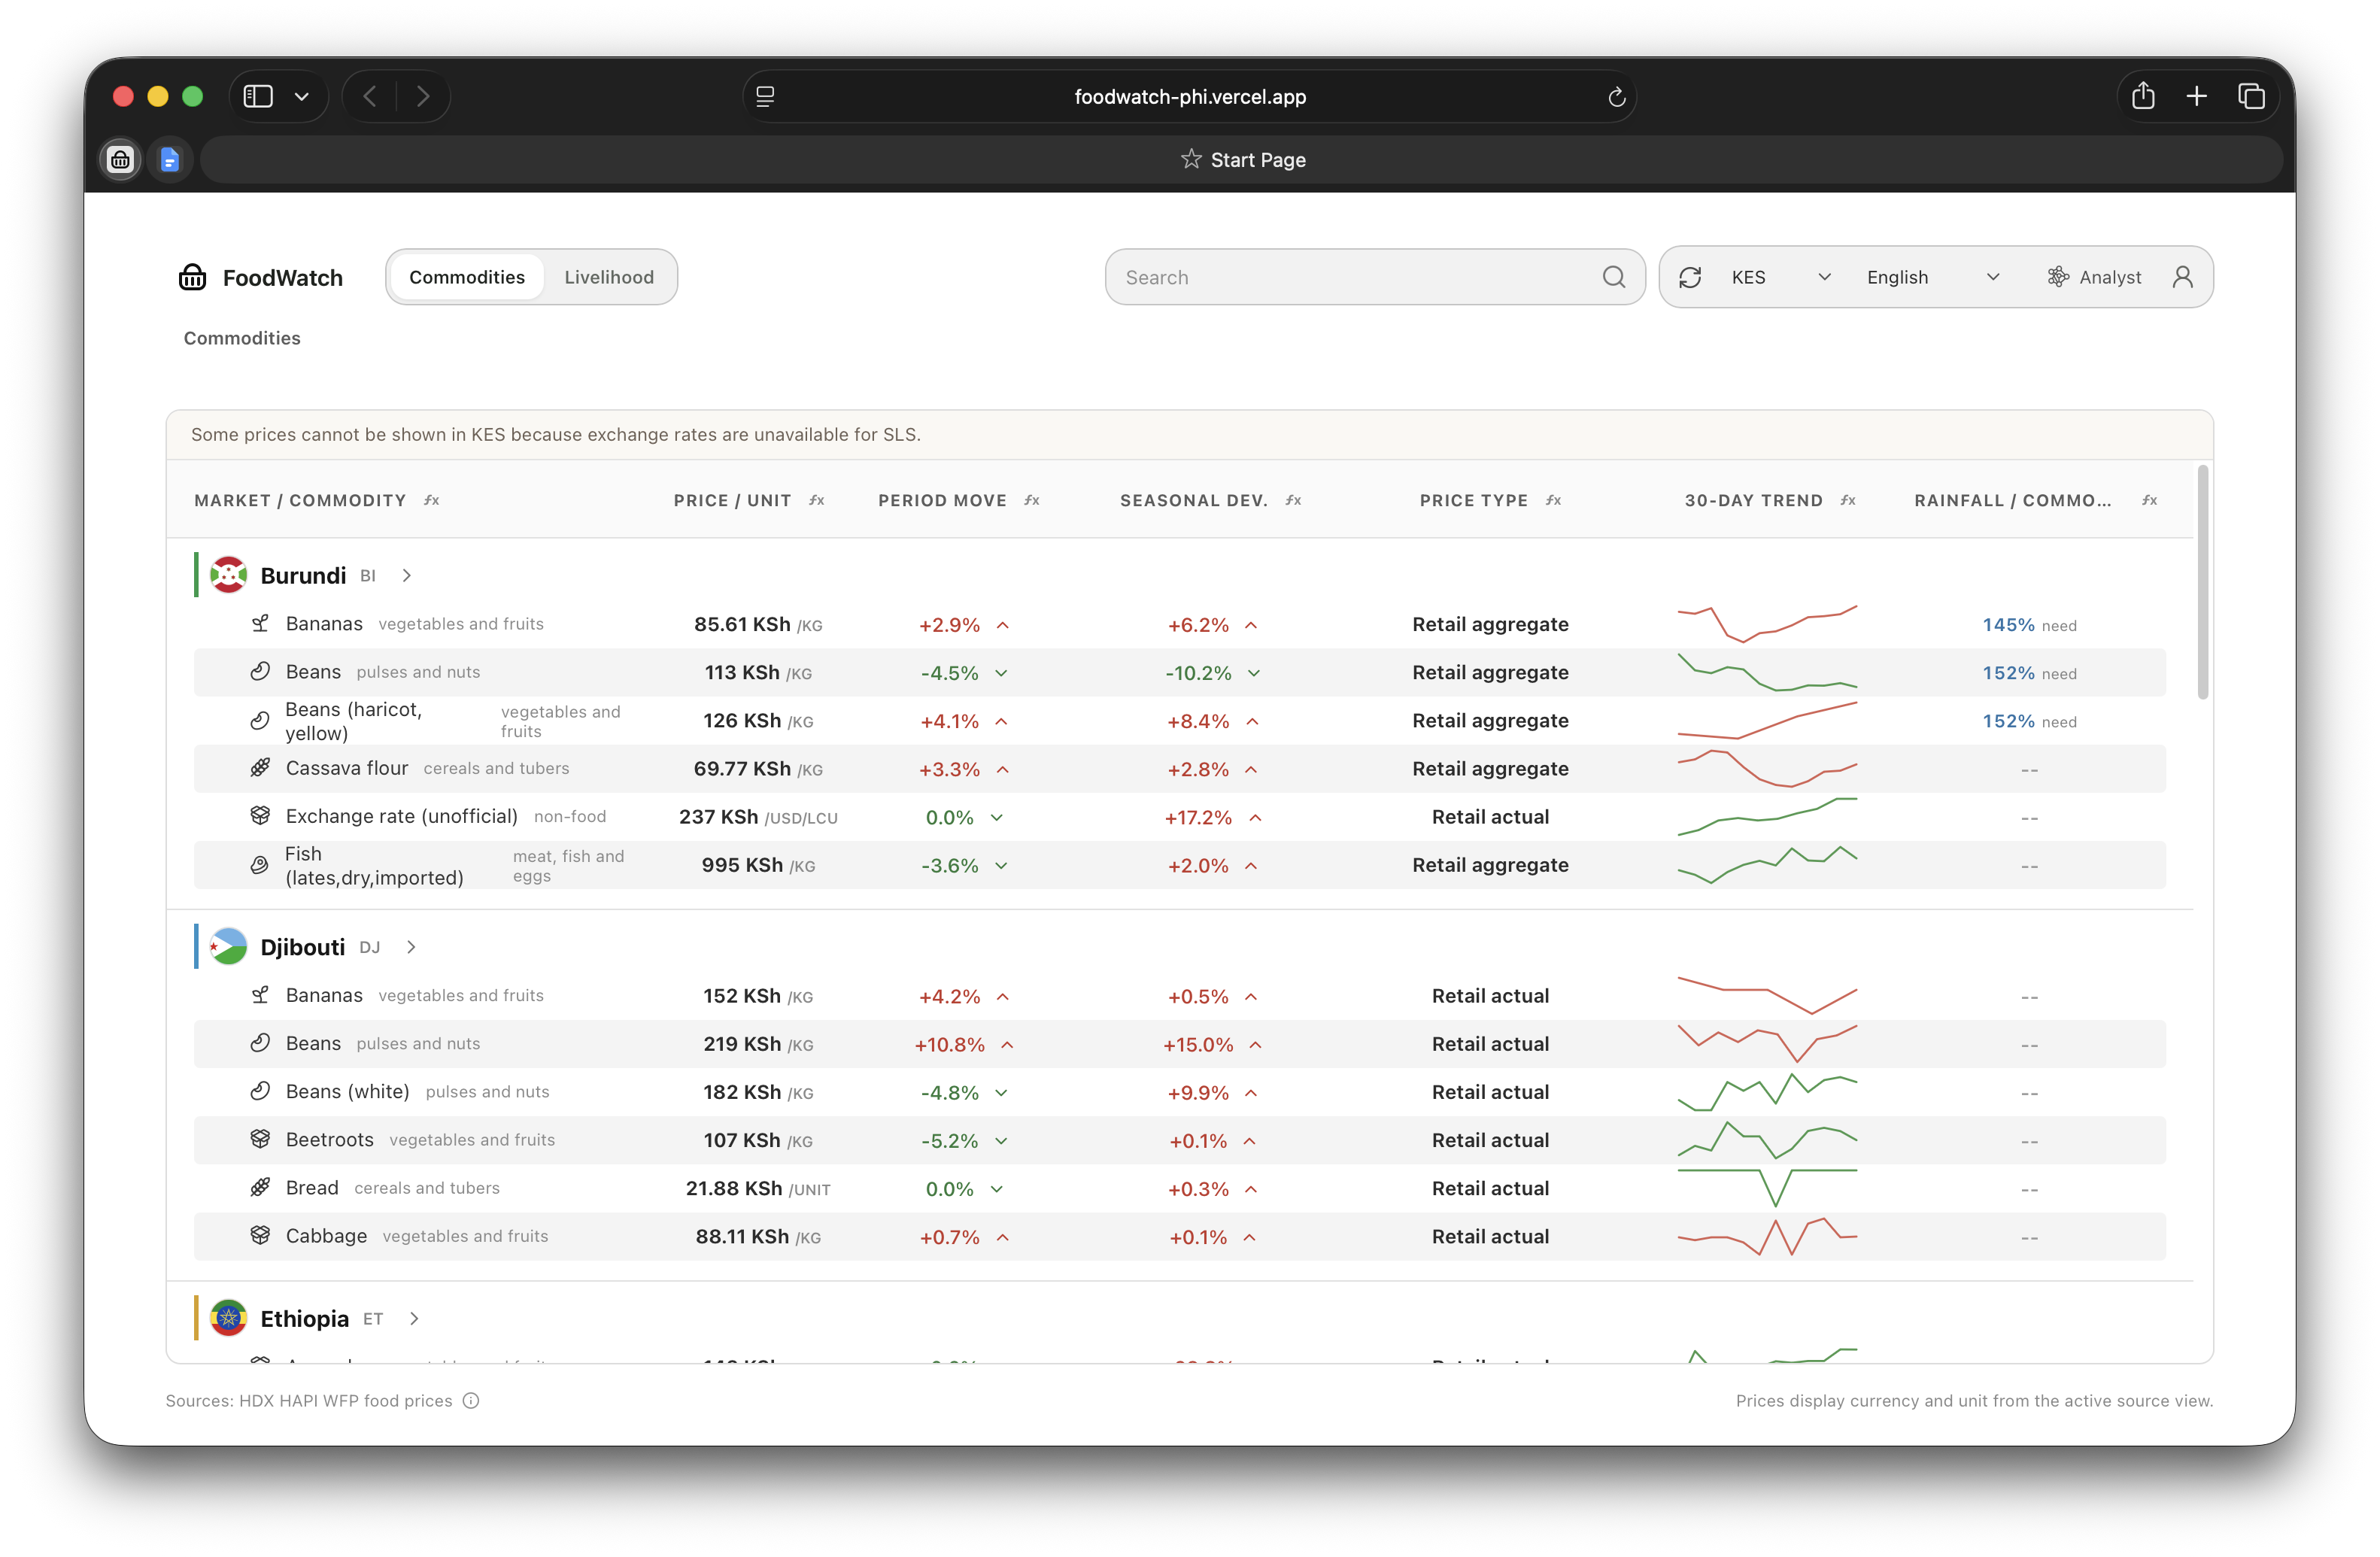
dashboard
-
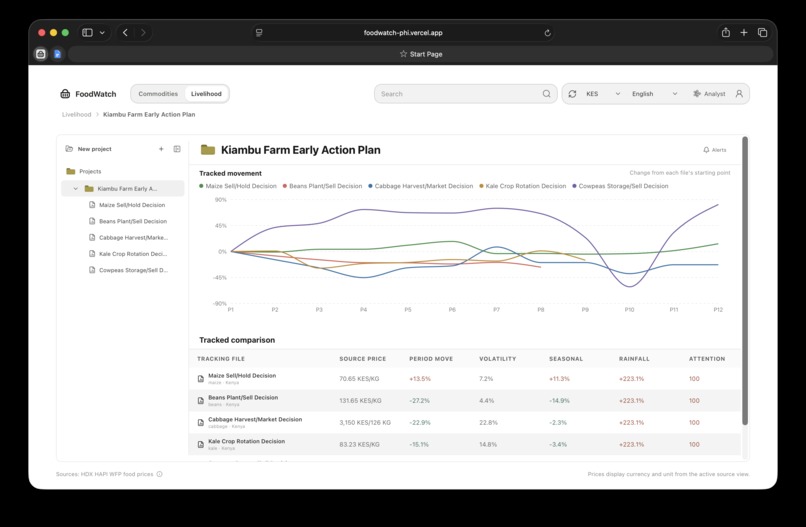
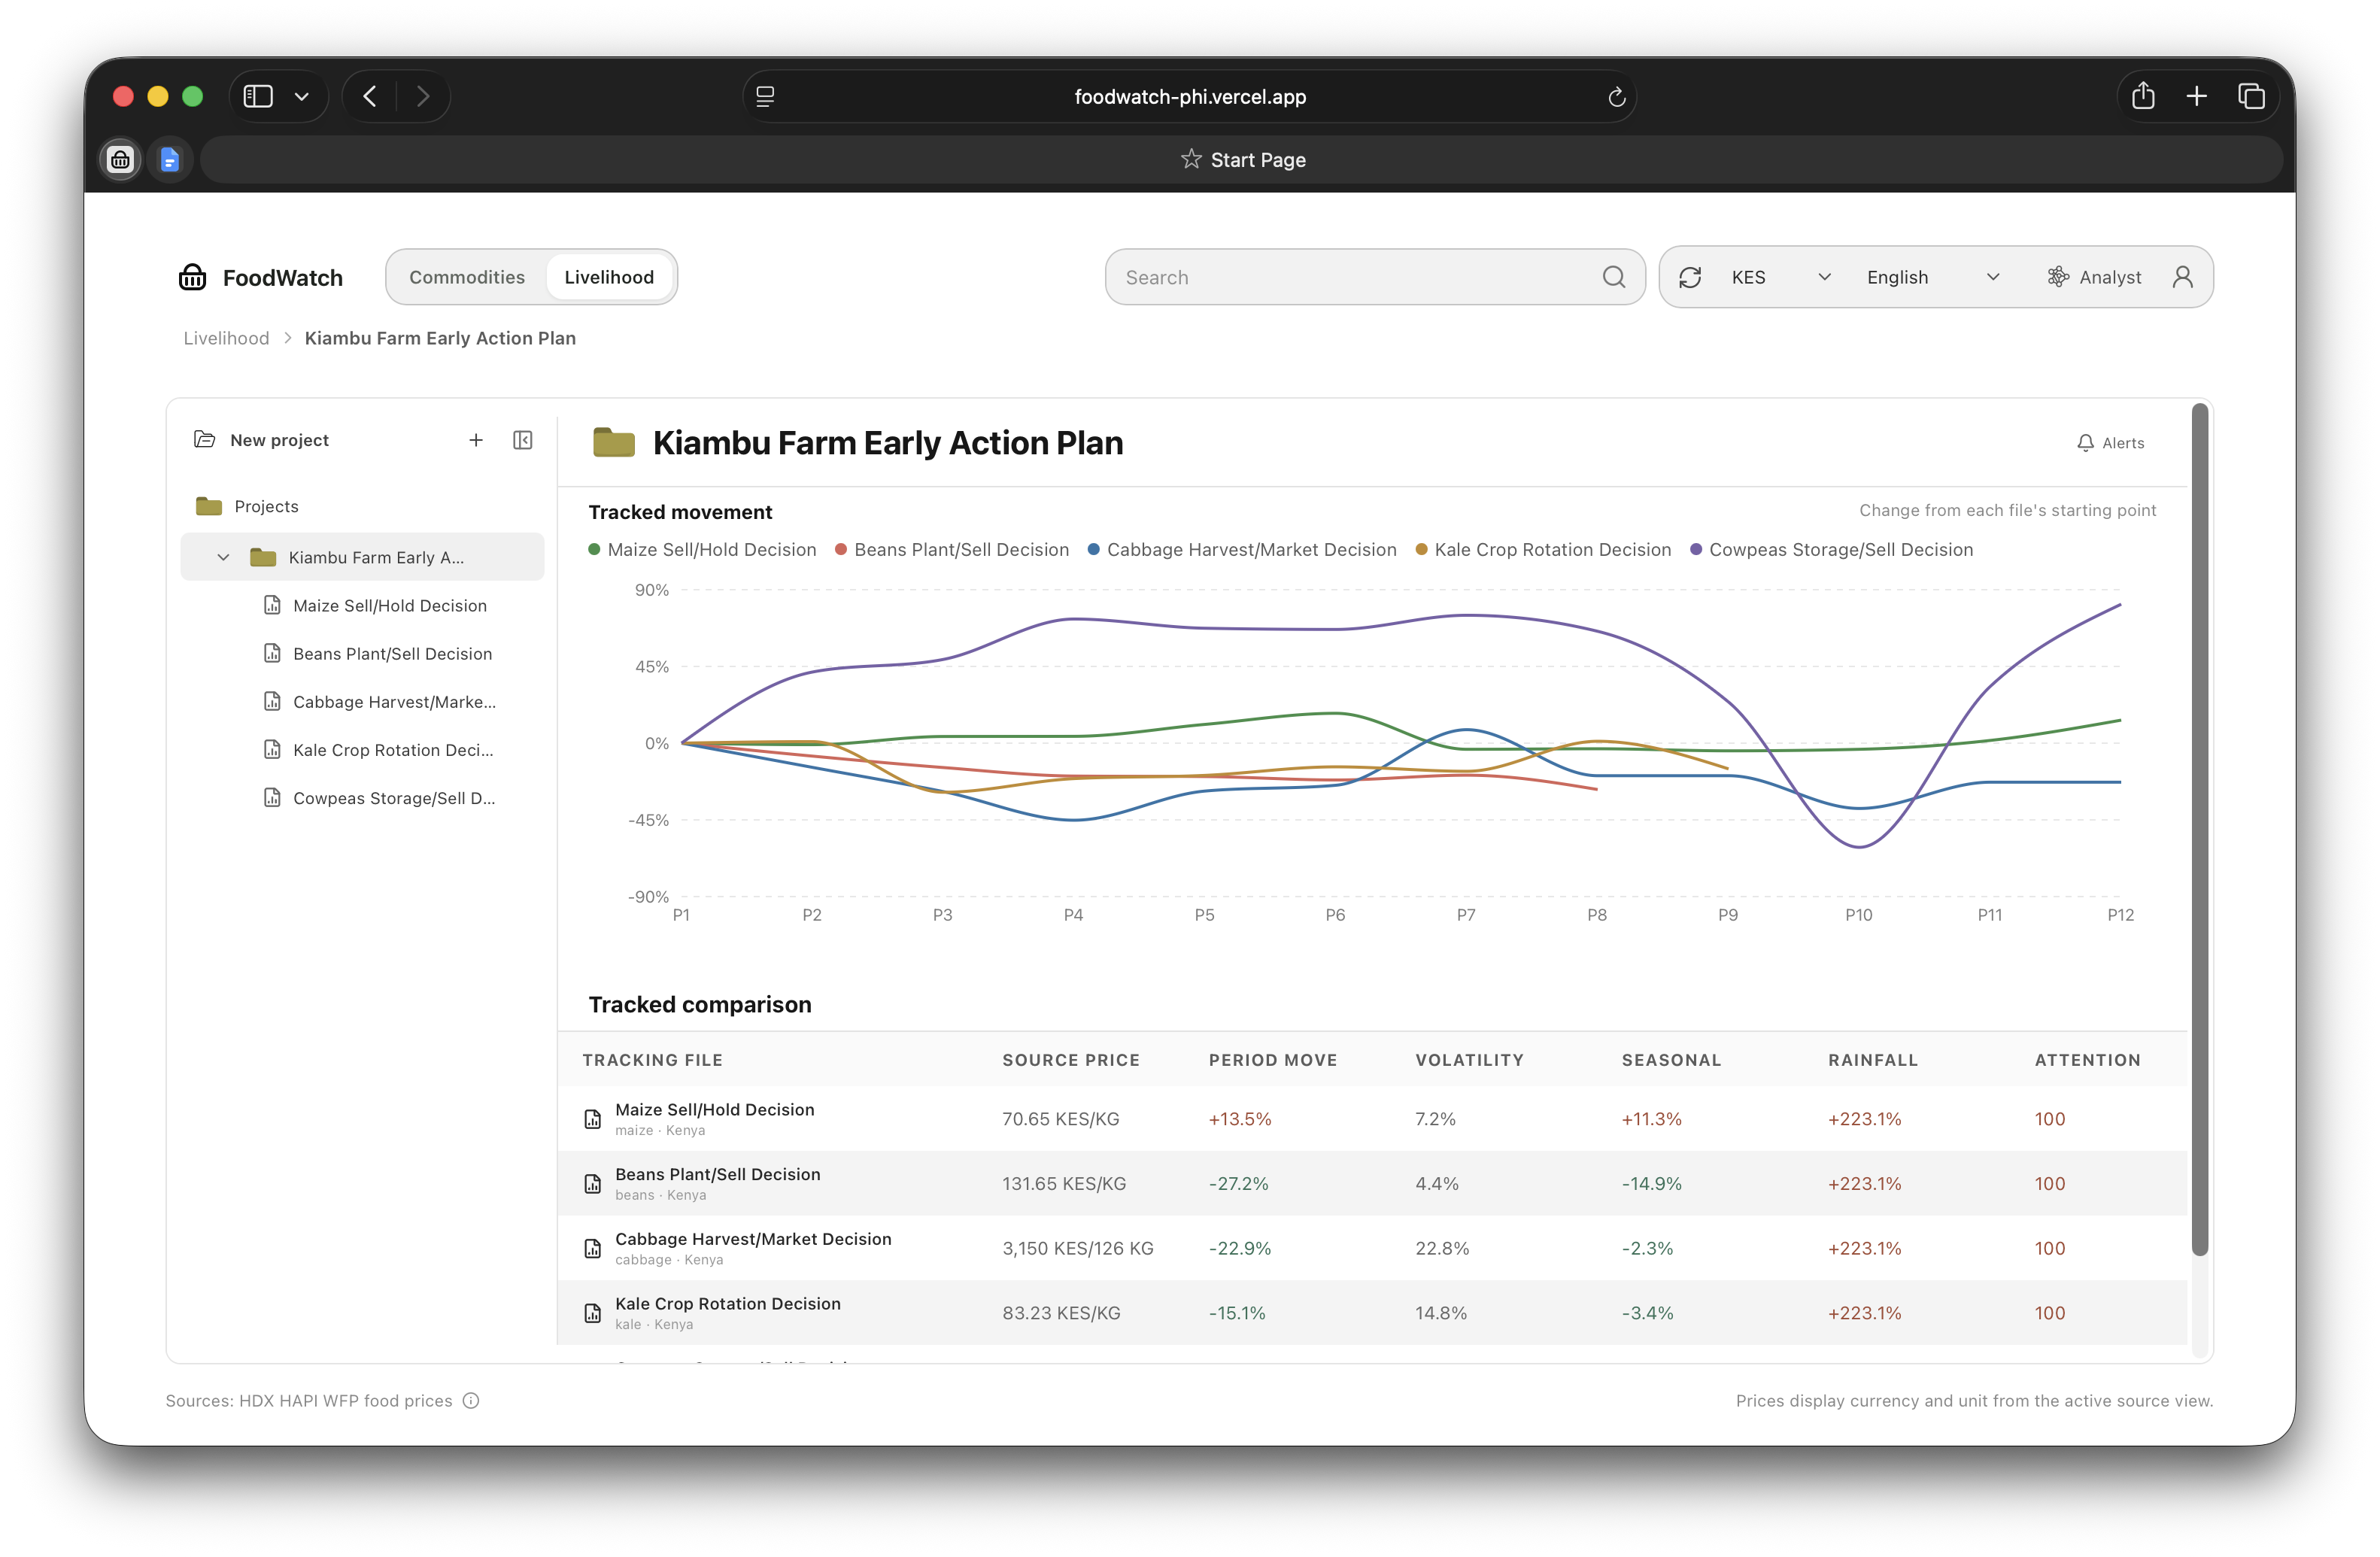
customisable livelyhood traking
-
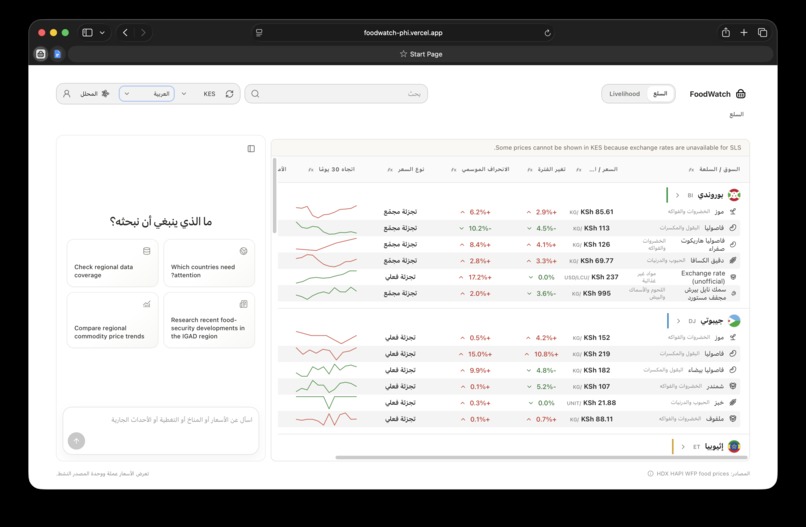
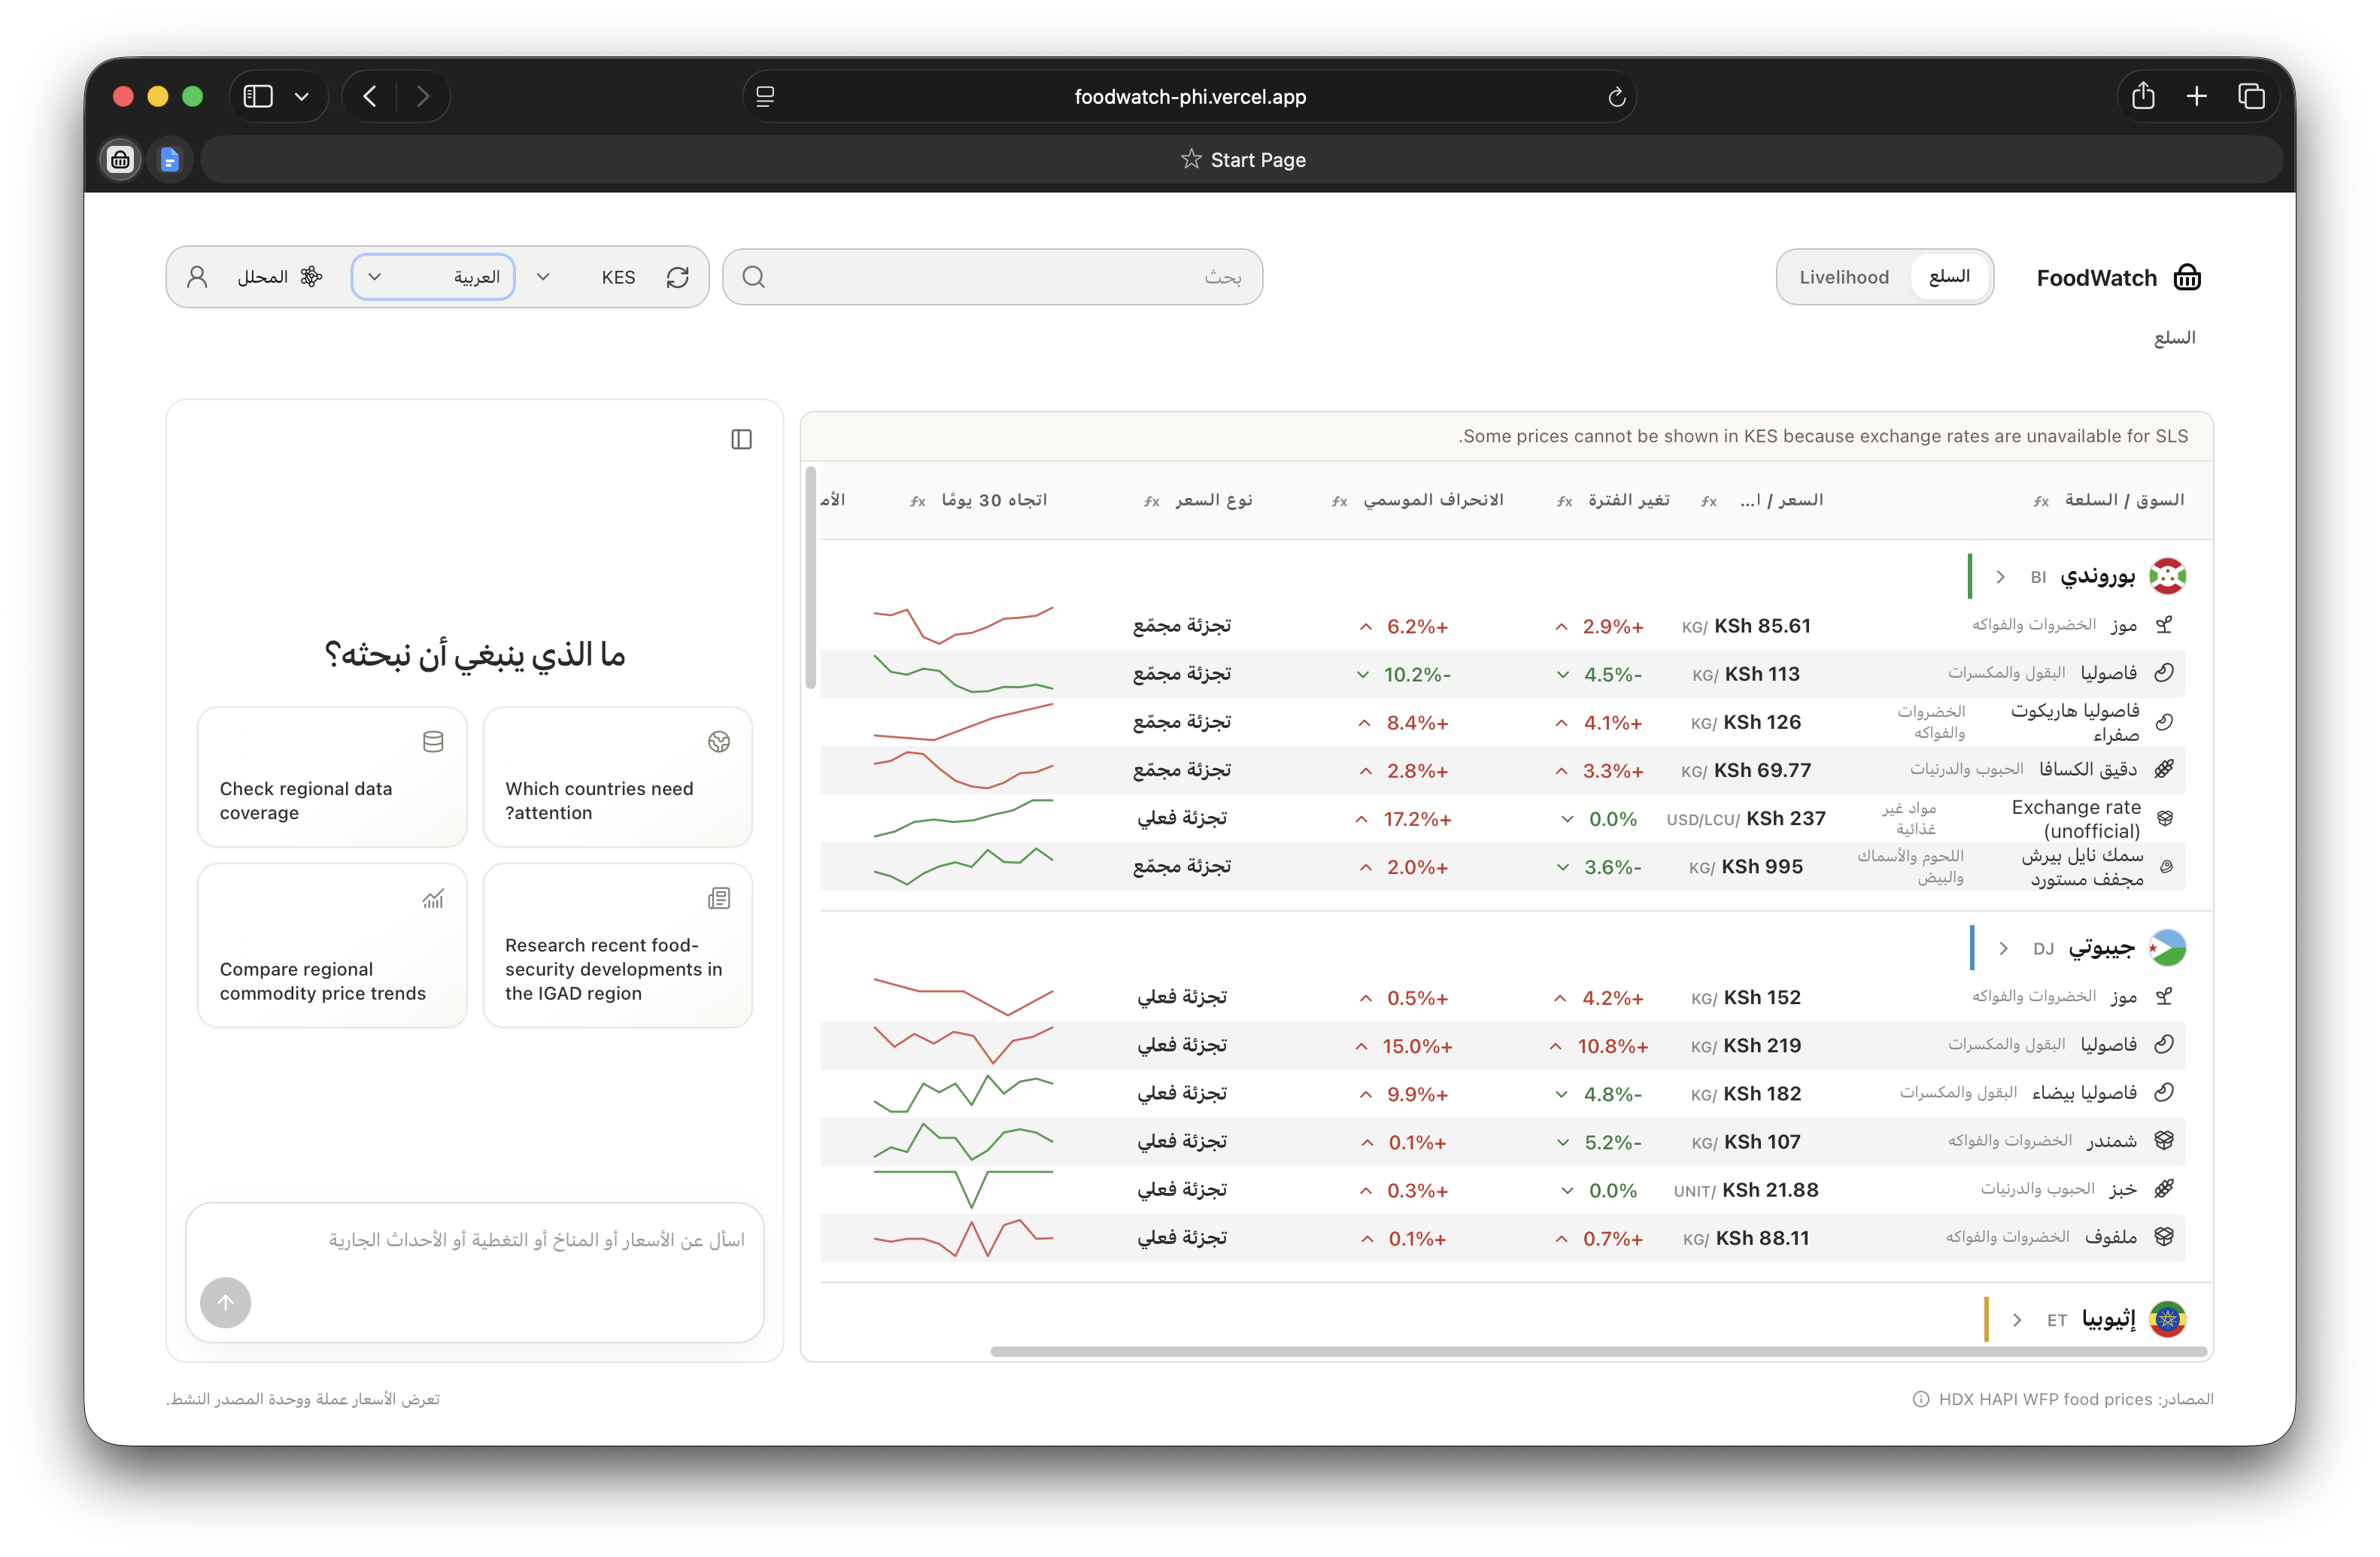
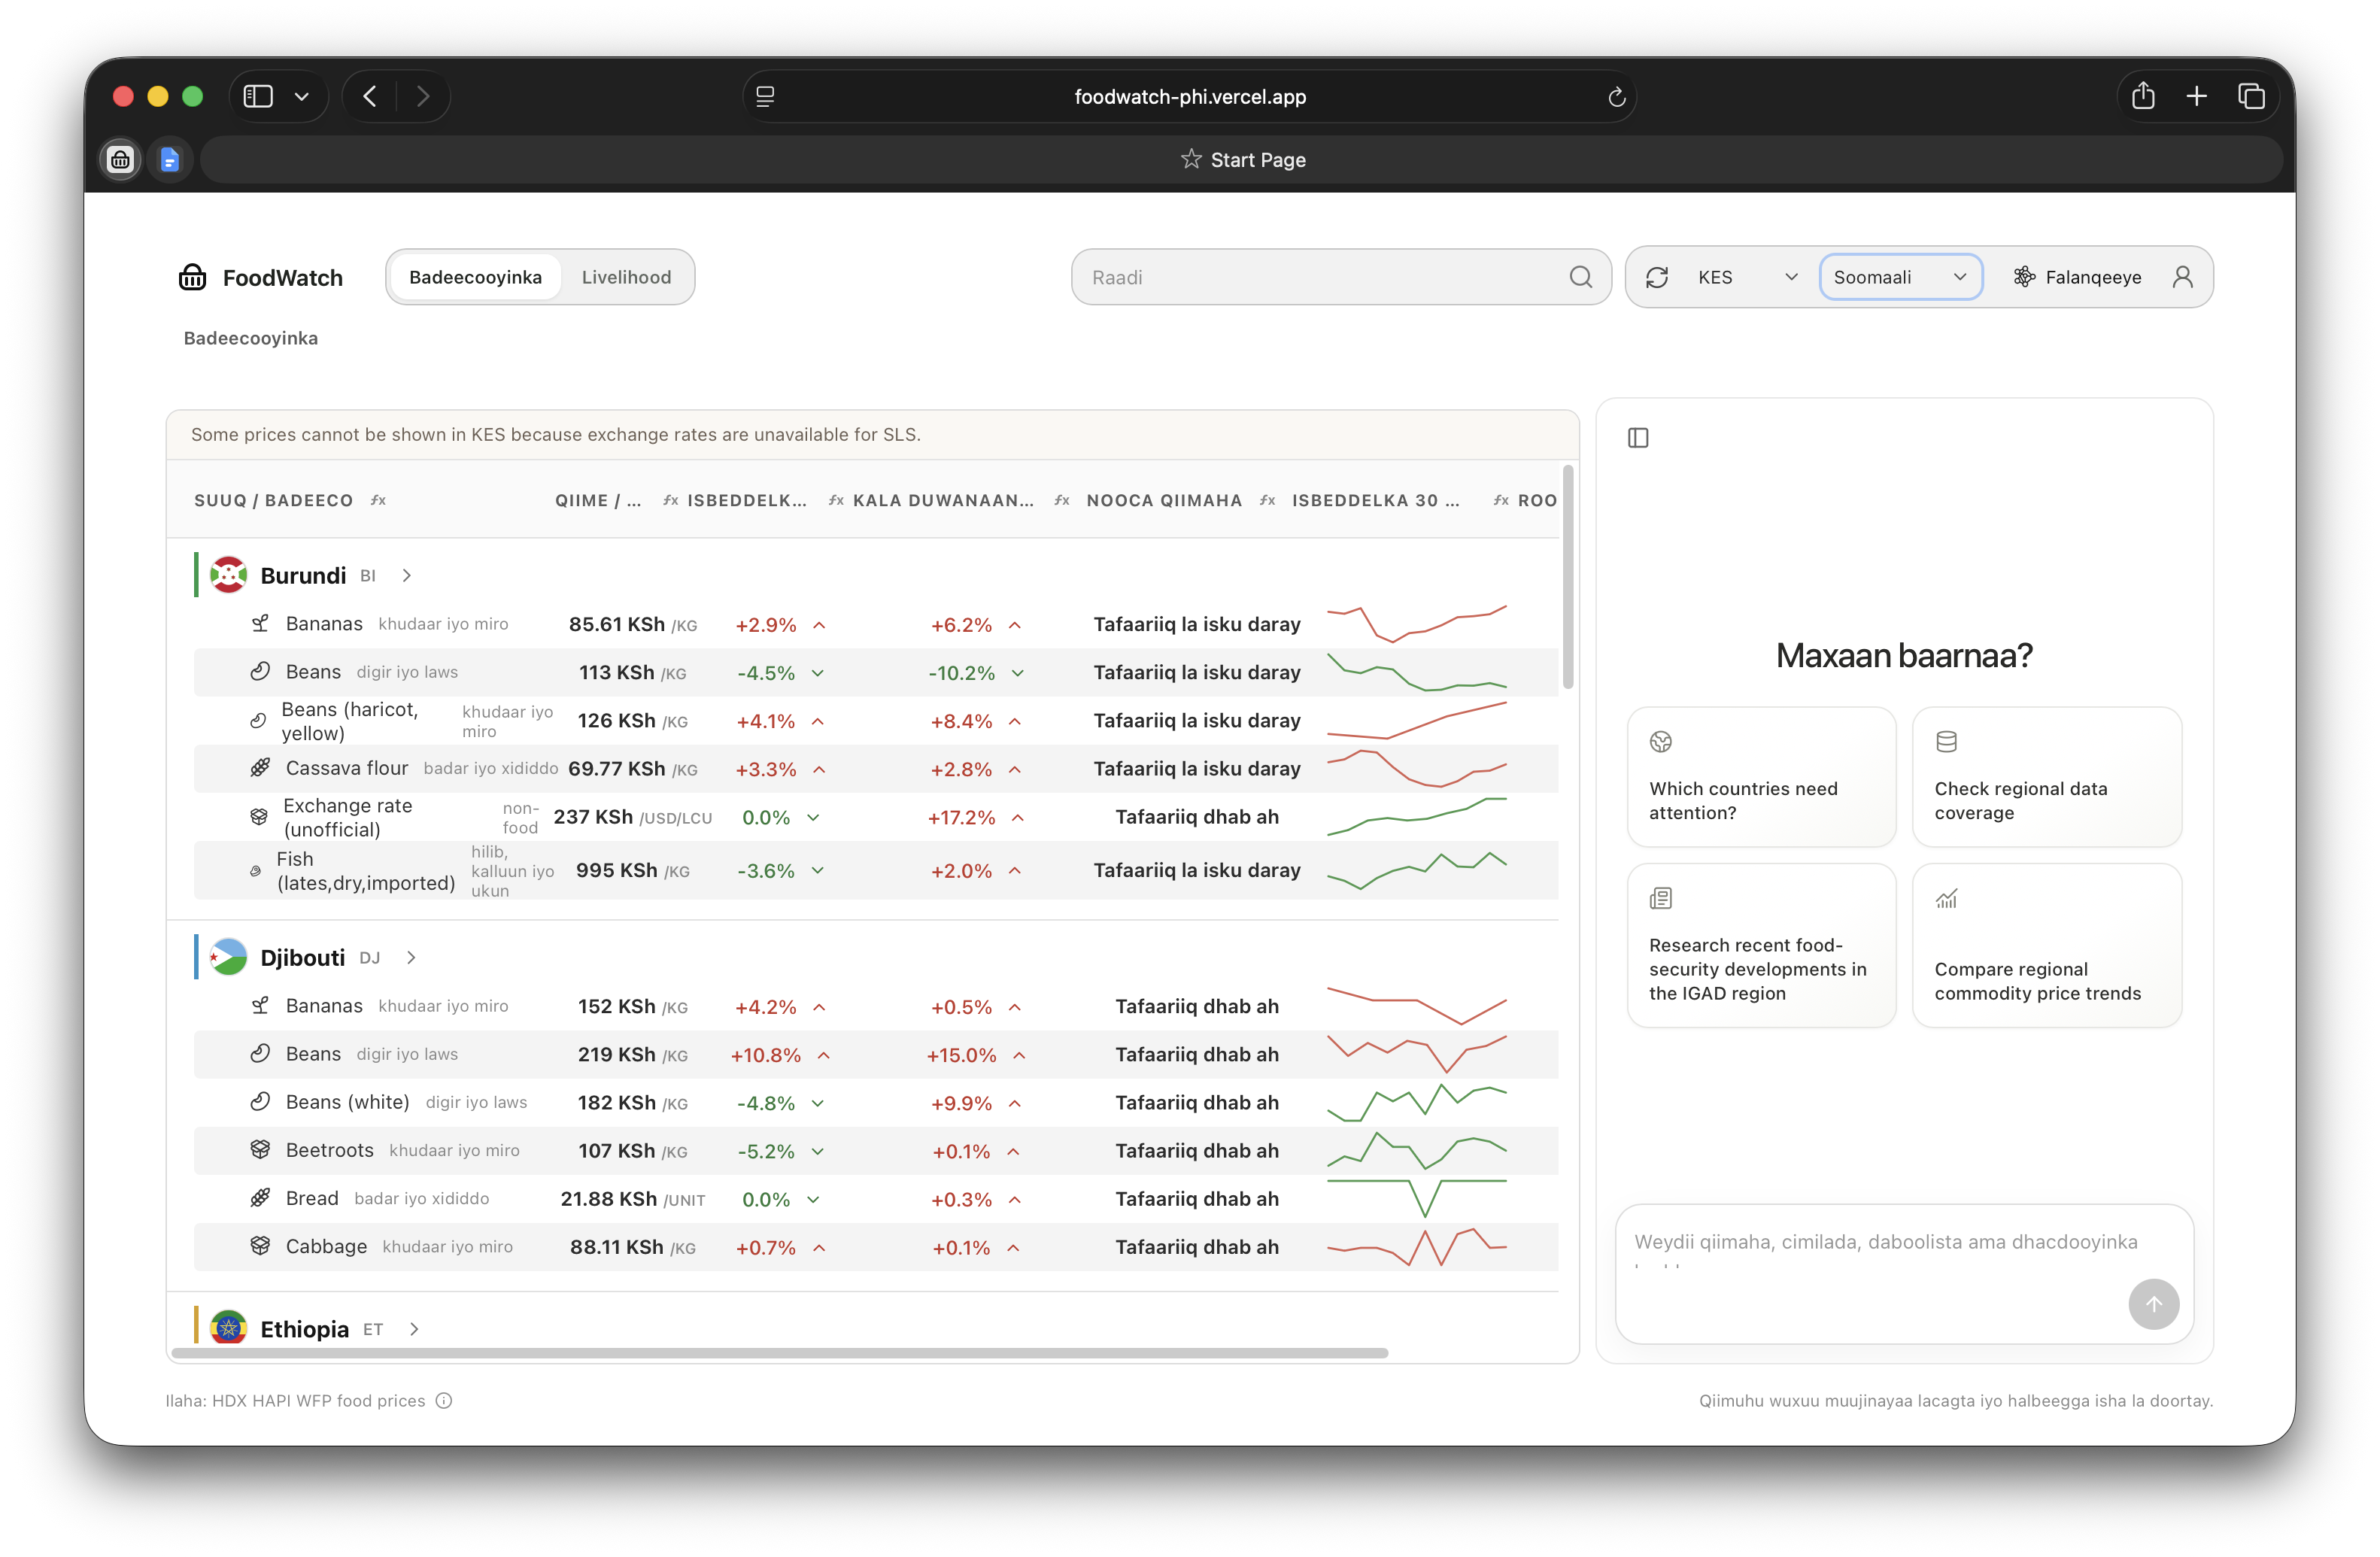
multilingual user experience
-
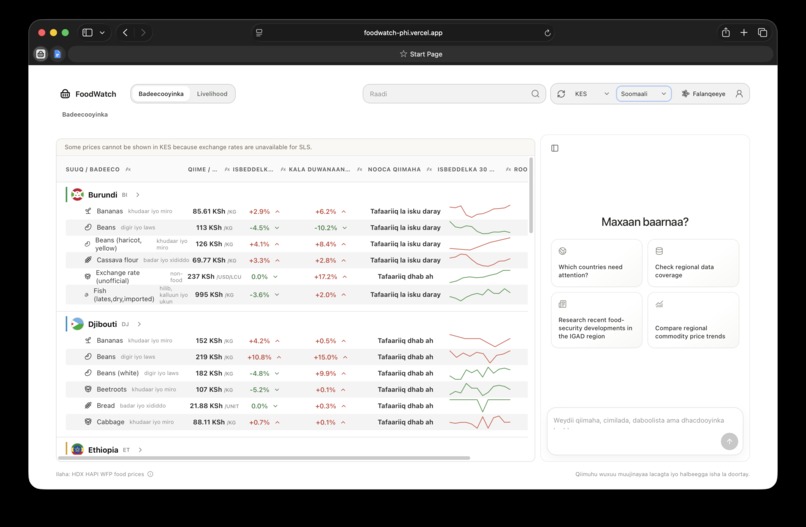
ai powered analysis
-
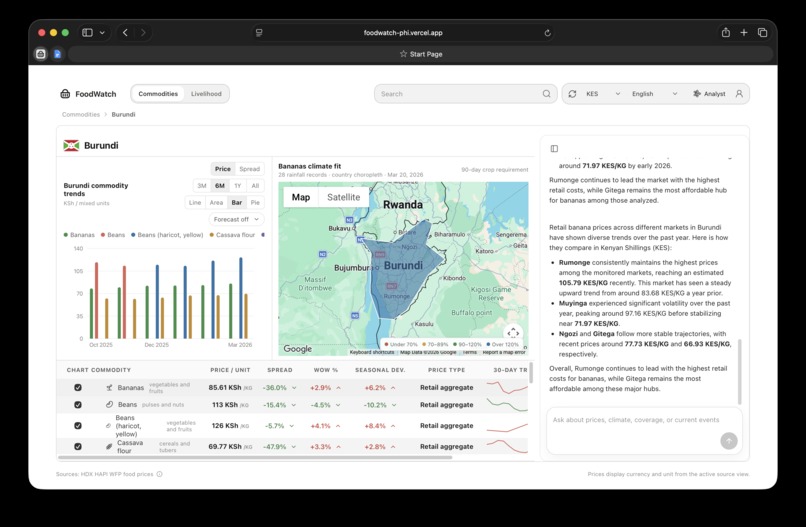
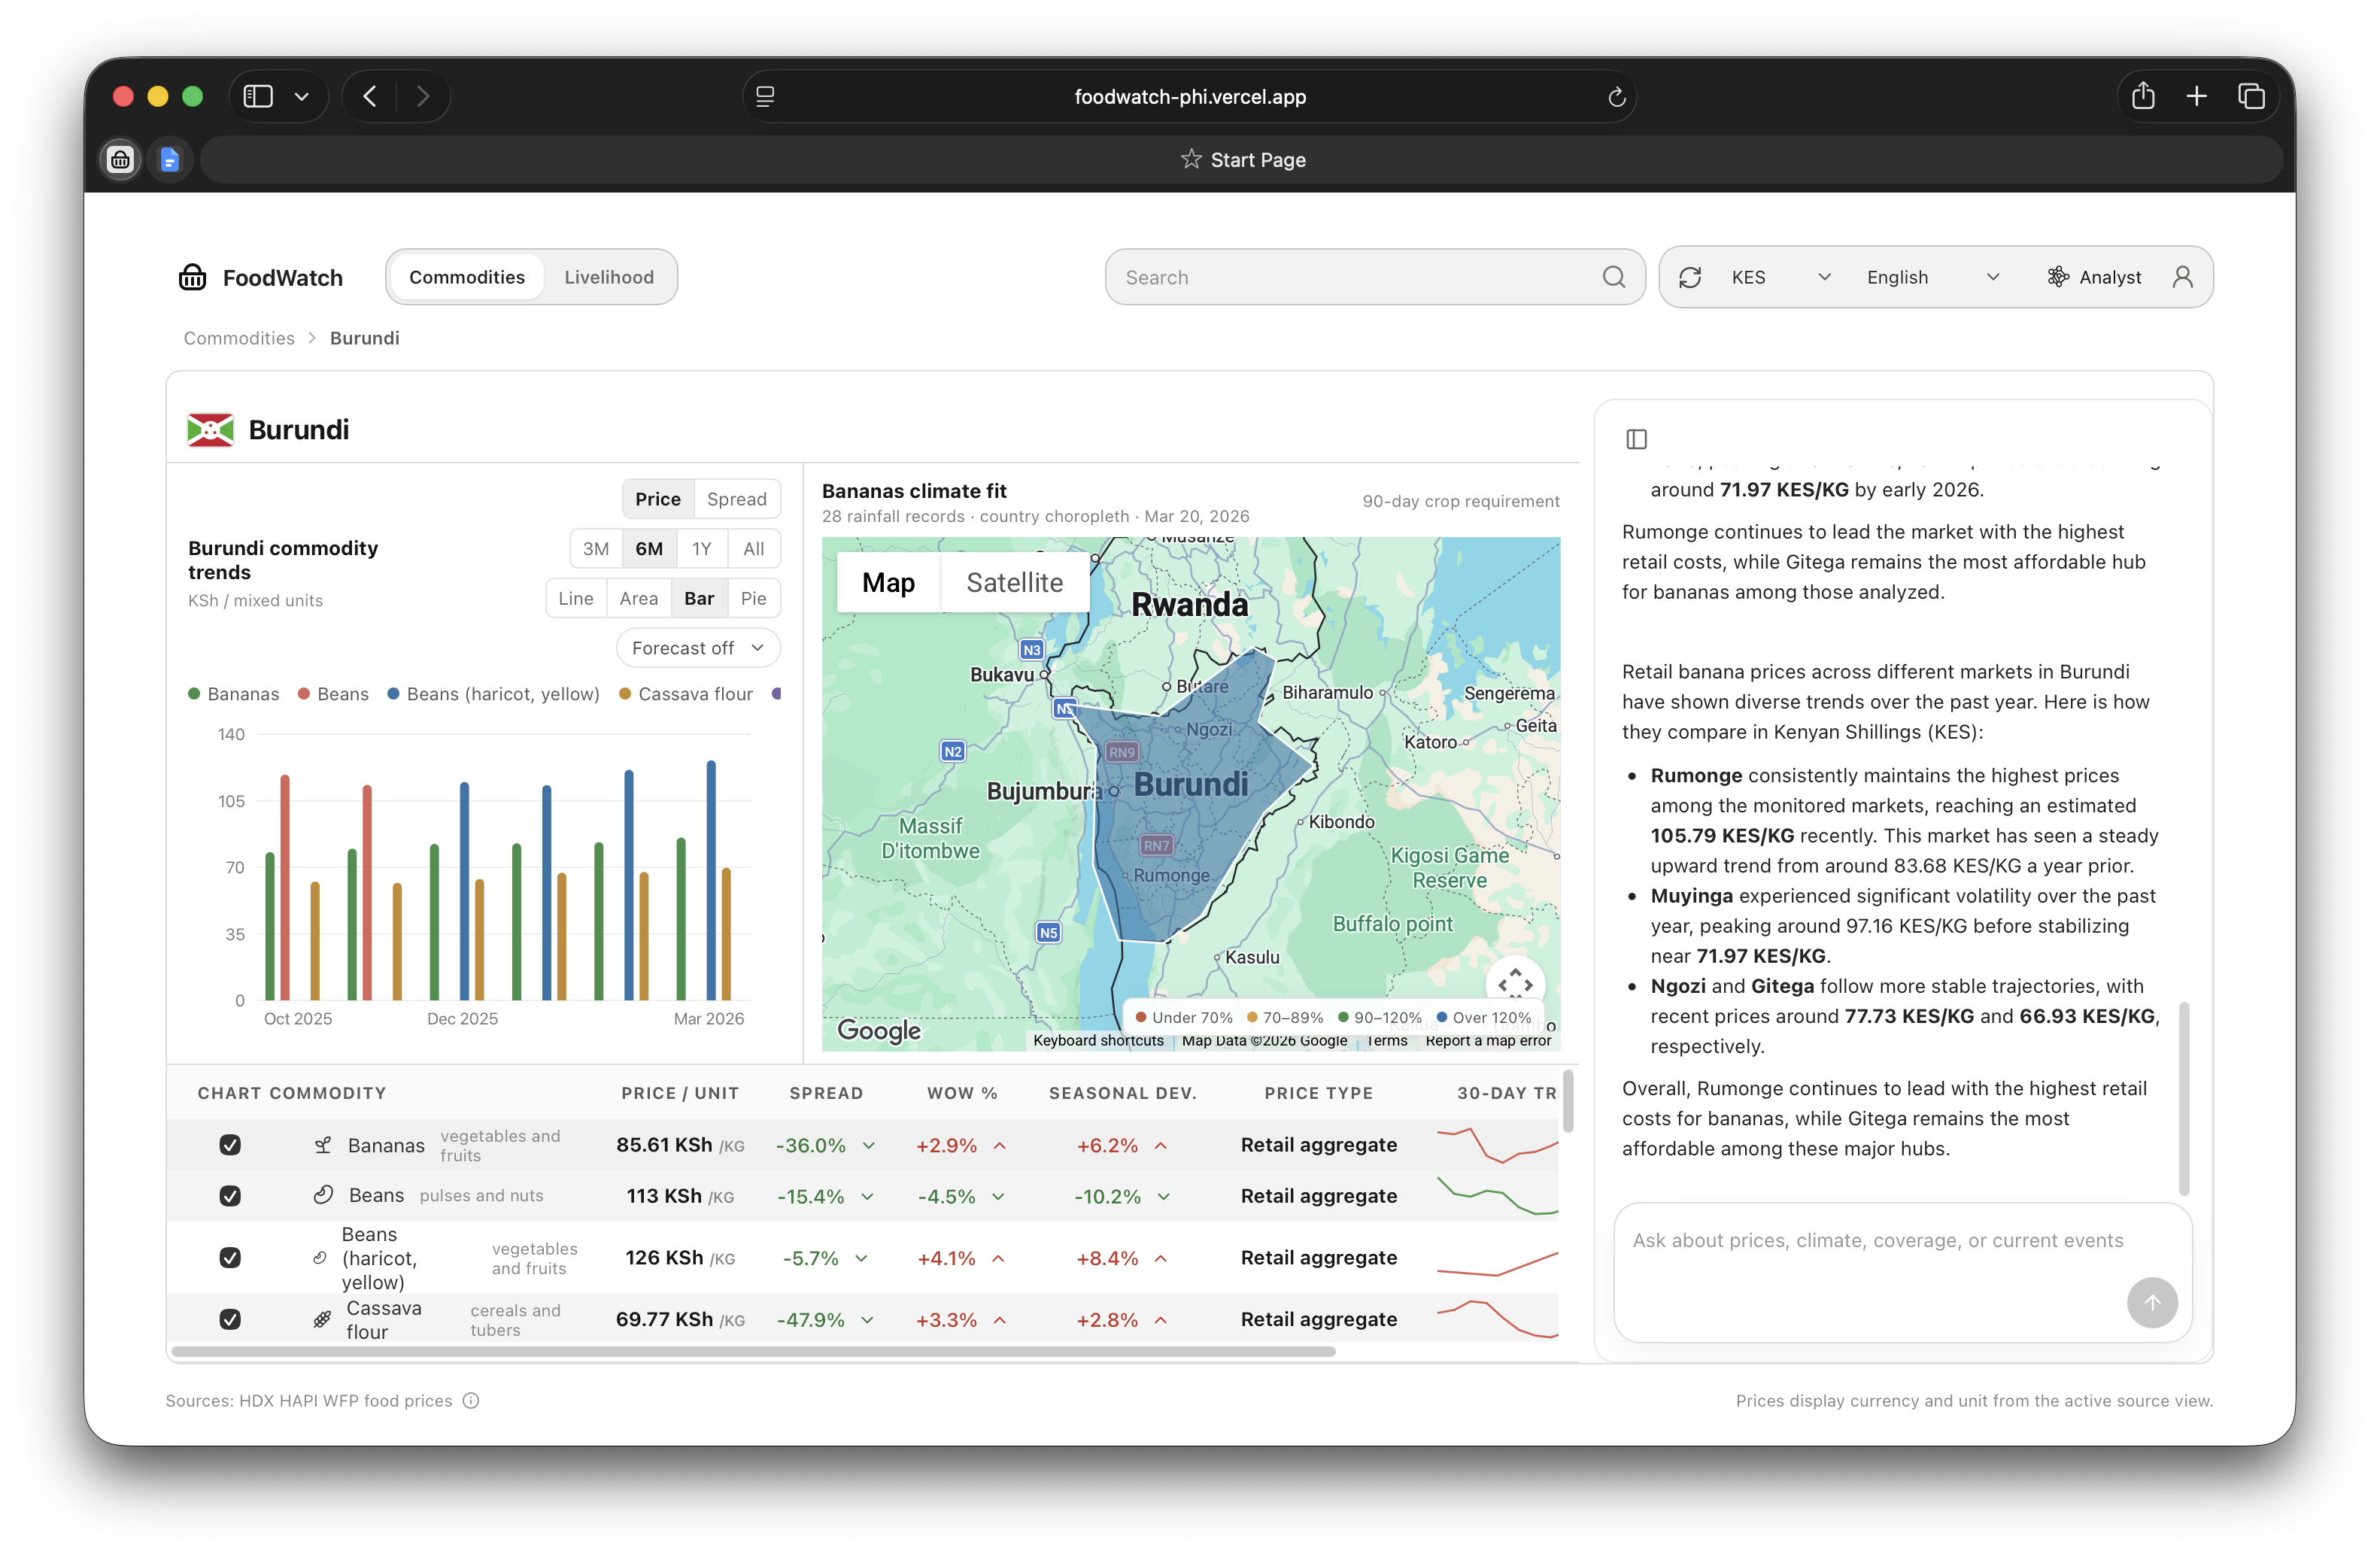
counry view
-
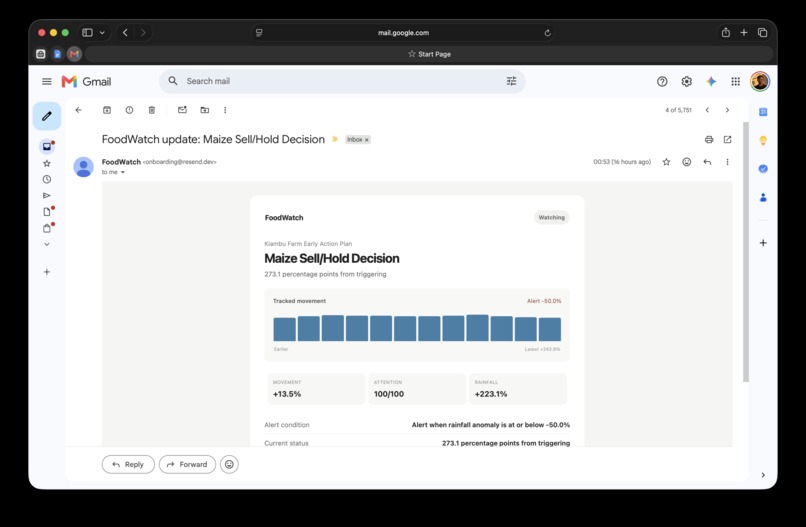
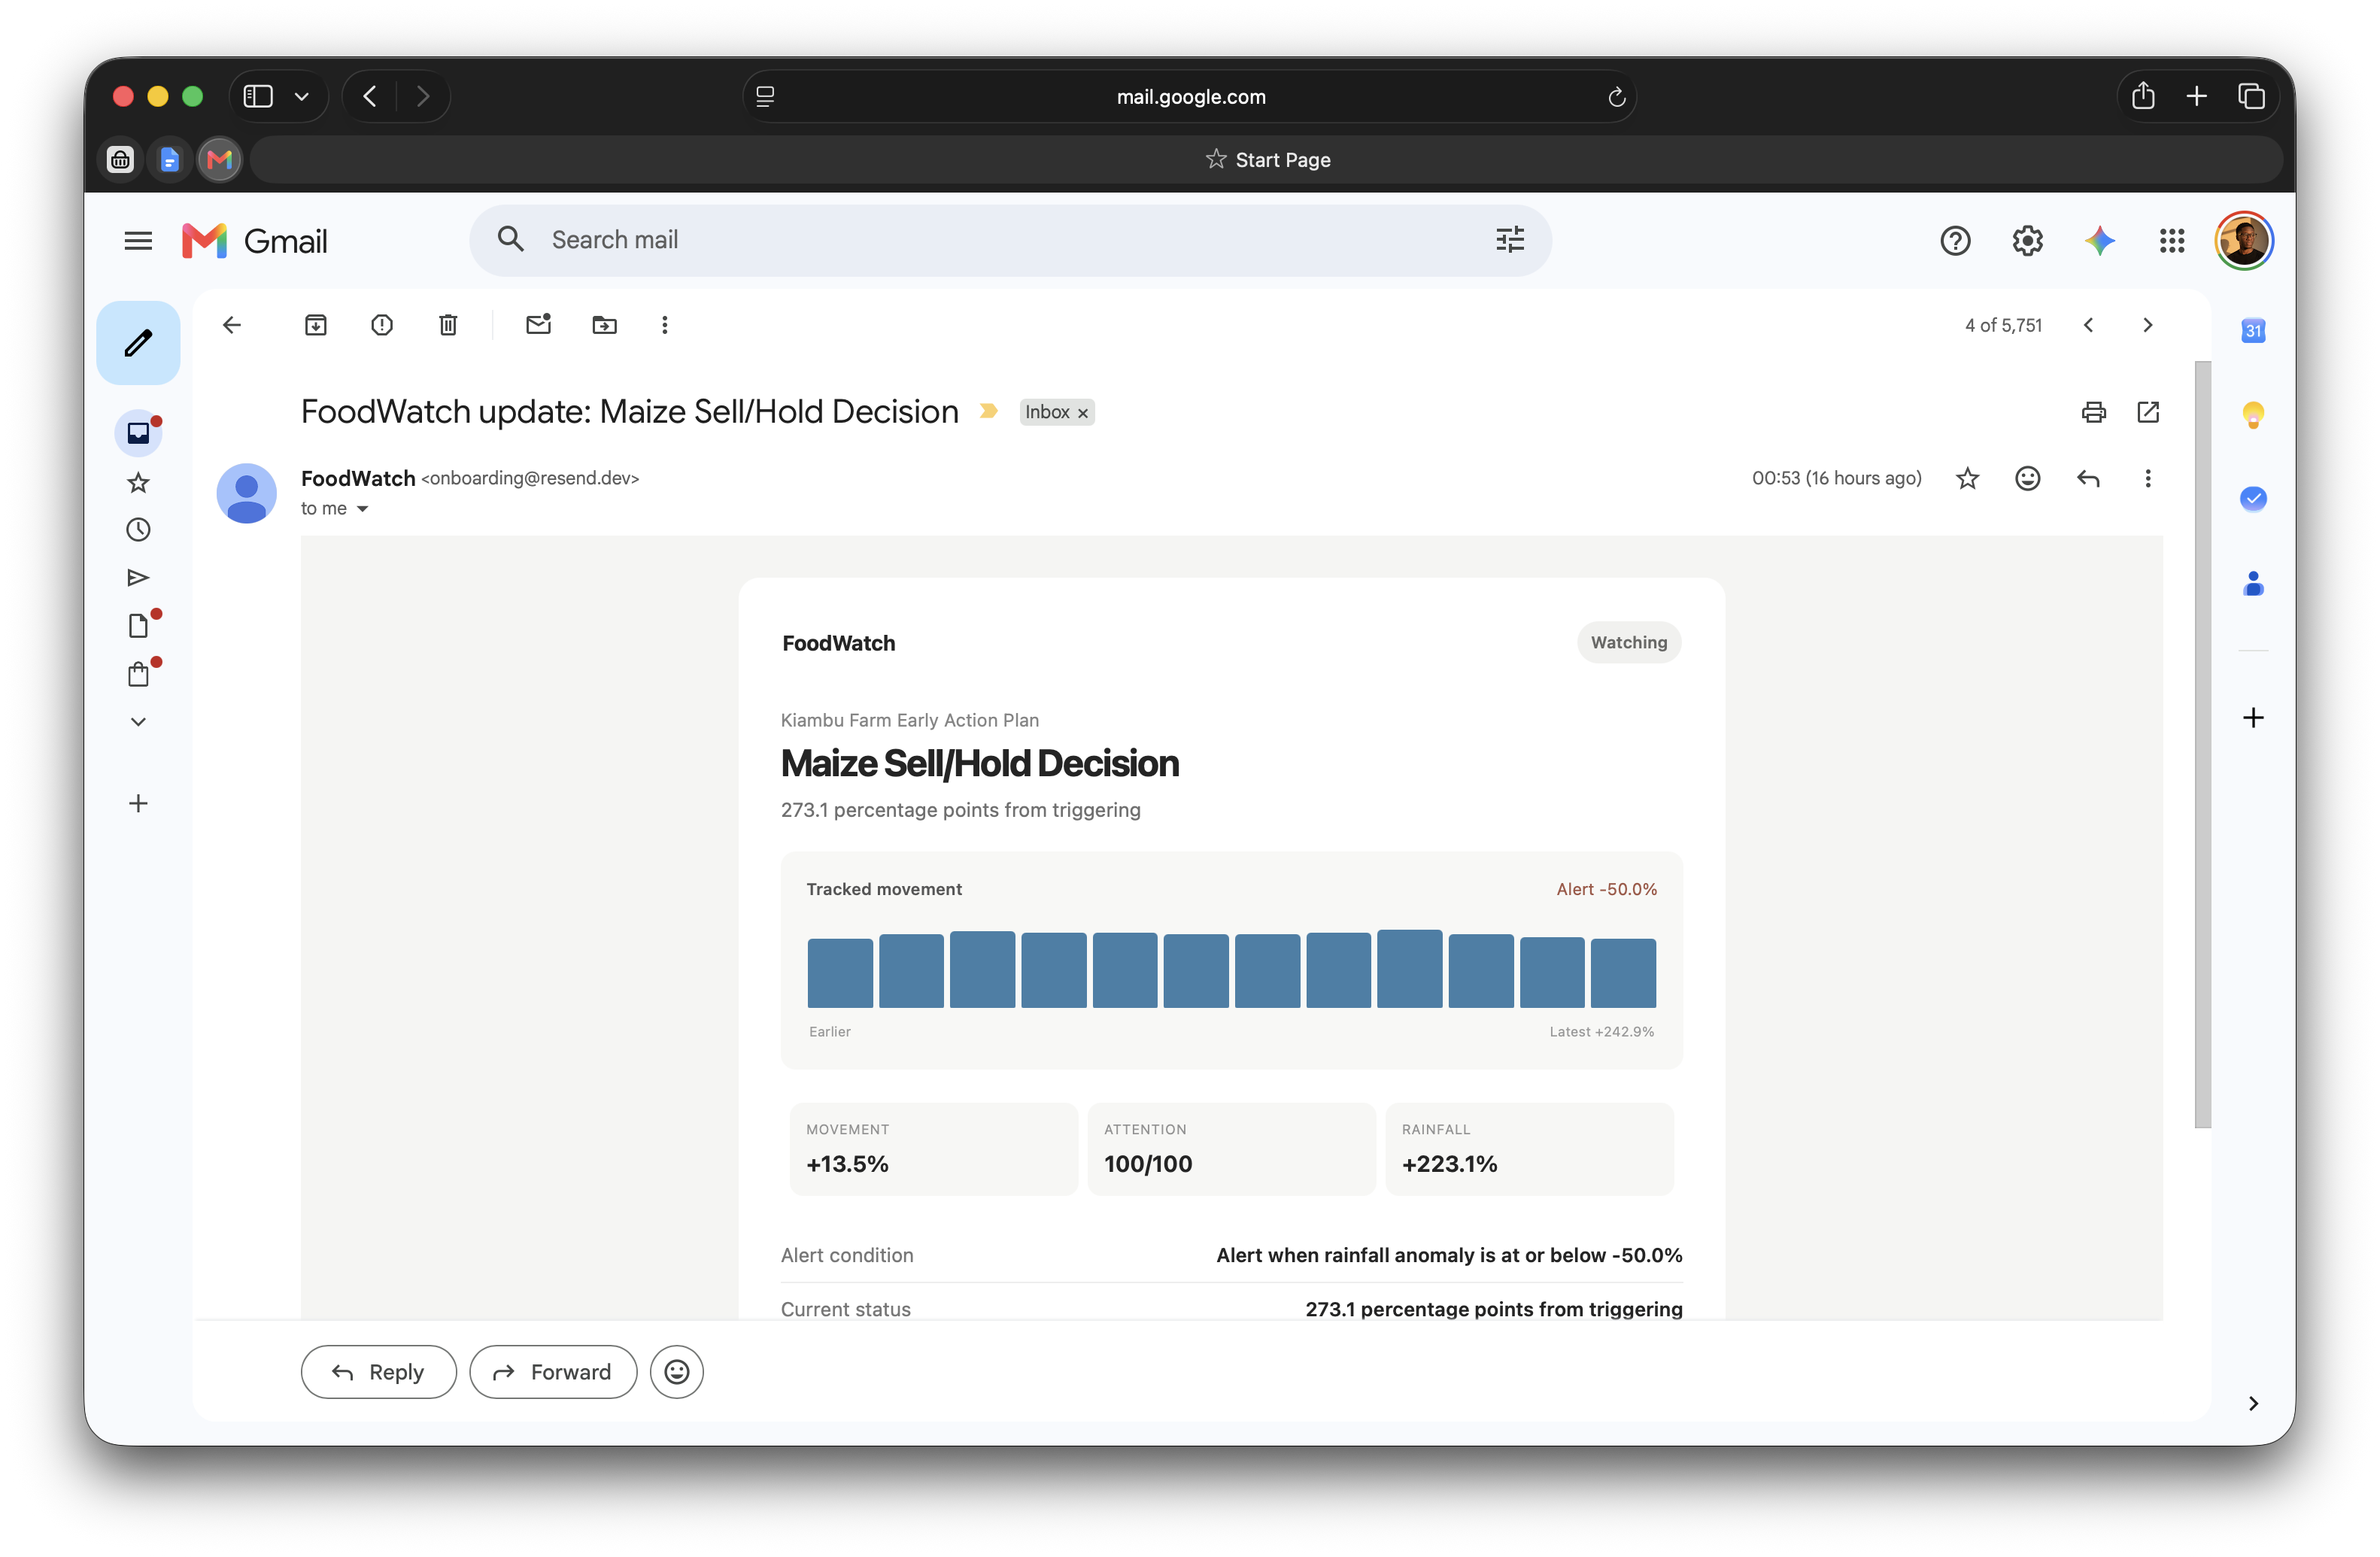
email alerts
FoodWatch
From climate warning to food-system early action.
FoodWatch is an AI-native intelligence and action workspace for climate-sensitive food markets across the Greater Horn of Africa. It connects rainfall, crop-water requirements, food prices, market geography, production, currencies, livelihood tracking, and community alerts so that a regional climate signal can become a decision for a country, a commodity, a programme, or an individual farmer.
Built for: IGAD Hackathon 2026: Smarter Early Warning, Stronger Communities
Inspiration
FoodWatch began with a gap in the early-warning chain.
Climate institutions can identify a developing hazard. They can describe an El Niño, a rainfall deficit, or an unusually wet season across the Greater Horn of Africa. But a farmer, a market analyst, an extension officer, and a regional policymaker do not need the same explanation or the same action. A forecast becomes useful to them only when it is translated into the crop, market, livelihood, and decision in front of them.
That is the central challenge behind the IGAD Hackathon's theme, “Smarter Early Warning, Stronger Communities.” The competition asks how information can be generated, communicated, understood, and transformed into timely action. Its resources explicitly encourage AI, predictive modelling, geospatial systems, digital communication, community engagement, and the study of thresholds and triggers. FoodWatch brings those areas together as one operational system rather than treating them as separate demonstrations.
The urgency is measurable. IGAD's 2024 regional focus of the Global Report on Food Crises reported that approximately 62.9 million people—25% of the analysed population across seven countries—faced high levels of acute food insecurity. This is not only a production problem. Climate extremes interact with food prices, conflict, currency depreciation, transport, seasonality, and household purchasing power.
Recent research reinforces the connection while showing why simplistic claims are dangerous. A 2026 study of five East African countries found significant long-run relationships between precipitation and temperature anomalies and food-price inflation (Mwakalila, 2026). European Commission research on ENSO and retail food prices found that the magnitude and direction of price effects vary substantially by event, region, crop, and time horizon (JRC, 2026). Climate matters, but its impact travels through a food system.
This is also the direction of regional policy. ICPAC's EarlyWarning4IGAD programme is moving from hazard-based warnings toward impact-based systems that incorporate exposure and vulnerability. The IGAD Institutional and Operational Framework for Multi-Hazard Early Warning and Early Action argues that warnings create value when they facilitate action that protects lives and livelihoods. The forthcoming GHACOF74 in Kigali makes the challenge even more immediate: its theme is harnessing climate services for early action and resilience in the face of a strong El Niño.
We built FoodWatch as the food-system impact and action layer for that climate intelligence.
Climate signal
      -> crop-water and rainfall pressure
      -> commodity and market instability
      -> livelihood exposure
      -> personalized threshold
      -> individual or community action
What it does
FoodWatch connects four modes of work: observe, investigate, track, and act.
Observe the regional food system
The regional workspace shows East African countries and the commodities currently available in each one. Every observation preserves the dimensions that determine whether a comparison is valid: commodity, market, date, currency, unit, and retail or wholesale price type.
Instead of reducing the system to red and green labels, FoodWatch exposes the mathematics behind each signal:
- Latest-period movement compares the two most recent compatible observations.
- Deviation from the recent baseline compares the latest price with up to eleven preceding periods.
- Comparable-market spread measures a price against the median of observations sharing its currency, normalized unit, and price type.
- Rainfall anomaly measures observed rainfall against the relevant long-term average.
- Crop rainfall coverage compares median observed three-month rainfall with a 90-day water requirement derived from the crop's typical growing duration and seasonal water range.
The interface includes regional, country, and commodity workspaces. A country view can expose subnational rainfall variation that disappears inside a national mean. A commodity view can compare one crop across countries, convert supported currencies and units, examine rainfall beside price movement, and explore bounded three-period scenarios using linear trend, recent average, or exponential smoothing.
FoodWatch currently presents usable upstream coverage across Burundi, Djibouti, Ethiopia, Kenya, Rwanda, Somalia, Sudan, Tanzania, and Uganda. Coverage remains dependent on the available source observations; missing data stays missing.
Investigate with a bounded AI analyst
Every analytical workspace includes a context-aware FoodWatch analyst. The analyst can inspect what the user is viewing, retrieve dated series, compare markets, convert currencies, examine production, calculate volatility and percentile ranks, detect outliers, fit correlations and regressions, create short scenario projections, and render charts or tables directly inside the conversation.
The AI is deliberately divided into specialists:
- The parent analyst, powered by Gemini 3.1 Pro Preview, interprets the question and reconciles the answer.
- The data specialist, powered by Gemini 3 Flash Preview, receives typed tools for FoodWatch's internal evidence, statistical methods, projections, and visualization.
- The research specialist receives grounded Google Search for current climate outlooks, policy changes, conflict, transport disruption, and other external explanations.
Internal observations and external research are kept separate until the parent analyst reconciles them. This allows FoodWatch to ask academically meaningful questions—such as whether a pulse-price shock is isolated or whether a white-maize pattern is consistent with El Niño—without converting correlation into causation.
Track the decisions that matter to a livelihood
Regional analysis becomes persistent inside the Livelihood workspace. A project acts as a folder; every tracking file represents a named country-and-commodity concern.
For a small farmer, a project can look like this:
Kiambu Farm Early Action Plan
├── Maize — harvest and feed costs
├── Beans — household food and market income
├── Cabbage — short-cycle cash crop
├── Kale — continuous household and market supply
└── Cowpeas — dry-condition alternative
FoodWatch recalculates percentage movement, return volatility, recent-baseline deviation, rainfall anomaly, normalized trend, and an attention value for every file. Normalization allows unlike crops and price levels to be examined together. Attention orders observed instability; it is not a probability of harm.
This is where the same regional evidence becomes personal. A farmer can organize crops around planting, holding, selling, or water-management decisions. A cooperative can organize files around procurement and member support. A government or humanitarian programme can track several countries, markets, and livelihood portfolios without changing the underlying analytical system.
Turn tracked evidence into early action
Tracked files can be connected to personal or community alerts. A rule can monitor one or several projects, select exact files, and respond to:
- an attention threshold;
- a price decline;
- rainfall moving materially below normal;
- rainfall moving materially above normal; or
- a scheduled evidence summary.
Alerts can be evaluated instantly, daily, or weekly in the recipient's time zone. A saved community contains named contacts rather than an anonymous broadcast list, allowing the same evidence to reach a farmer, cooperative lead, extension officer, or field coordinator through SMS, email, or both.
The AI helps the user construct the rule, but it does not decide to send a message. Deterministic application code evaluates the threshold, checks the schedule, prevents duplicates, creates the delivery record, and calls Mobitech or Resend. The message includes the current movement, rainfall, attention, trigger condition, and distance from the threshold.
FoodWatch therefore completes the path the theme demands:
A warning is generated, investigated, understood in context, assigned to a livelihood, converted into an explicit trigger, and delivered to a named person who can act.
The interface supports nine languages: English, Kiswahili, French, Arabic, Somali, Amharic, Kinyarwanda, Kirundi, and Oromo. Source names, place names, currencies, and units remain unchanged during localization so accessibility does not weaken provenance.
How we built it
FoodWatch is built around one system invariant:
AI may choose an investigation and help configure an action, but deterministic software owns data validation, persistence, scheduling, and delivery.
Data plane
A FastAPI service connects to explicit source adapters:
| Evidence source | Role in FoodWatch |
|---|---|
| HDX Humanitarian API | WFP food prices, market locations, and rainfall observations |
| FAOSTAT | Domestic agricultural production context |
| World Bank Indicators | Official exchange-rate context |
| World Bank Pink Sheet | Global commodity-market metadata |
| Frankfurter | Current USD-based currency conversion |
| Grounded Google Search | Current external evidence, including relevant IGAD and ICPAC publications |
The backend builds a daily snapshot of regional market observations, rainfall, market geography, and exchange rates. It groups food-price observations by commodity, currency, unit, and price type, then constructs dated compatible series. SQLite-backed snapshot and commodity caches reduce provider cost and latency. Async locks coalesce simultaneous refreshes so a cold request does not become several identical upstream calls.
The frontend never compares a 100-kilogram wholesale price with a one-kilogram retail price as if they were equivalent. Supported mass and volume packages are normalized; currency conversions use the relative USD rates of both currencies; market spreads are calculated only inside compatible groups.
Mathematical layer
The visible metrics are compact but inspectable:
| Signal | Current calculation |
|---|---|
| Period movement | (latest - previous) / previous x 100 |
| Recent-baseline deviation | (latest - mean(previous periods)) / mean(previous periods) x 100 |
| Comparable spread | (price - compatible median) / compatible median x 100 |
| Rainfall anomaly | (observed - long-term average) / long-term average x 100 |
| Crop rainfall coverage | median observed 3-month rainfall / prorated 90-day crop-water need x 100 |
| Return volatility | population standard deviation of period-to-period percentage returns |
| Normalized tracking trend | (price - first valid price) / first valid price x 100 |
The crop-water layer maps supported foods into agronomic families, including maize, beans and cowpeas, sorghum and millet, rice, potatoes, cabbage and kale, onions, bananas, and other crops. It uses a seasonal water range and typical growing duration to contextualize observed rainfall for that crop. Unsupported crops display no value rather than receiving a fabricated requirement.
Scenario controls expose three deliberately simple assumptions: least-squares linear continuation, a three-period recent average, and an exponential moving average with greater weight on recent observations. They are shown as scenarios, not validated forecasts. The distinction matters because a model that cannot describe its assumption should not drive early action.
AI and tool plane
Google ADK coordinates the parent, data, research, livelihood, and alert agents. Each agent receives the smallest useful context and authority surface. The data specialist has catalog, series, market, rainfall, production, currency, statistics, projection, and rendering tools. The livelihood agent can create and analyse projects and tracking files. The alert agent can manage communities and alert configurations, but cannot bypass application mutations or provider authorization.
This specialization is partly a reliability decision. Research on long-context language models shows that relevant information is not used uniformly when it is buried inside large contexts (Lost in the Middle, TACL 2024). FoodWatch passes the active specialist the current workspace context and a bounded tool set instead of repeatedly giving one universal agent every instruction, dataset, and mutation capability.
Tool results are structured. Analytical renderers return validated line, bar, pie, scatter, metric, and table widgets. The React frontend validates those payloads before rendering them. If the model emits a recognized widget payload as text instead of completing the render call, FoodWatch can recover it through the same validator without interpreting unrelated JSON as interface code.
Failure is also part of the contract. Tools classify invalid input, ambiguity, missing data, provider failure, timeout, rate limiting, cancellation, and internal errors. Each category includes retryability and recovery guidance. The model can correct an argument or change scope; it cannot make a failed retrieval look successful.
Application and action plane
The operational surface uses Next.js 16, React 19, TypeScript, Recharts, Google Maps, SWR, NextAuth, and the Google Cloud Firestore SDK. The FastAPI service streams Google ADK events to the frontend through server-sent events, allowing users to see specialist handoffs, tool activity, reasoning summaries, and rendered evidence as the answer develops.
Firestore stores accounts, livelihood projects, tracking files, saved communities, alert rules, and delivery history. Repeated livelihood reads are coalesced by stable request identity and invalidated after the relevant mutation.
The alert dispatcher is deterministic. It reloads the selected project insights, evaluates the threshold, resolves the user's local schedule, hashes the evidence and delivery window to enforce idempotency, sends through Mobitech SMS or Resend email, and records sent, skipped, delivered, or failed outcomes. Instant alerts re-arm only after the trigger recovers or the underlying evidence changes.
The result is a strict authority chain:
model chooses the investigation
tools retrieve and calculate
UI validates and explains
user selects the livelihood decision
application evaluates the trigger
provider transports the message
delivery history records the outcome
Challenges we ran into
Making heterogeneous food data mathematically comparable
The same crop can appear in different currencies, package sizes, price types, dates, and markets. Our first responsibility was not visualization; it was preventing invalid comparisons. We built explicit series identities, package normalization, relative FX conversion, compatible medians, normalized percentage trends, and source-aware chart construction.
This also changed the interface. Every price remains attached to its unit, currency, date, and supply-chain level. Formula controls explain how each derived metric was produced.
Connecting climate and prices without inventing causation
Rainfall and food prices operate at different spatial and temporal scales. The current FoodWatch snapshot can contain a three-month subnational rainfall observation beside a monthly commodity-price history. Those values are valuable together, but they do not automatically form a valid paired time series.
We therefore separated crop-water context, spatial rainfall anomalies, price movement, external research, and scenario projection. When timestamps cannot be aligned, the analyst must report the limitation instead of manufacturing a correlation. This constraint made FoodWatch more useful: it can distinguish an observed signal, a plausible mechanism, an association, and a causal claim.
Giving AI power without giving it unchecked authority
A universal agent with every data, mutation, and delivery tool would have been easier to prototype and harder to trust. We split the system into specialist agents and made every mutation wait for a real application result. A tracking file is not “created” until Firestore accepts it. An alert is not “sent” until deterministic dispatch records the provider result.
Recovering from providers and model-tool failures
Food and climate APIs can time out, return no data, reject a request, or report a rate limit. Those failures require different responses. We built a shared error taxonomy that tells the agent whether to correct input, ask one question, change scope, retry once, wait, or stop.
We also hardened the visualization boundary. Structured widget validation and in-place recovery prevent a malformed render call from destroying an otherwise valid analytical answer.
Preventing duplicate or accidental community messages
Early-action communication must be accountable. We separated creating an instant rule from authorizing an immediate delivery, required named recipients, validated project and tracking-file ownership, and added schedule buckets, content hashes, trigger state, and delivery records. The AI assists with configuration; application code owns every external side effect.
Preserving one investigation across several product surfaces
The application moves from region to country, commodity, livelihood, and alerts. Each surface has different context and permissions. We built structured workspace context, persistent chat sessions, Firestore-owned project state, and specialist application roots so that analysis can become action without turning the entire product into one unbounded prompt.
Accomplishments that we're proud of
We built the complete early-warning chain
FoodWatch does not stop at a regional chart or a generated notification. A user can discover a signal, inspect its exact series, test it statistically, compare it with climate conditions, research external drivers, preserve it inside a livelihood project, define a threshold, and deliver the resulting alert to a named individual or community.
The AI performs real analytical work
The analyst operates over typed tools for dated price and rainfall series, market comparison, production, currencies, volatility, percentiles, correlation, regression, outliers, scenario projection, and visualization. It can use internal and external evidence in the same investigation while preserving their provenance.
Climate intelligence changes with the crop and user
FoodWatch connects observed rainfall to crop-specific water context rather than showing one generic climate number. The same evidence can then be organized differently for a regional analyst, a country programme, a cooperative, or a small farmer.
Action remains deterministic and inspectable
Personal and community alerts are attached to real tracking files, explicit thresholds, named recipients, schedules, time zones, channels, and delivery history. Duplicate protection and provider outcomes are application concerns, not model improvisation.
The product is accessible without corrupting the evidence
FoodWatch supports nine languages across the region while preserving place names, source names, currencies, units, and market classifications. Accessibility is applied to the product language, not to the underlying facts.
The interface exposes its reasoning
Formula disclosures, source labels, visible tool activity, structured widgets, scenario styling, error states, and delivery history make the system legible. The user can see not only the answer, but how the answer was assembled and where its boundary lies.
What we learned
Early warning is a chain, not a prediction
A forecast can be scientifically strong and operationally incomplete. The value appears when the signal is connected to exposure, a decision, a threshold, a responsible person, and a time window. FoodWatch's deepest lesson was that the architecture must preserve that chain.
Climate impact is mediated by markets
Rainfall does not arrive at a household as a percentage anomaly. Its effects can move through crop development, harvest timing, roads, storage, exchange rates, imports, substitution between foods, and local market power. Food-price pressure is one observable transmission channel, not a complete measure of food security.
Comparability matters more than visual density
More data does not automatically create more intelligence. A correct comparison between two compatible series is more valuable than a regional chart that silently mixes currencies, units, retail prices, and wholesale prices. Data gaps and incompatible dimensions are part of the answer.
AI is strongest when reasoning and authority are separated
Gemini is useful for choosing an investigation, coordinating specialists, interpreting results, and adapting the workflow to a user. Typed tools are better for retrieval and calculation. Deterministic software is better for ownership checks, persistence, schedules, idempotency, and delivery. FoodWatch became more capable when each layer received a narrower responsibility.
Personalization does not require separate intelligence systems
A farmer and a regional institution can work from the same evidence without receiving the same interface or action. The regional workspace asks where pressure is emerging. The livelihood workspace asks what that pressure means for a specific portfolio. The alert workspace asks what condition should cause whom to act.
What's next for Foodwatch
Connect official climate outlooks directly to the impact layer
The next major step is to ingest official ICPAC seasonal outlooks, hazard products, and appropriate thresholds as first-class, dated evidence. FoodWatch can then connect the GHACOF climate scenario directly to crop-water context, market transmission, livelihood exposure, and user-defined early action.
Build validated food-pressure forecasting
The current projections intentionally remain simple scenarios. We plan to add historical climate time series, crop calendars, lagged climate-price analysis, hindcasting, uncertainty intervals, and country- and commodity-specific backtesting. A forecast will be promoted only when its historical performance can be measured.
Model impact at finer spatial resolution
We want to connect subnational rainfall, market locations, crop calendars, irrigation context, transport corridors, and locally reported conditions. This would allow FoodWatch to distinguish a national market signal from the areas and livelihoods most exposed to it.
Expand regional coverage
Current usable coverage spans nine countries. We plan to extend the same source and comparability contracts to Eritrea and South Sudan, deepen market histories, and expose data freshness and coverage at every level.
Add community feedback to the warning loop
Delivery is not the final state of an early-warning system. Communities should be able to confirm receipt, report local conditions, record the action taken, and help institutions evaluate whether a warning was timely and useful. This aligns with the WMO Early Warnings for All monitoring framework, which treats understandable warnings, enabled action, and last-mile feedback as measurable outcomes.
Harden the system for regional deployment
We plan to move snapshot and agent-session state across a durable cloud boundary, add broader integration tests for refresh, streaming, authenticated mutations, scheduling, and delivery, and publish operational metrics for data freshness, trigger performance, provider outcomes, and avoided losses.
The long-term objective is not another red risk map. It is a shared operating system through which climate institutions, governments, humanitarian teams, cooperatives, extension officers, and farmers can move from the same warning to the action appropriate for each of them.
FoodWatch makes climate intelligence personal enough to act on and structured enough to trust.

Log in or sign up for Devpost to join the conversation.