-
-

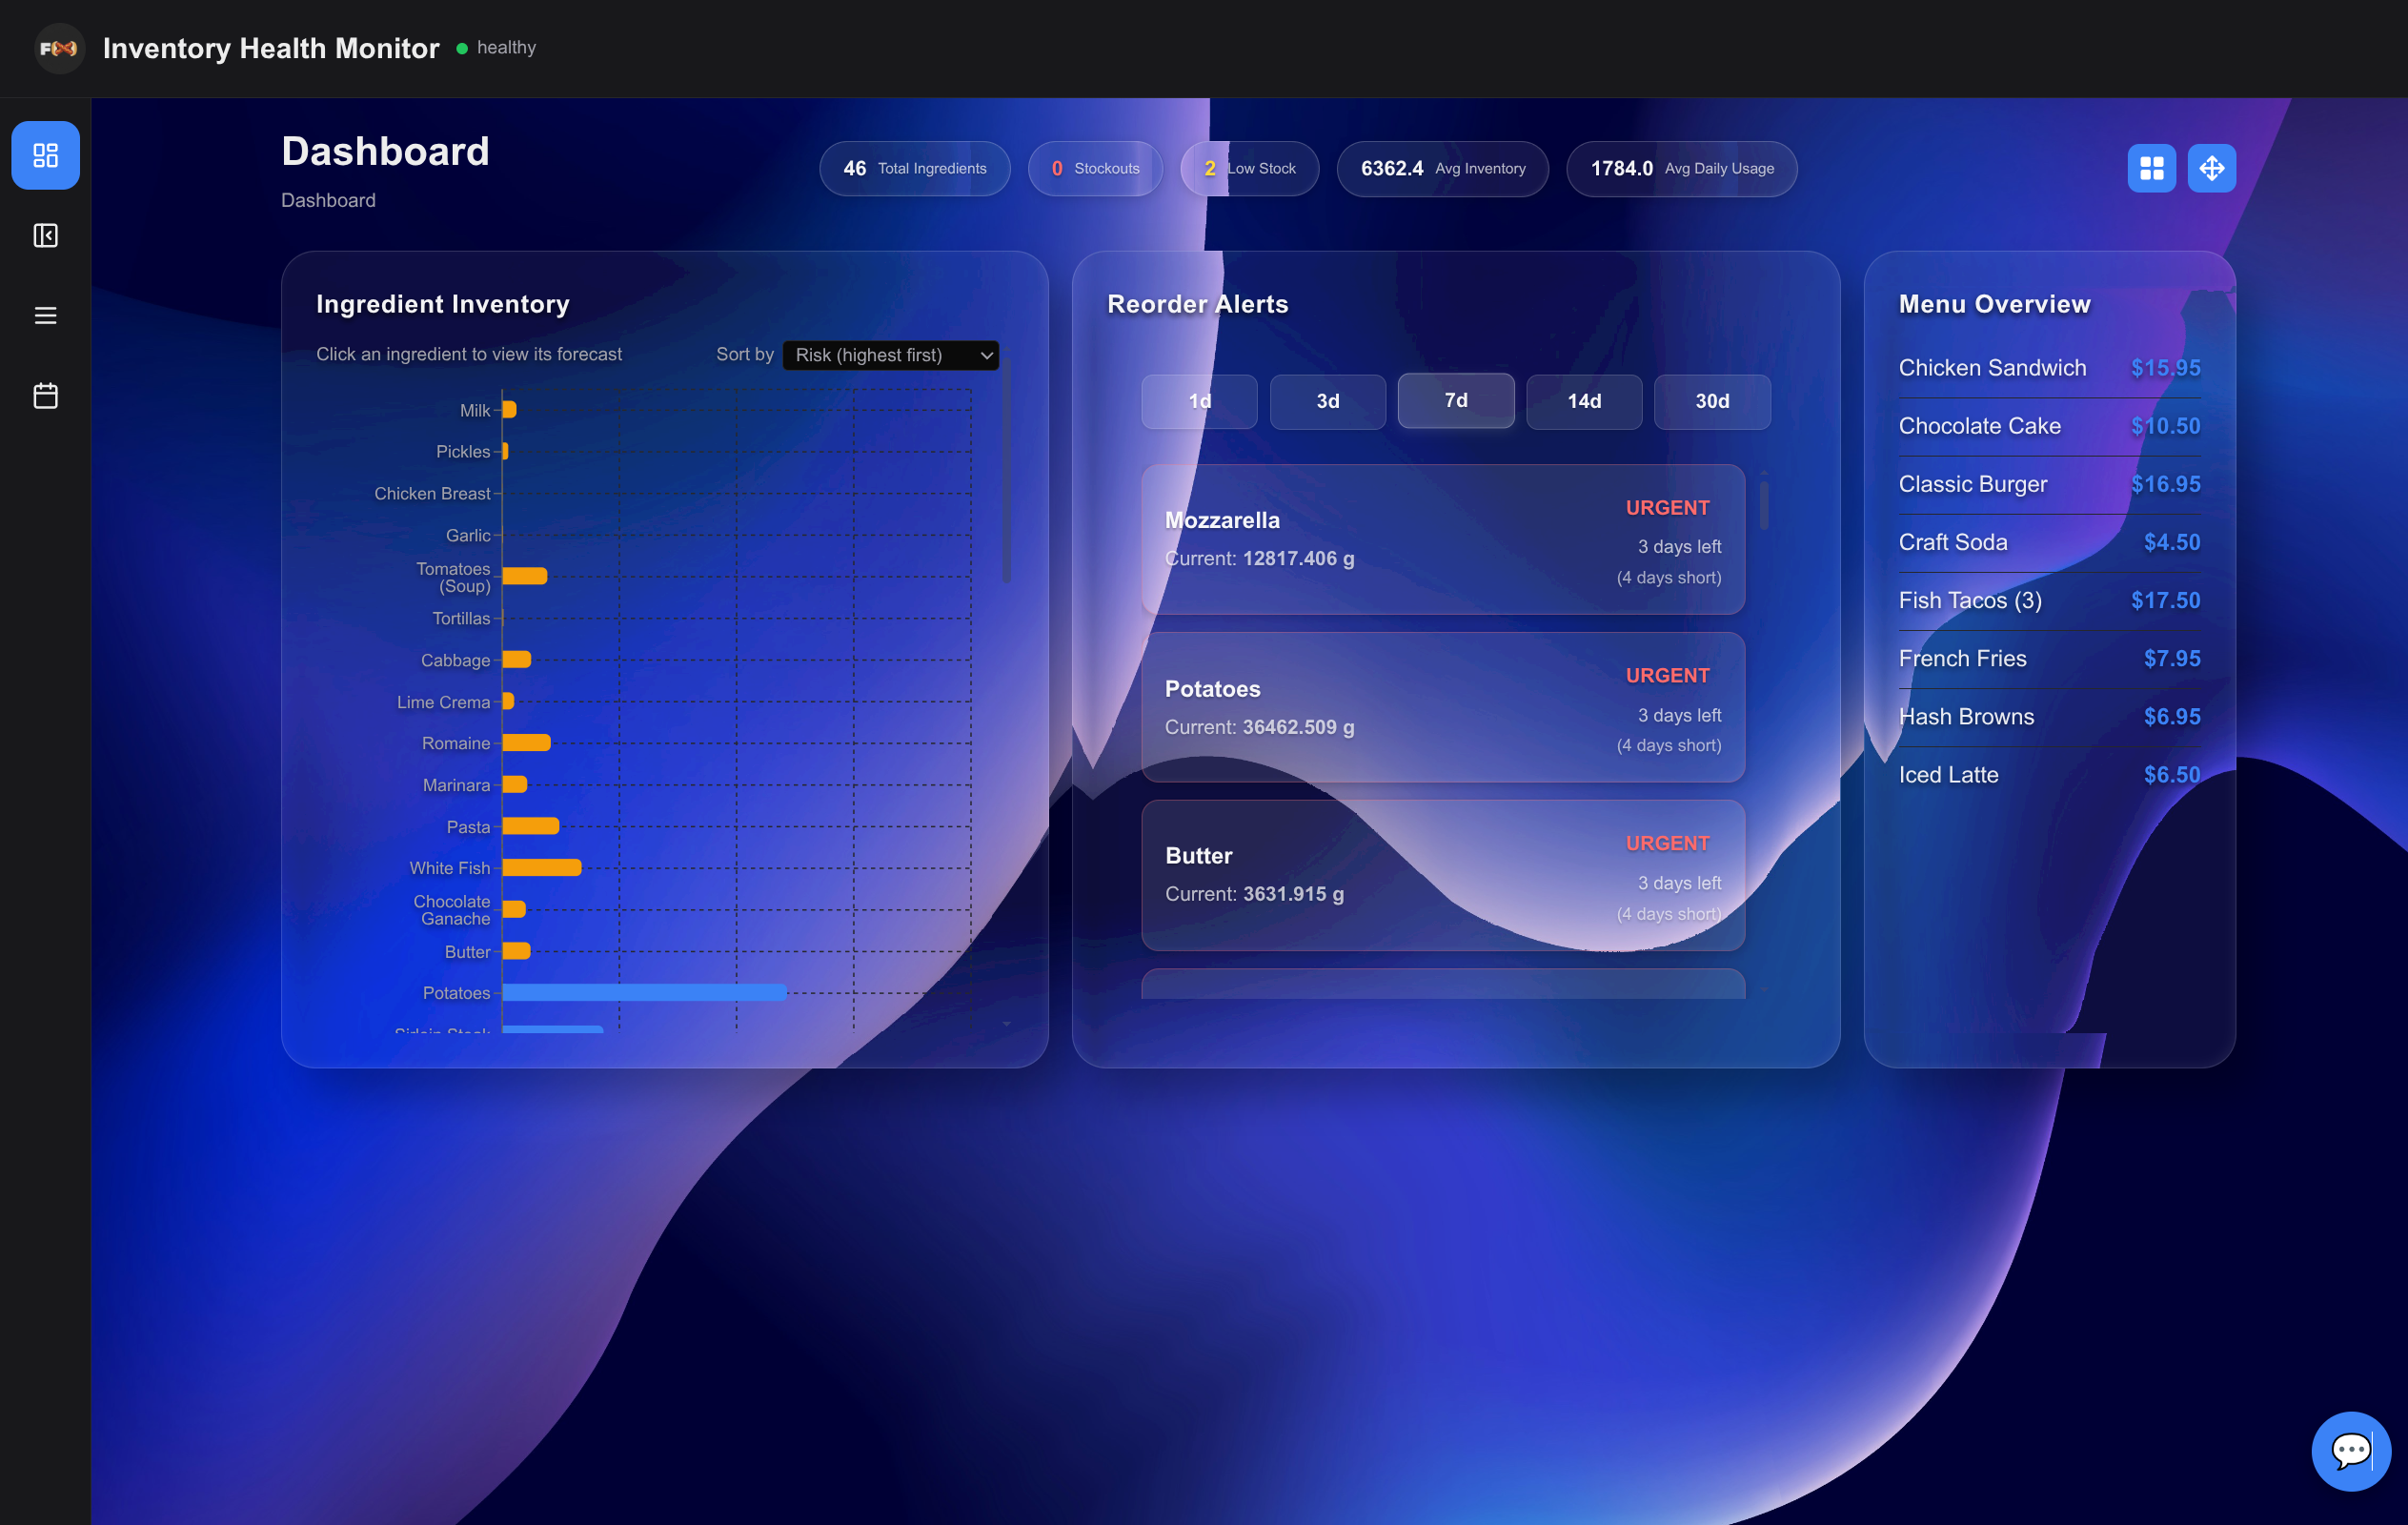
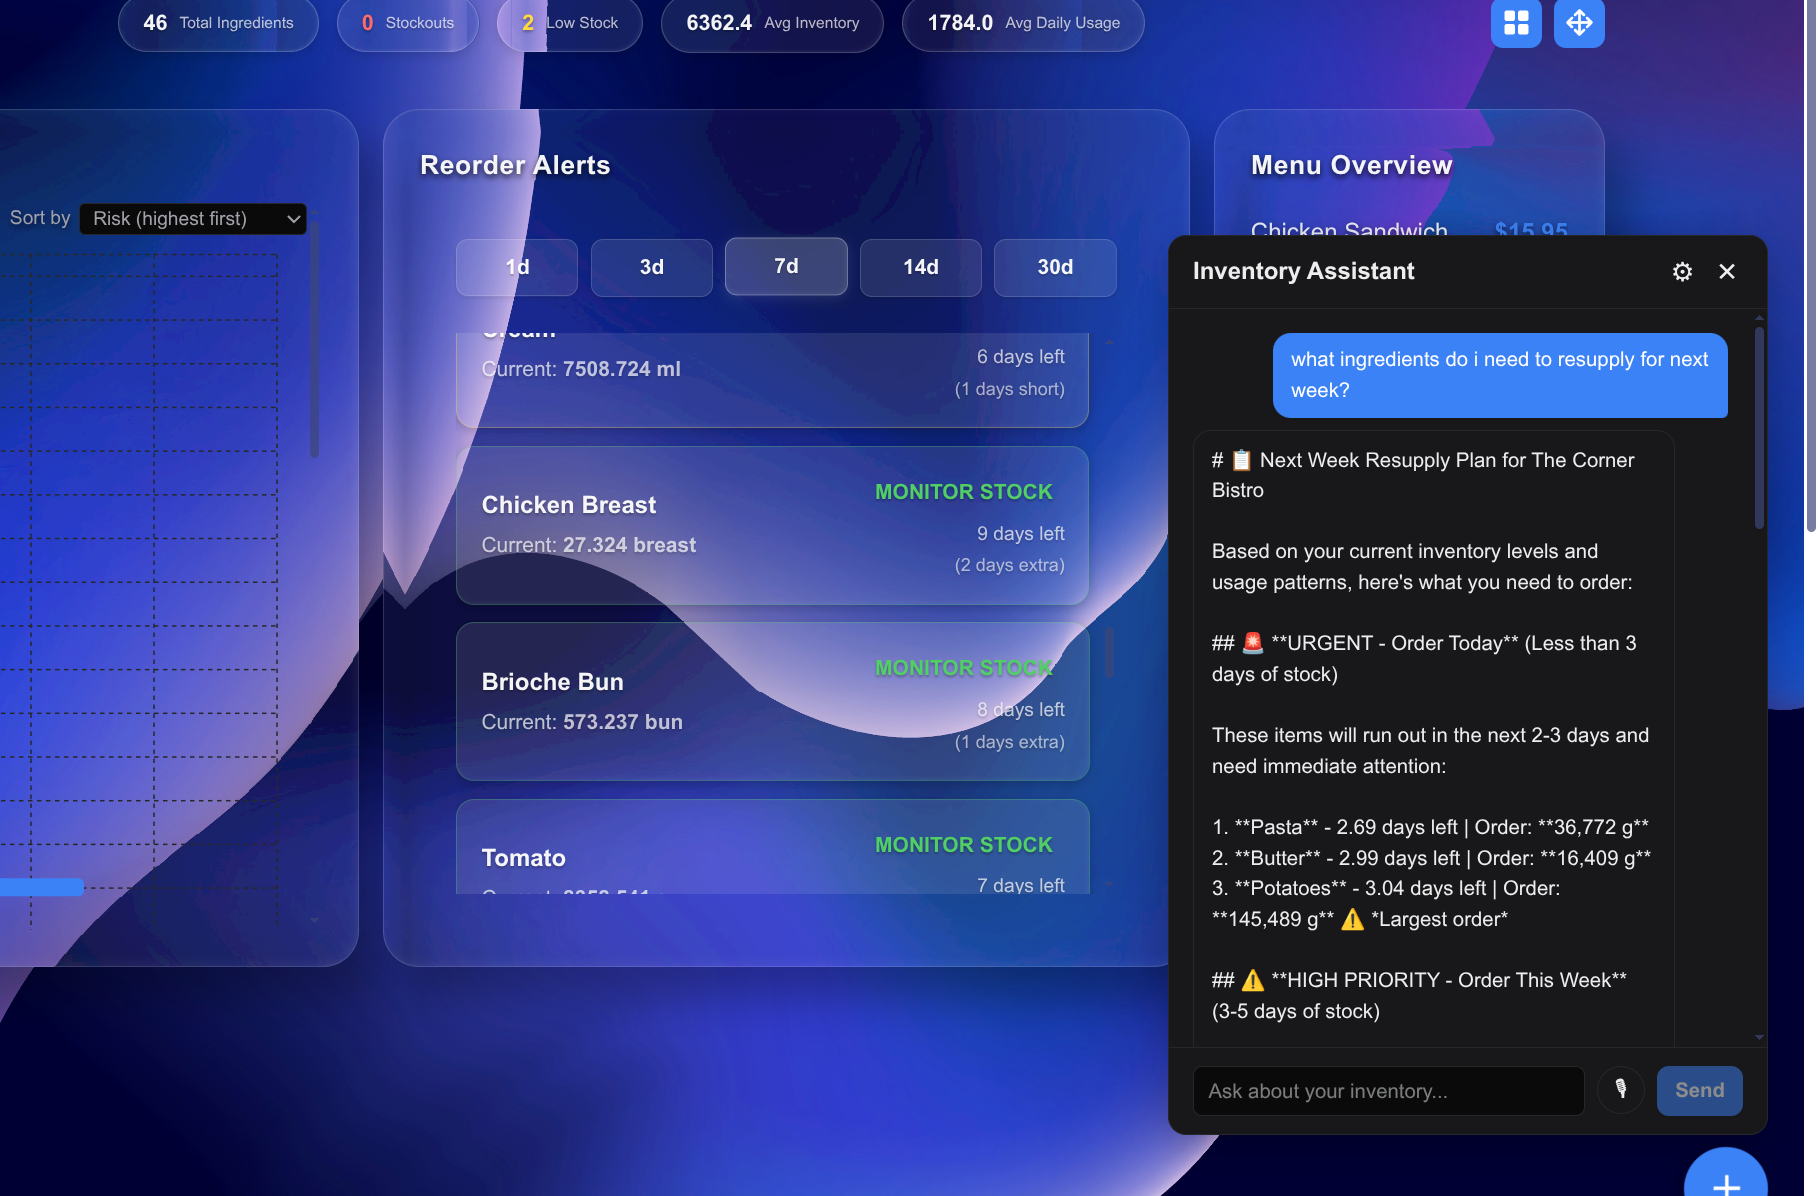
Main dashboard
-

Foodix logo
-
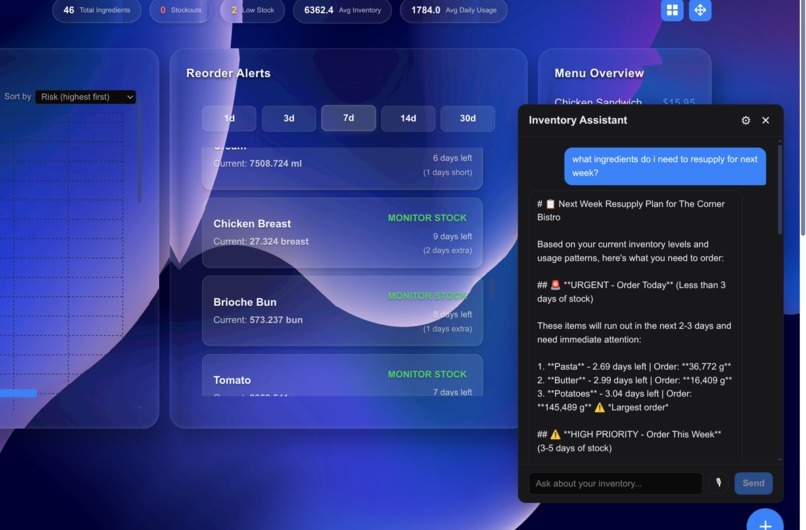
Get insights with the natural language to SQL chat bot!
-
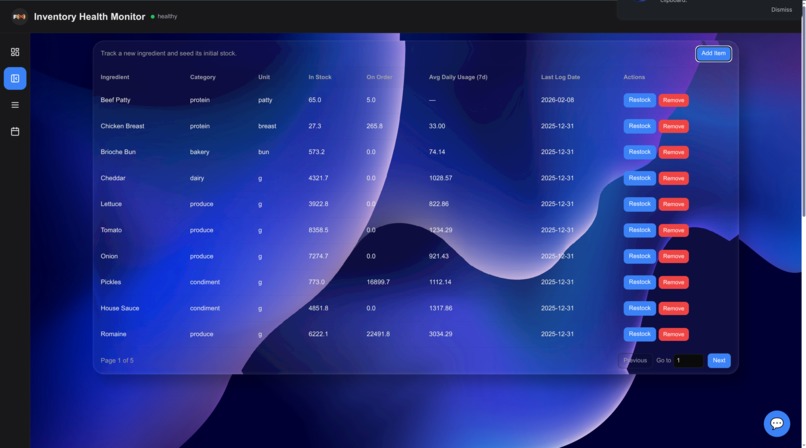
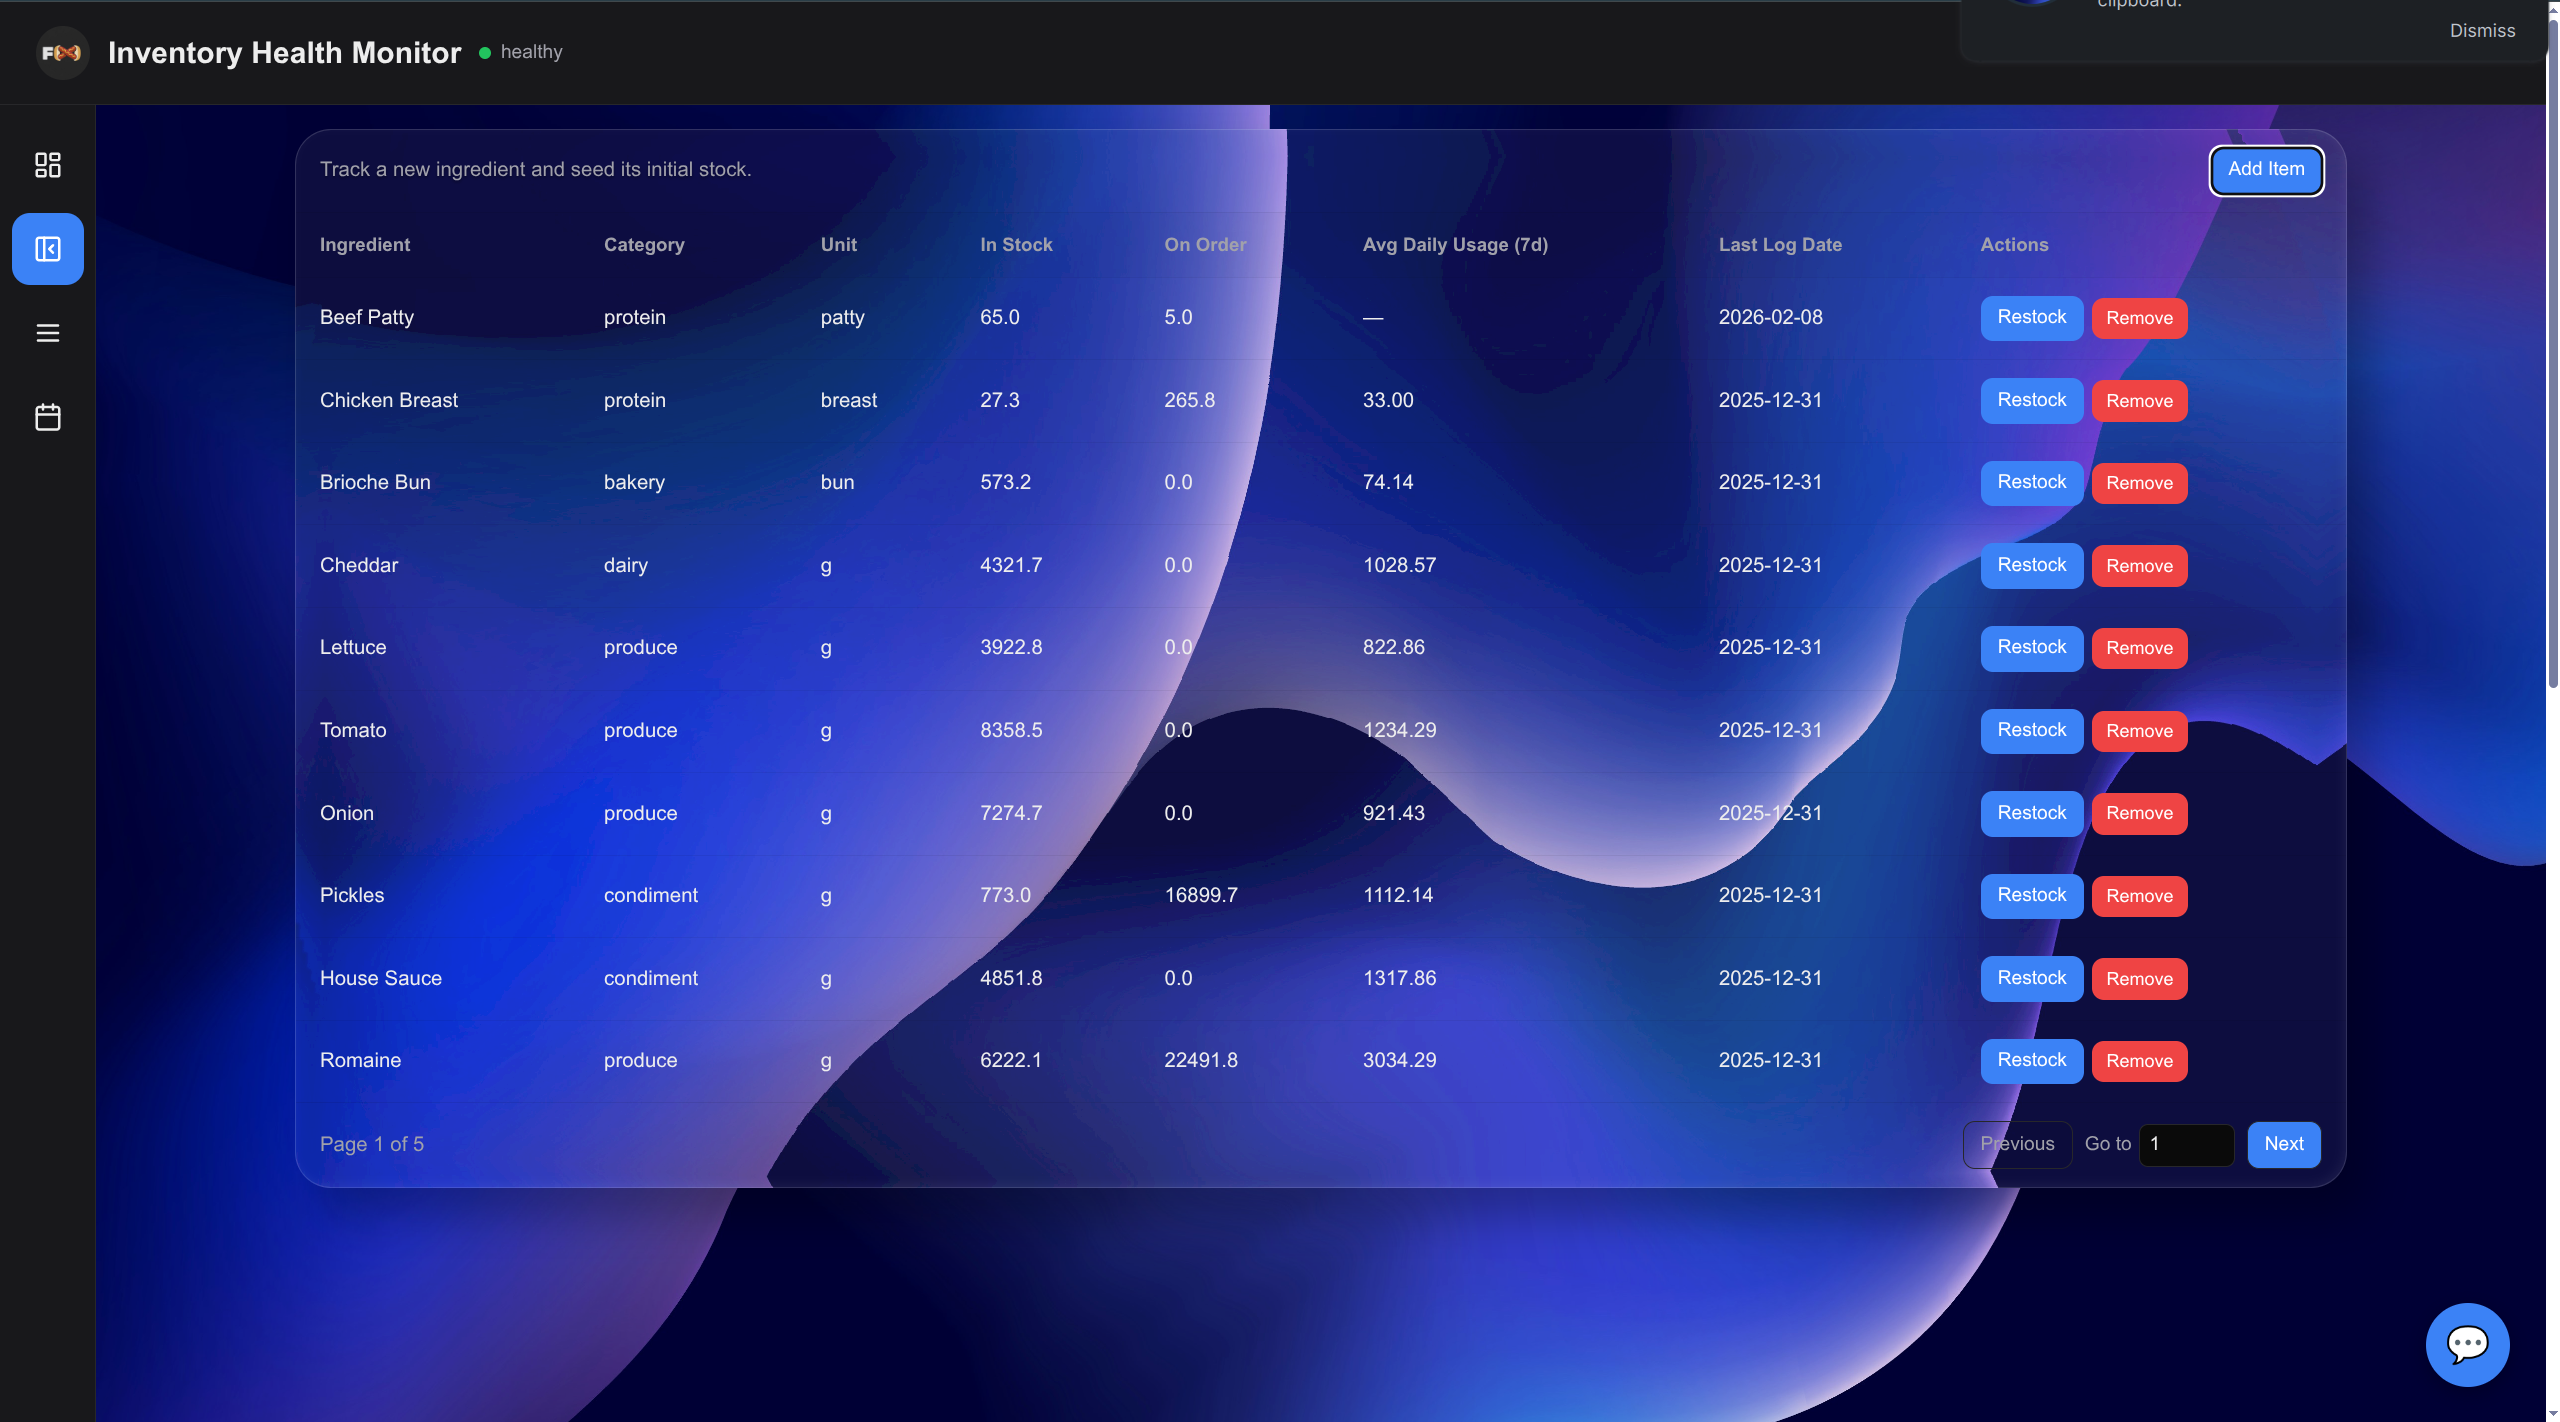
Ingredient management table
-
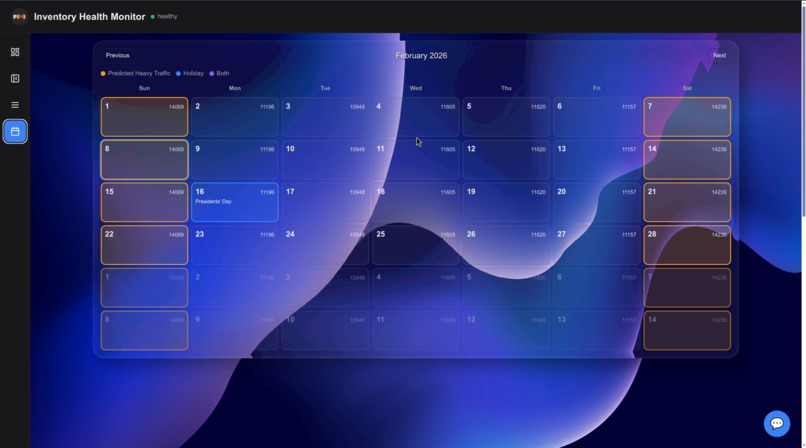
Calendar view showing days with predicted high traffic
-

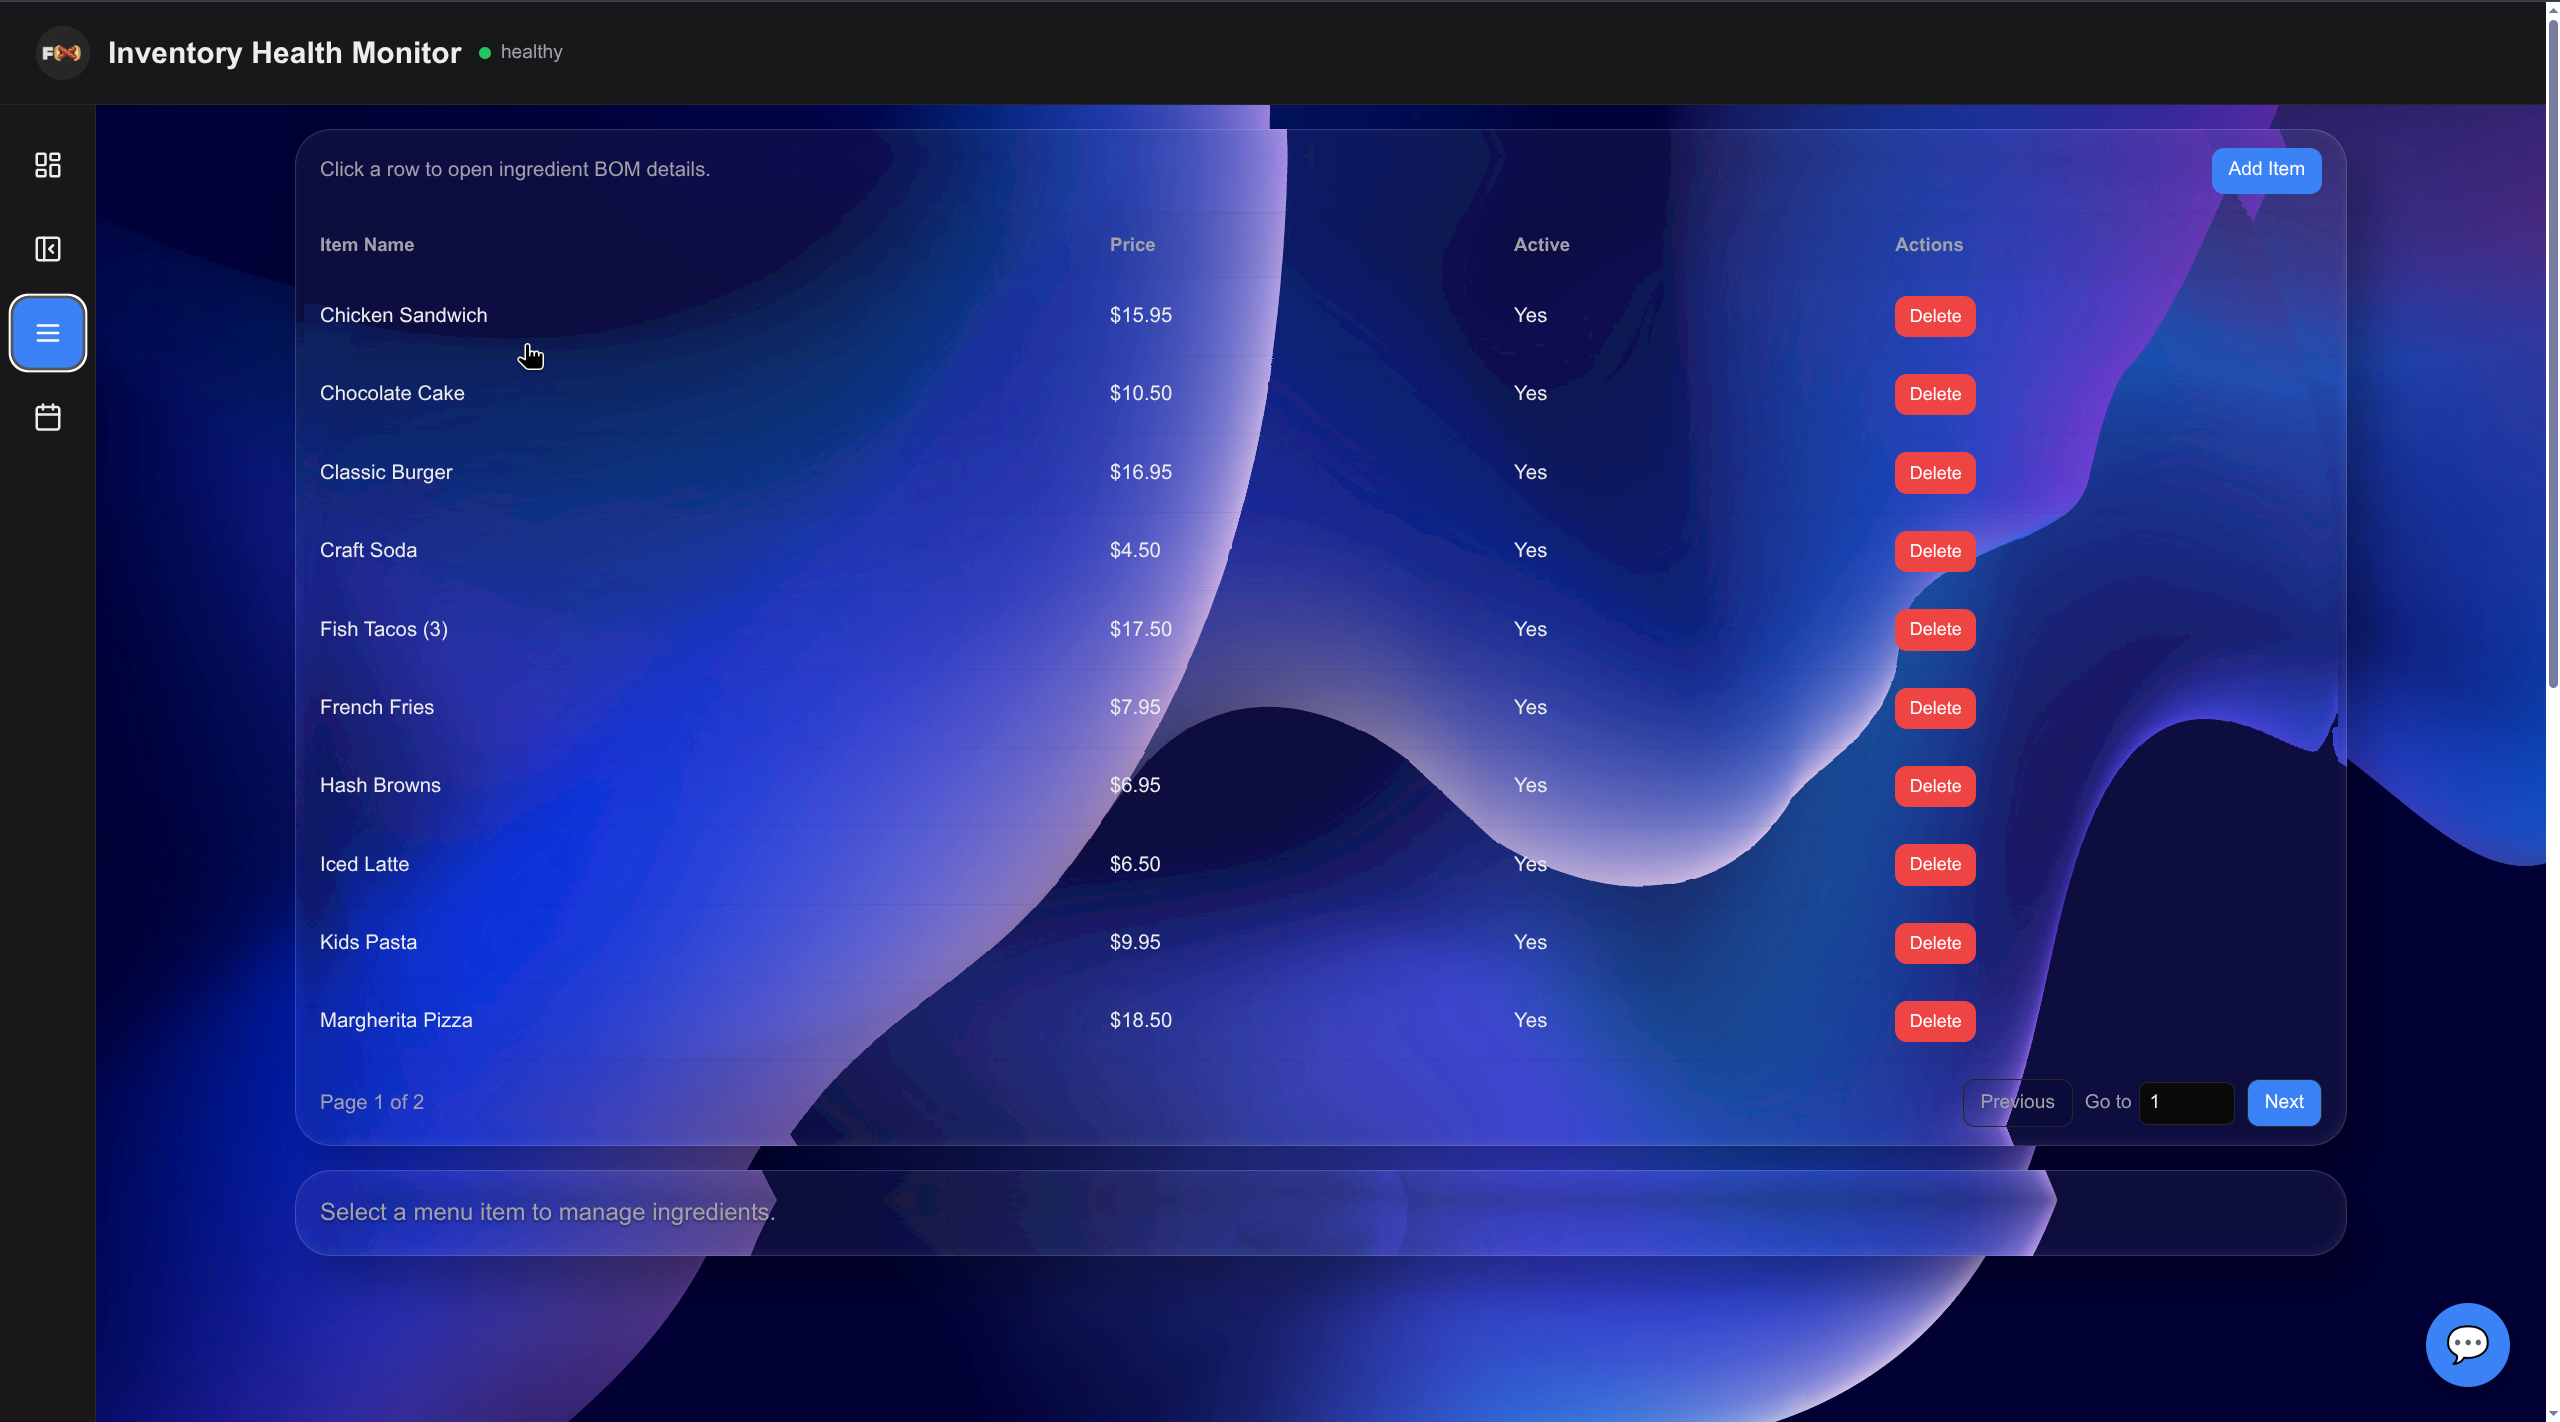
The menu item management table


Foodix
AI-Powered Restaurant Inventory Intelligence — Demand forecasting, natural language operations, and a modular glass-design dashboard, all in one platform.
Built at UGA Hacks 11 (2026).
Inspiration
Restaurant owners lose thousands of dollars every month to two invisible enemies: overstocking and stockouts. A head of lettuce that expires in the walk-in is money in the trash. A Friday night where you 86 your most popular entree is revenue you never get back.
We talked to restaurant operators and heard the same story over and over — they're managing inventory on gut feeling, Excel spreadsheets, or clunky legacy POS bolt-ons that weren't built for forecasting. The data is there, buried in daily logs and purchase orders, but nobody has the time or expertise to turn it into action.
We asked ourselves: what if a restaurant owner could just talk to their data? What if the system could look at three years of history and tell you — with 99.5% accuracy — exactly what to reorder and when? What if the dashboard felt less like enterprise software and more like something you actually wanted to open every morning?
That's Foodix.
What It Does
Foodix is a full-stack inventory intelligence platform for restaurants. It combines machine learning forecasting, a natural language operations assistant, and a customizable glass-design dashboard into a single system.
Demand Forecasting with XGBoost
At the core of Foodix is an XGBoost regression model trained on 50,000+ daily inventory records spanning 3 years. The model predicts daily ingredient consumption with an $R^2 = 0.9952$ (99.5% accuracy) by learning from:
$$\hat{y} = f\left(\text{inventory}{t}, \text{covers}{t}, \text{seasonality}, \text{dow}, \text{holiday}, \bar{u}{7}, \bar{u}{28}, \bar{u}_{56}\right)$$
Where $\bar{u}_{k}$ represents the $k$-day rolling average of daily usage. The model uses a Poisson regression objective with log1p target transformation, which is ideal for count-based consumption data that's always non-negative.
From these predictions, Foodix computes:
- Days until stockout: $\displaystyle d_{\text{stockout}} = \frac{\text{inventory_end} + \text{on_order}}{\hat{y}_{\text{daily}}}$
- Reorder point: $\text{ROP} = \hat{y}_{\text{lead_time}} + \text{safety_stock}$
- Suggested order quantity: $q^* = \text{target_level} - \text{current_stock} - \text{on_order}$
- Stockout probability scored from 0.0 to 1.0 based on current trajectory
The system is category-aware — produce (5-day shelf life), proteins (4-day), dairy (10-day), and dry goods (90–365 day) each get tuned safety stock multipliers. For newer ingredients with fewer than 90 days of history, a simple moving-average fallback kicks in automatically so nothing falls through the cracks.
Natural Language Operations (NL2SQL)
Instead of navigating menus or writing queries, restaurant staff just type or speak what they want:
"What are my top 5 most-used ingredients this month?" "Which items are expiring in the next 3 days?" "Show me inventory trends for chicken breast over the last 30 days."
Under the hood, Foodix runs a 4-stage NL2SQL pipeline:
- Intent Classification — Determines whether the user wants a read query or a write action
- Query Optimization — Claude rewrites vague natural language into a precise, scoped question
- SQL Generation — Qwen-2.5-Coder (32B), running locally via Ollama, generates a safe, read-only SQL query against the full database schema
- Result Explanation — Claude summarizes the raw database results back into plain-English business insights
Security is baked in: dangerous keywords (INSERT, UPDATE, DELETE, DROP) are blocked at the service layer, all queries run in read-only transactions, results are capped at 100 rows, and every query is automatically scoped to the authenticated restaurant.
Voice input is powered by the Web Speech API — tap the mic, ask your question, and get an answer in seconds.
Modular Dashboard with Glassmorphism UI
The frontend is a widget-based dashboard where every card is draggable, removable, and re-addable. Restaurant owners see exactly the information they care about:
| Widget | What It Shows |
|---|---|
| Stockout Predictions | Days until stockout per ingredient, color-coded by risk |
| Ingredient Inventory | Current quantities with real-time depletion timelines |
| Reorder Alerts | Items that need reordering, grouped by urgency |
| Usage Trends | Daily/weekly consumption charts (Recharts) |
| Top Movers | Highest-velocity ingredients |
| Expiring Batches | FIFO batch tracking with expiration countdowns |
| Menu Overview | Dishes and their bills of materials |
| Traffic Calendar | Historical and projected customer covers |
The UI is inspired by Apple's glassmorphism (Liquid Glass) design language. We built a custom LiquidGlassFilters component that generates SVG displacement maps and specular lighting from canvas-computed normal maps — creating a frosted-glass depth effect that responds to the content behind each card. Every dashboard card uses backdrop-filter composited with these SVG filters for a layered, translucent aesthetic.
Drag-and-drop is powered by @dnd-kit, so reordering your dashboard is as simple as grabbing a card and moving it.
How We Built It
Architecture
┌─────────────────────────────────────────────────────────┐
│                    Frontend (Next.js 16)                 │
│         React 19 · Tailwind 4 · Recharts · dnd-kit      │
│              Glassmorphism SVG + Canvas FX               │
└──────────────┬──────────────────────┬───────────────────┘
               │ REST                 │ Claude API
               ▼                     ▼
┌──────────────────────┐   ┌──────────────────────┐
│   Backend (Flask)    │   │    ML API (FastAPI)   │
│   22 endpoints       │   │    XGBoost model      │
│   NL2SQL pipeline    │   │    Prediction engine   │
│   Ollama (Qwen 32B)  │   │    :8001              │
│   :5000              │   └──────────────────────┘
└──────────┬───────────┘
           │
           ▼
┌──────────────────────┐
│     PostgreSQL       │
│  10 tables + views   │
│  3 years of data     │
└──────────────────────┘
Frontend
- Next.js 16 with the App Router and React 19
- TypeScript end-to-end for type safety
- Tailwind CSS 4 for utility-first styling
- Recharts for data visualizations (line charts, bar charts, area charts)
- @dnd-kit for drag-and-drop widget reordering
- Custom SVG + Canvas glassmorphism pipeline (
feDisplacementMap+feSpecularLighting+ screen blending) - Web Speech API integration for voice-to-text chat input
Backend
- Flask with blueprinted route organization (9 blueprints, 22 endpoints)
- PostgreSQL with connection pooling (
psycopg2SimpleConnectionPool) - Plain SQL migrations tracked in a
_migrationstable - Ollama integration for local LLM inference (Qwen-2.5-Coder 32B)
- Service-layer architecture separating routes, services, and data access
Machine Learning
- FastAPI serving the trained XGBoost model
- XGBoost with Poisson regression objective and log1p target transformation
- Trained on 50,000+ daily inventory records across 46 ingredients
- Feature engineering: rolling averages (7/28/56-day), seasonality factors, holiday indicators, day-of-week encoding, menu item cross-references
- ~45ms single-ingredient predictions, ~108ms bulk restaurant analysis
- Automatic fallback to simple moving-average for ingredients with < 90 days of history
Database
- PostgreSQL (local or Neon cloud)
- Normalized schema: restaurants, ingredients, daily inventory logs, predictions, batches, menu items, and bills of materials
- Materialized training views (
v_xgboost_training_set) that join 6 tables for ML feature extraction - FIFO batch tracking with expiration management
Accomplishments We're Proud Of
- 99.5% prediction accuracy ($R^2 = 0.9952$) — the XGBoost model genuinely works, and the category-aware safety stock system means predictions translate into actionable reorder recommendations
- The NL2SQL pipeline actually handles ambiguity — a user can say "what's running low?" and the system figures out they mean ingredients below reorder point, rewrites the question, generates correct SQL, and explains the results in plain English
- The glassmorphism is real, not a CSS hack — we wrote a physics-based normal map generator that computes sphere and superellipse surface normals on a canvas, feeds them into SVG displacement and specular lighting filters, and composites them with
backdrop-filter. It looks like Apple's Liquid Glass and it runs at 60fps - Voice input works seamlessly — tap the mic, ask a question about your inventory in natural language, get a structured answer back. It feels like the future
- The whole system is self-contained — PostgreSQL, Flask, FastAPI, Next.js, and Ollama all run locally. No cloud dependencies required for the full experience
What We Learned
- XGBoost with Poisson objectives is remarkably well-suited for inventory consumption modeling — the non-negative count-based nature of ingredient usage maps perfectly to Poisson regression, and log1p transformation handles the zero-inflated days cleanly
- NL2SQL is harder than it looks — the biggest challenge wasn't generating SQL, it was understanding intent. "What's running low?" vs "What did I use the most of?" require completely different queries. The 4-stage pipeline (classify → optimize → generate → explain) was the breakthrough
- SVG filters are underrated —
feDisplacementMapandfeSpecularLightingcan produce genuinely stunning visual effects when driven by programmatically generated normal maps. Most glassmorphism on the web is justbackdrop-filter: blur()— the SVG pipeline adds real depth - Ollama makes local LLMs practical — running Qwen-2.5-Coder 32B locally for SQL generation means zero API costs and full data privacy. The 32B parameter model generates surprisingly accurate SQL when given proper schema context
- Connection pooling matters immediately — even at hackathon scale, PostgreSQL connection overhead was noticeable until we added pooling. The jump from per-request connections to a SimpleConnectionPool was a measurable improvement
What's Next for Foodix
- Automated reordering — close the loop by integrating with supplier APIs (Sysco, US Foods) to auto-generate and submit purchase orders when the model flags a reorder
- Multi-restaurant support — the schema already supports multiple restaurants; the next step is a fleet-level dashboard with cross-location analytics and centralized purchasing
- Real-time POS integration — connect to Square, Toast, or Clover to ingest sales data in real-time instead of daily batch imports, enabling intra-day stockout alerts
- Menu engineering recommendations — use the ingredient cost and usage data to surface margin analysis: which dishes are profitable, which are losing money, and what menu changes would optimize food cost percentage
- Mobile app — a React Native companion for inventory counts, barcode scanning, and push notifications when items need reordering
- Model retraining pipeline — automated weekly retraining with drift detection, so the XGBoost model stays calibrated as seasonal patterns shift
Tech Stack
| Layer | Technology |
|---|---|
| Frontend | Next.js 16, React 19, TypeScript 5, Tailwind CSS 4, Recharts, @dnd-kit |
| Backend | Flask, psycopg2, Flask-CORS |
| ML/AI | FastAPI, XGBoost, scikit-learn, pandas, NumPy |
| NL2SQL | Ollama (Qwen-2.5-Coder 32B), Claude API |
| Database | PostgreSQL (local or Neon) |
| Voice | Web Speech API |
Team
Built at UGA Hacks 11 (2026).
Built With
- claude
- extreme-gradient-boosting
- flask
- llm
- natural-language-processing
- natural-language-to-structured-query-langauge
- next.js
- ollama
- postgresql
- python
- qwen-2.5
- vercel
- xg-boost


Log in or sign up for Devpost to join the conversation.