Inspiration
What it does
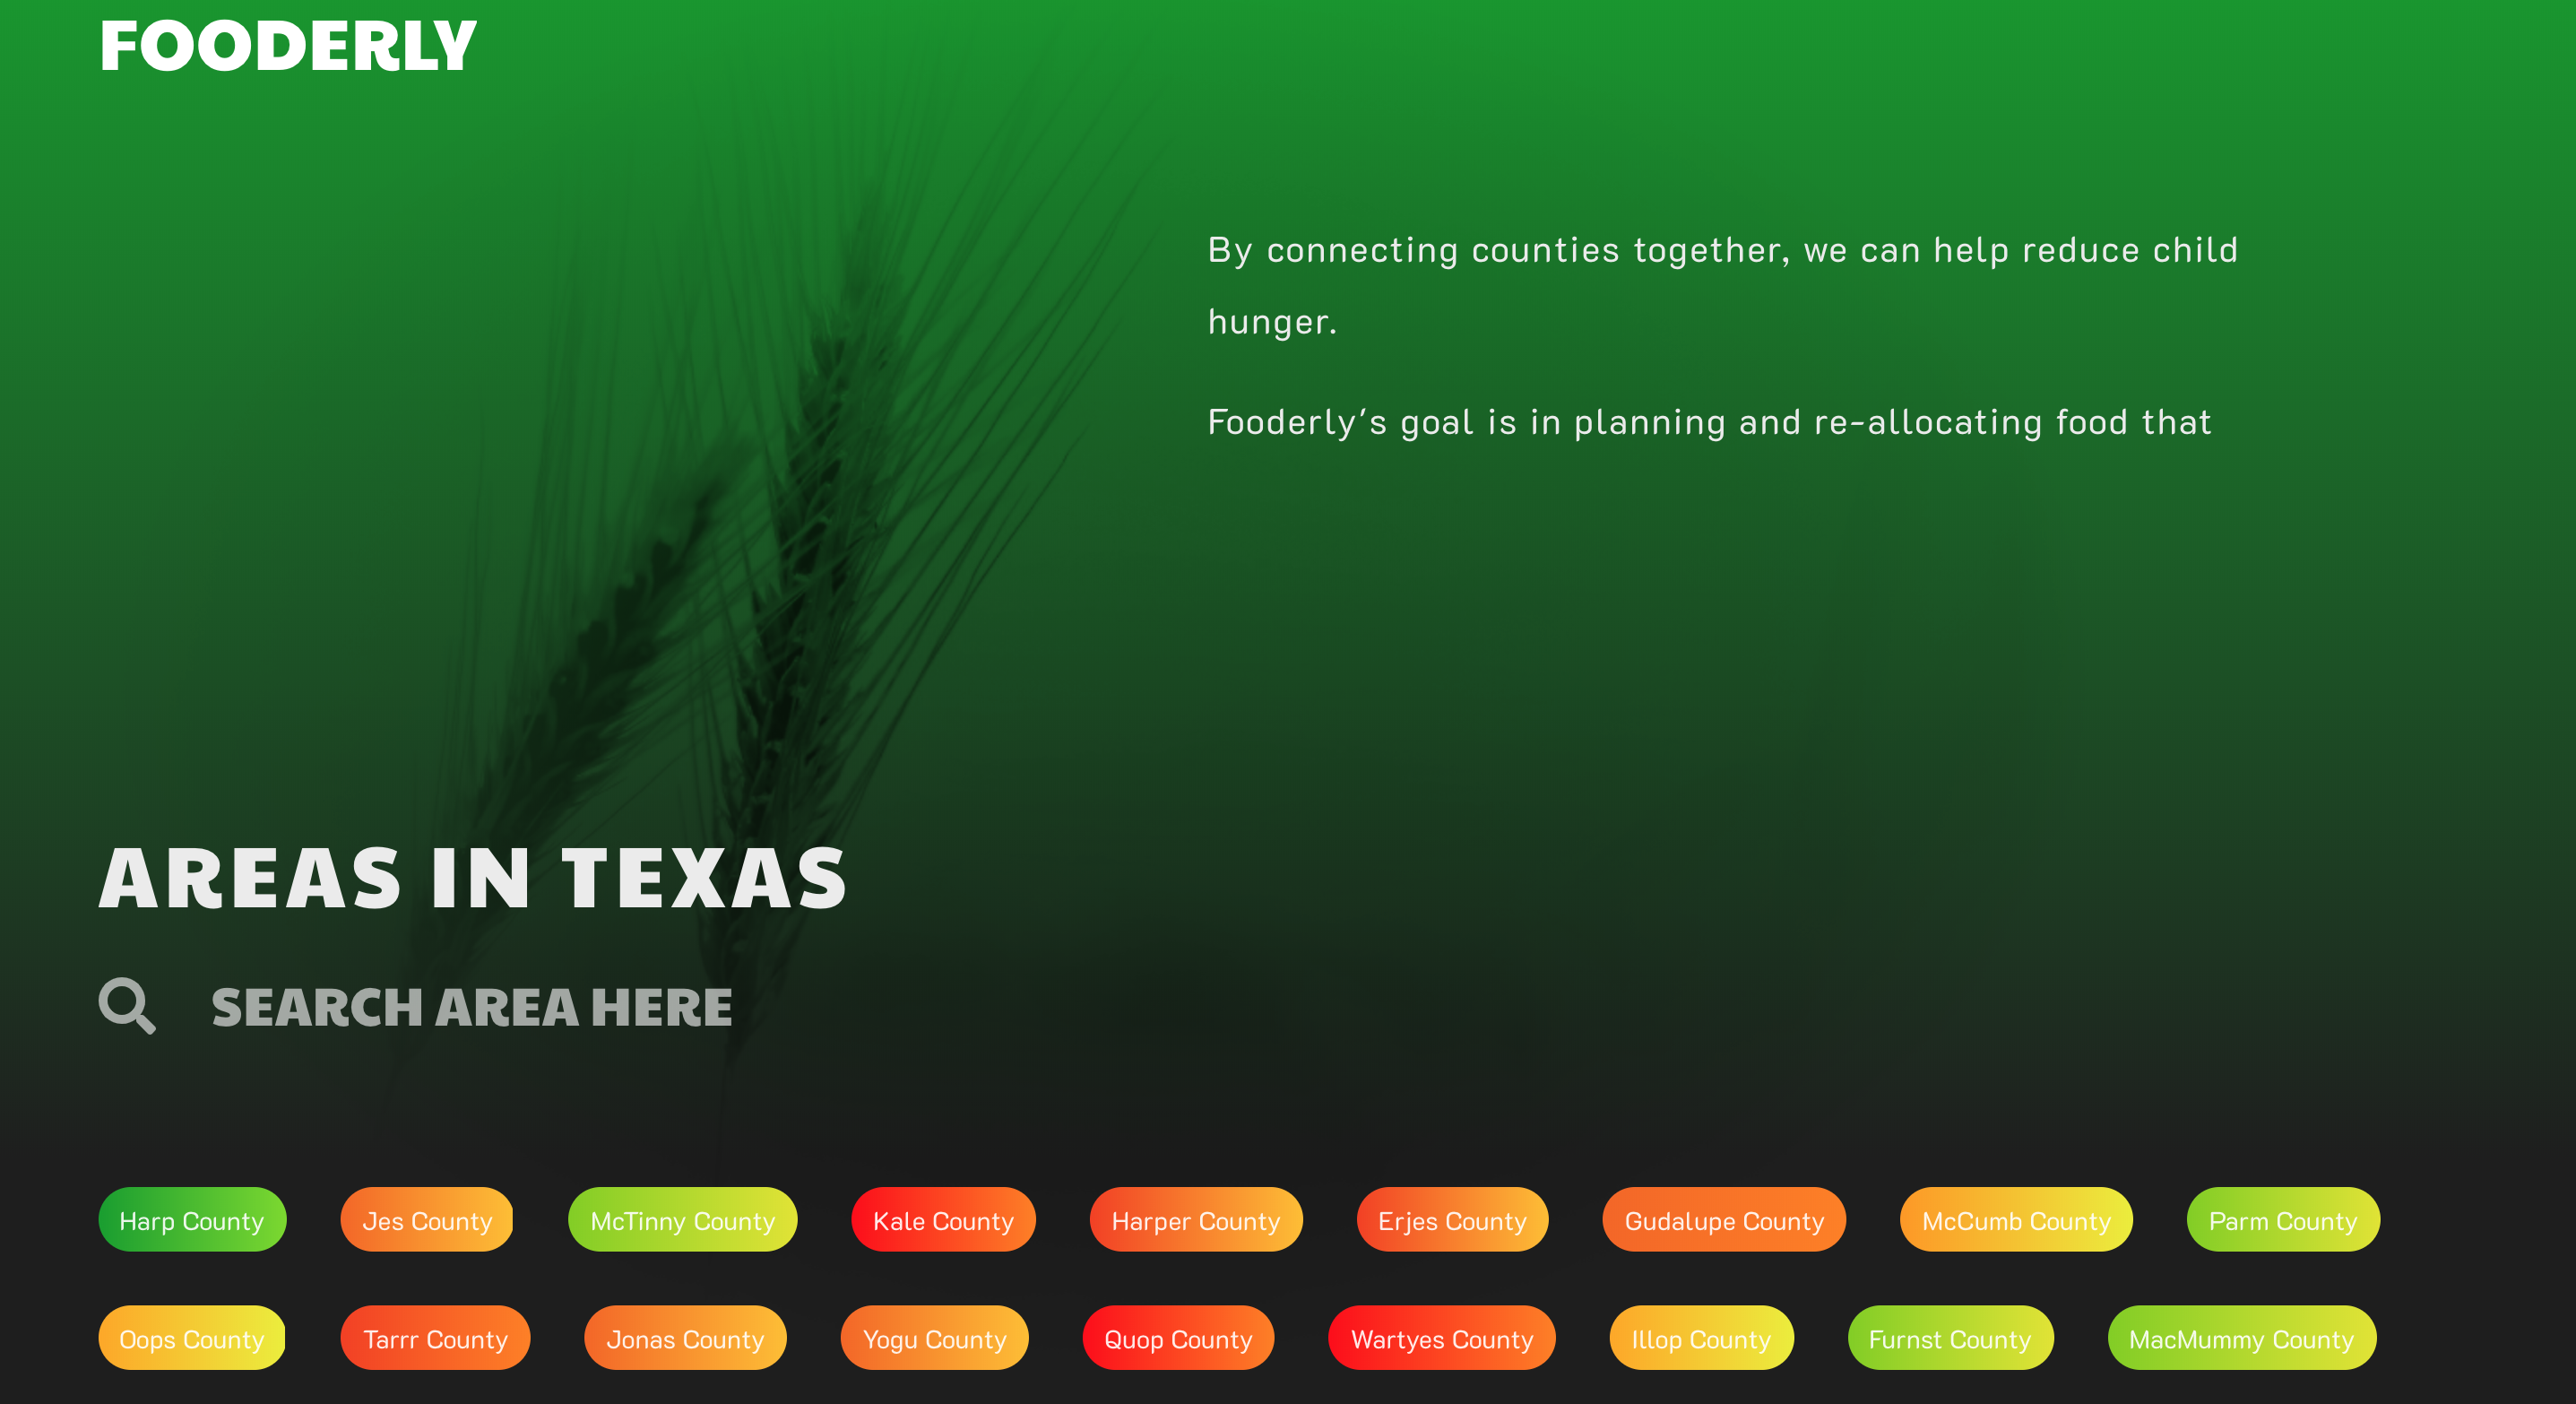
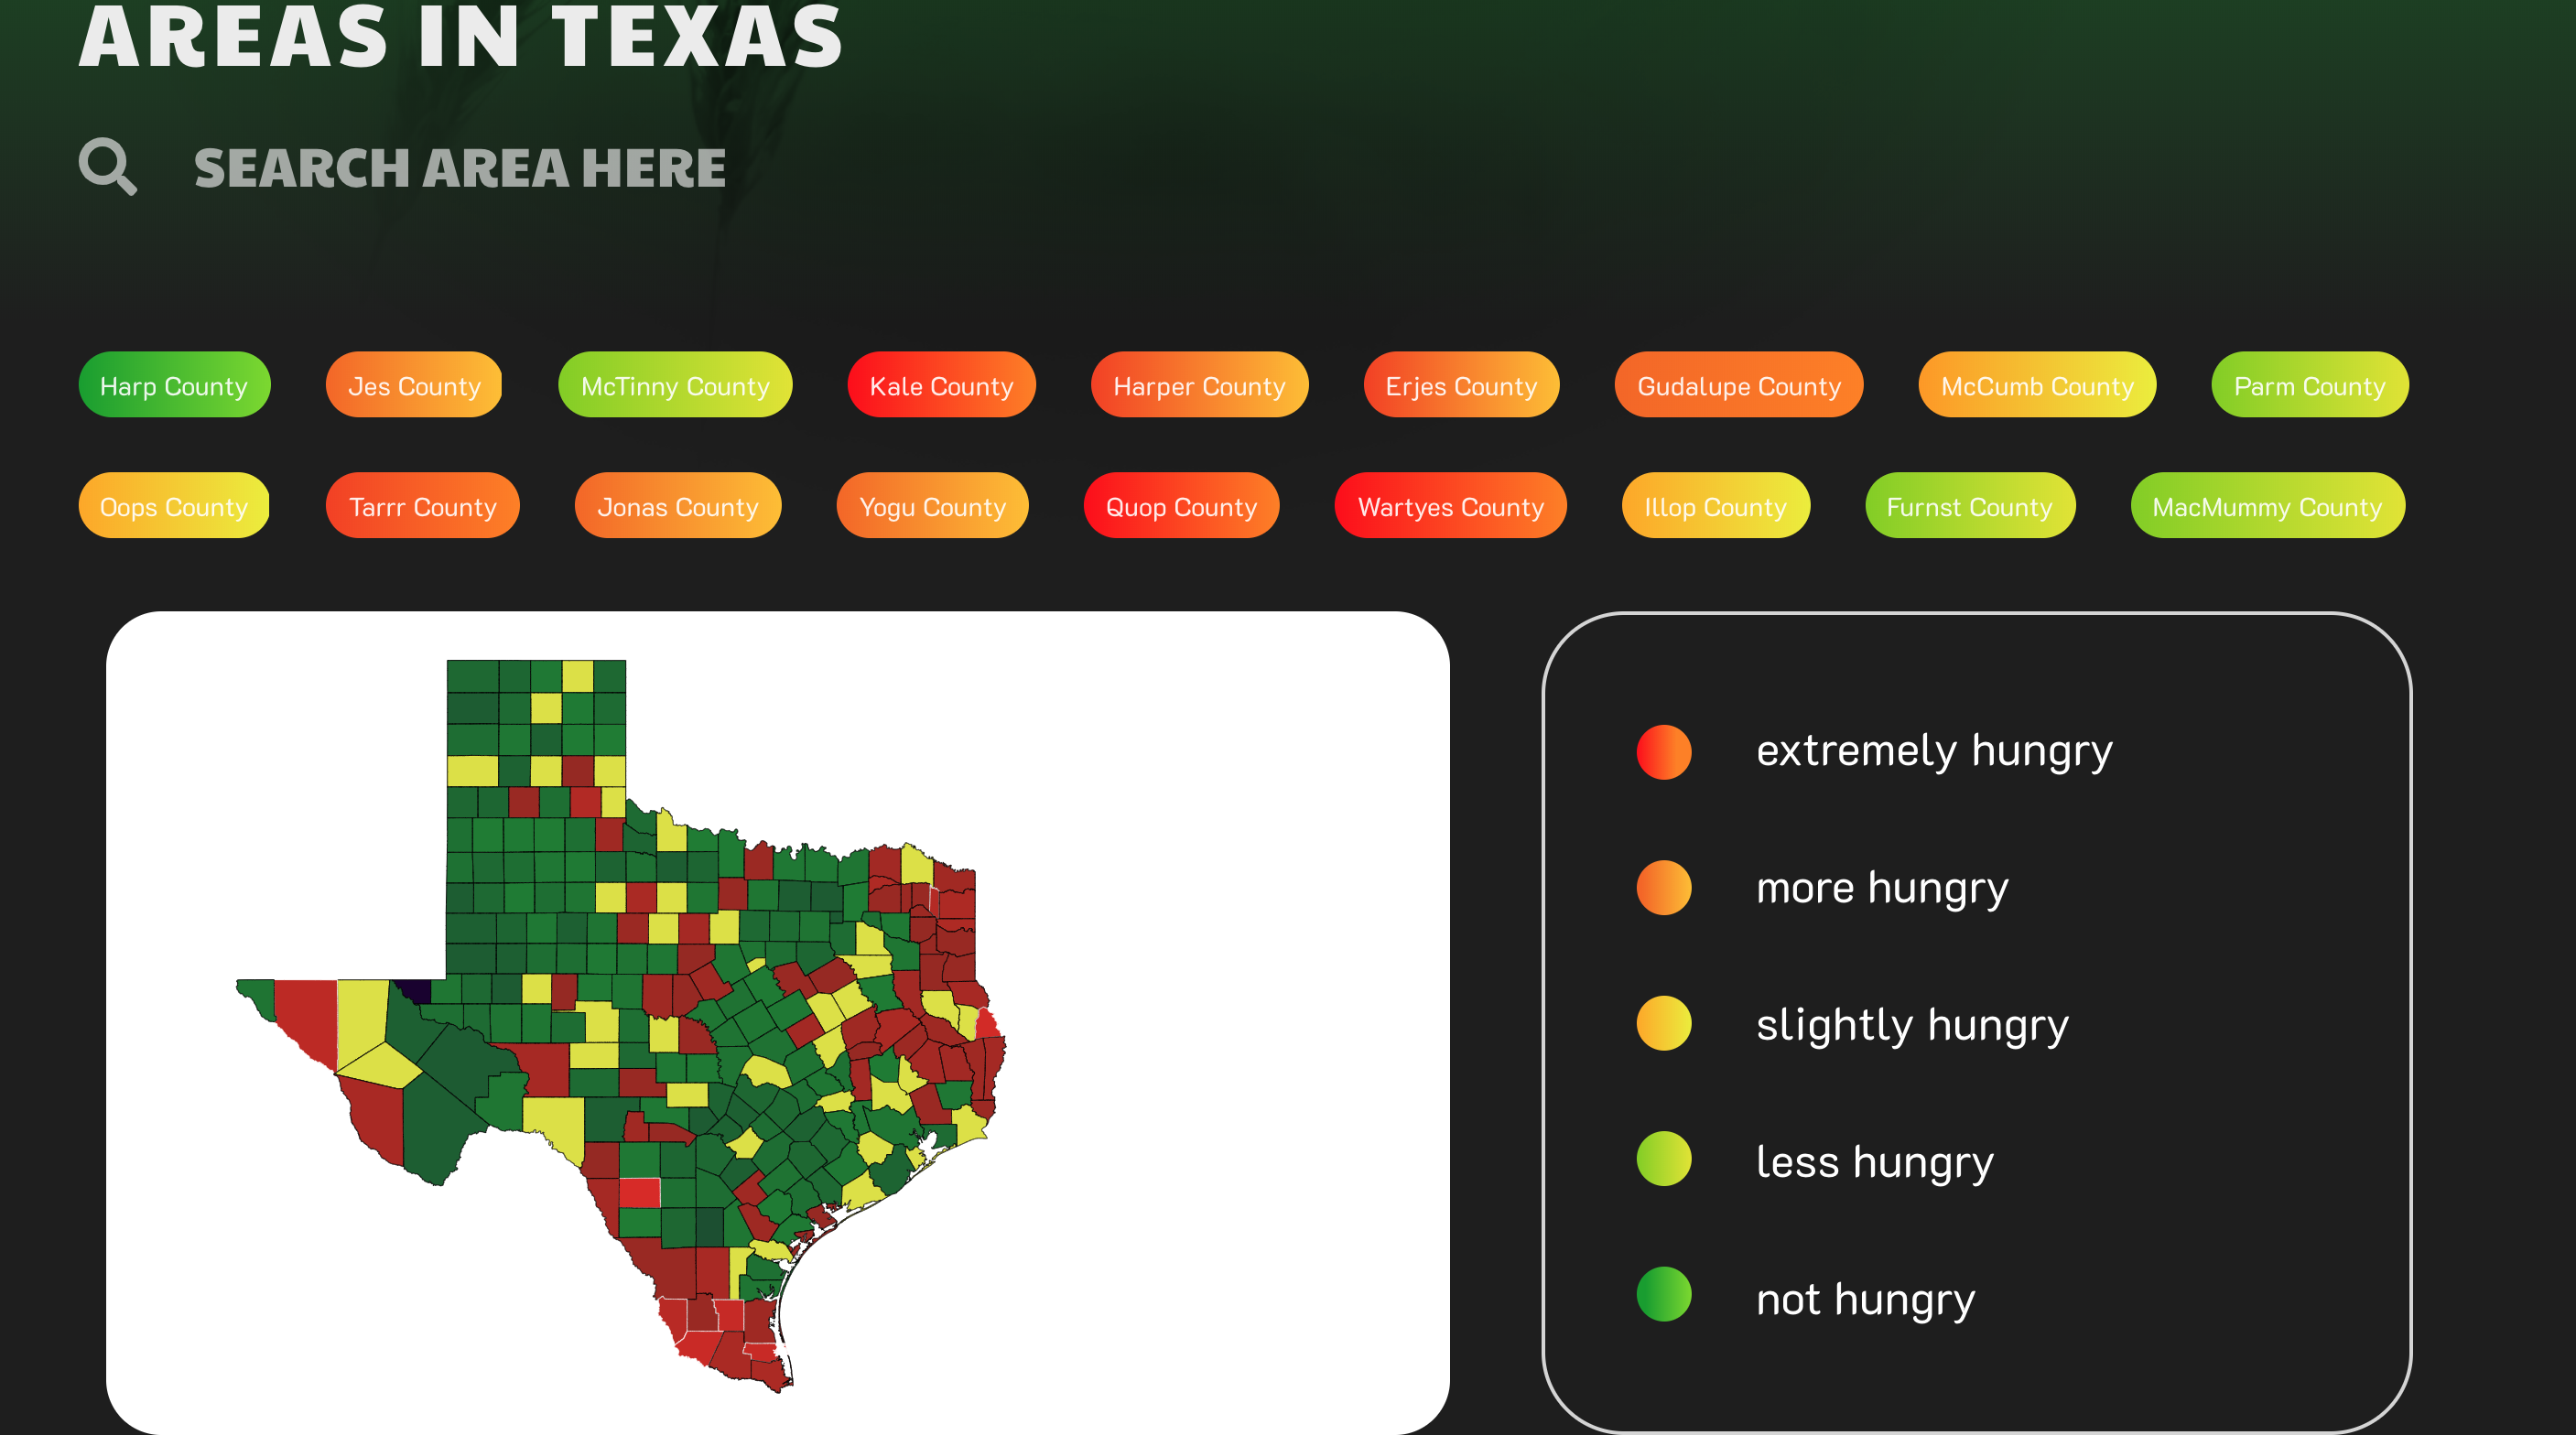
Fooderly creates an SVG map from a .topojson file while adjusting the color based on data from www.feedingamerica.org.
How we built it
We built it by designing a mock sketch with figma.
Challenges we ran into
One of our challenges we ran into was selecting the right library to display the data on a map. There were many libraries that we found, but many of them had a lot of features that we did not need. We decided on just using d3 to create an svg from a .topojson file.
Accomplishments that we're proud of
What we learned
We learned about topoJSON, react, and parsing data from a pdf with python!
What's next for Fooderly
We hope to add information for local grocery stores to use if they live in a low food insecure area to donate to near by counties in need.

Log in or sign up for Devpost to join the conversation.