

Inspiration
Currently, 30% of all food end up as food waste and 25% of areas are considered food deserts throughout the United States. To combat this problem, we decided to create Food Oasis. Food Oasis finds connections between existing farms (and other pre-retail food production centers) to biofuel facilities and food pantries within county limits. The short distance between the farms, energy facilities, & food pantries incentivizes farmers to give back their surplus to their communities.
What it does
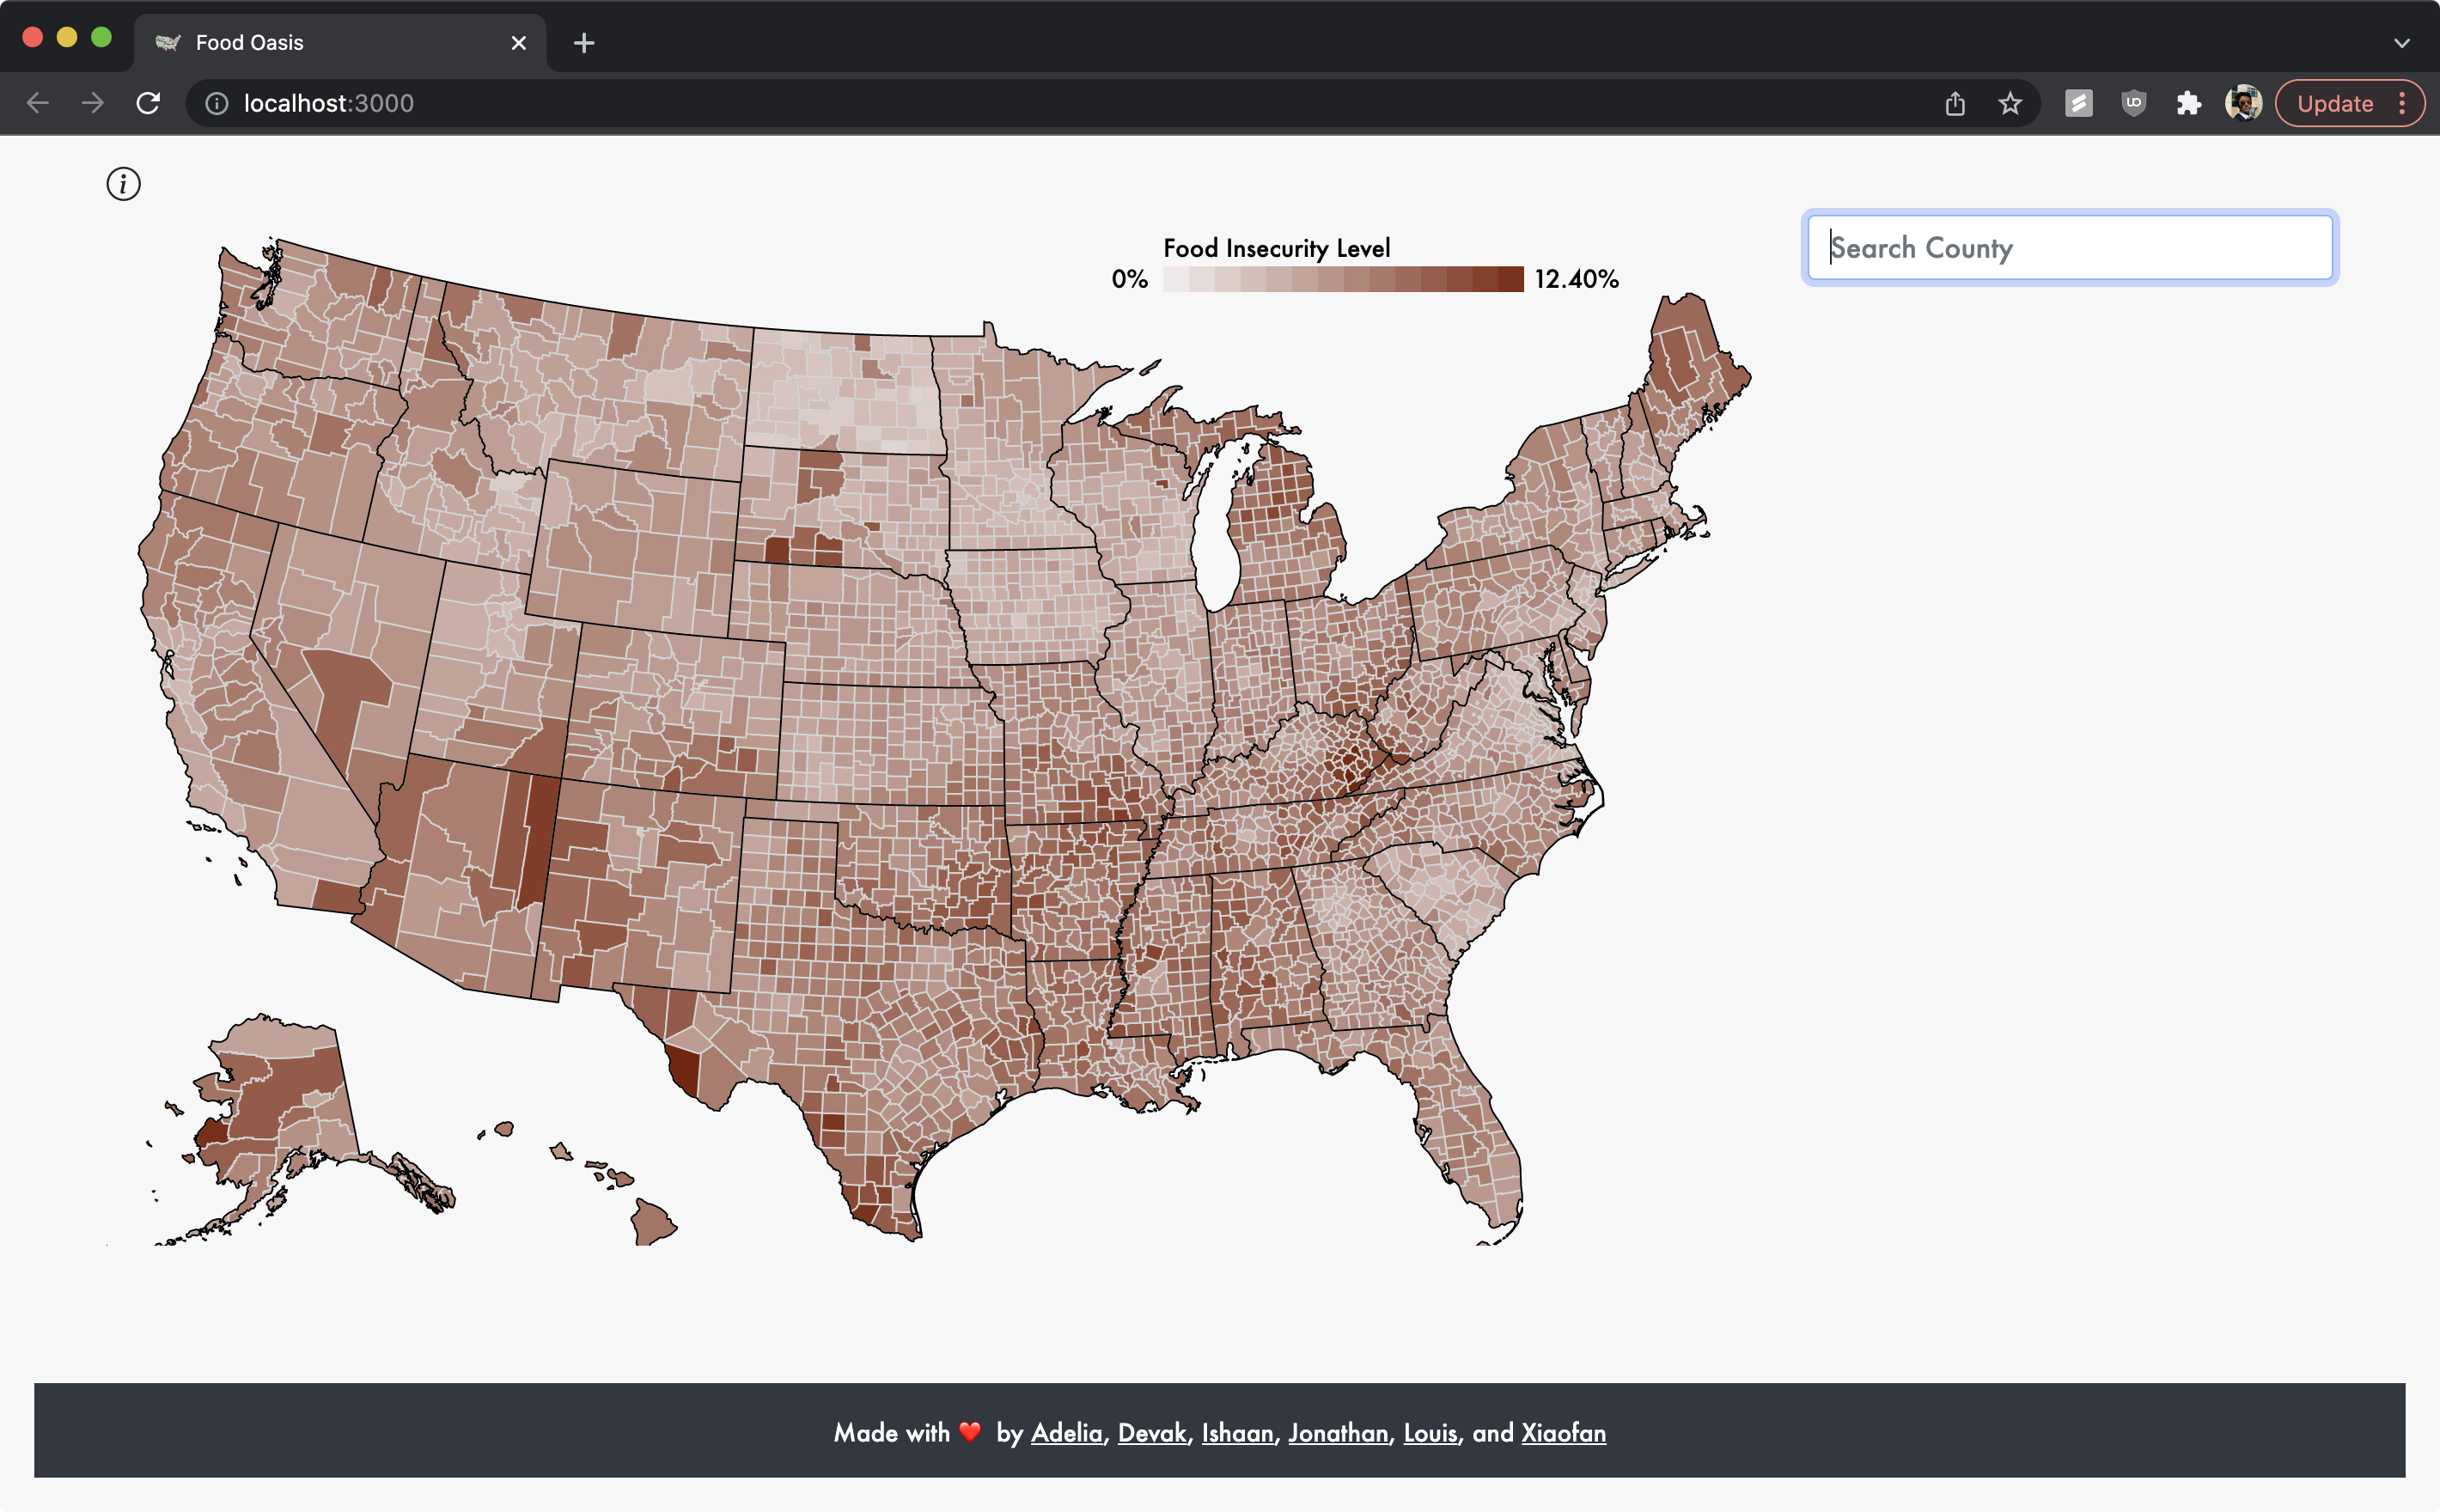
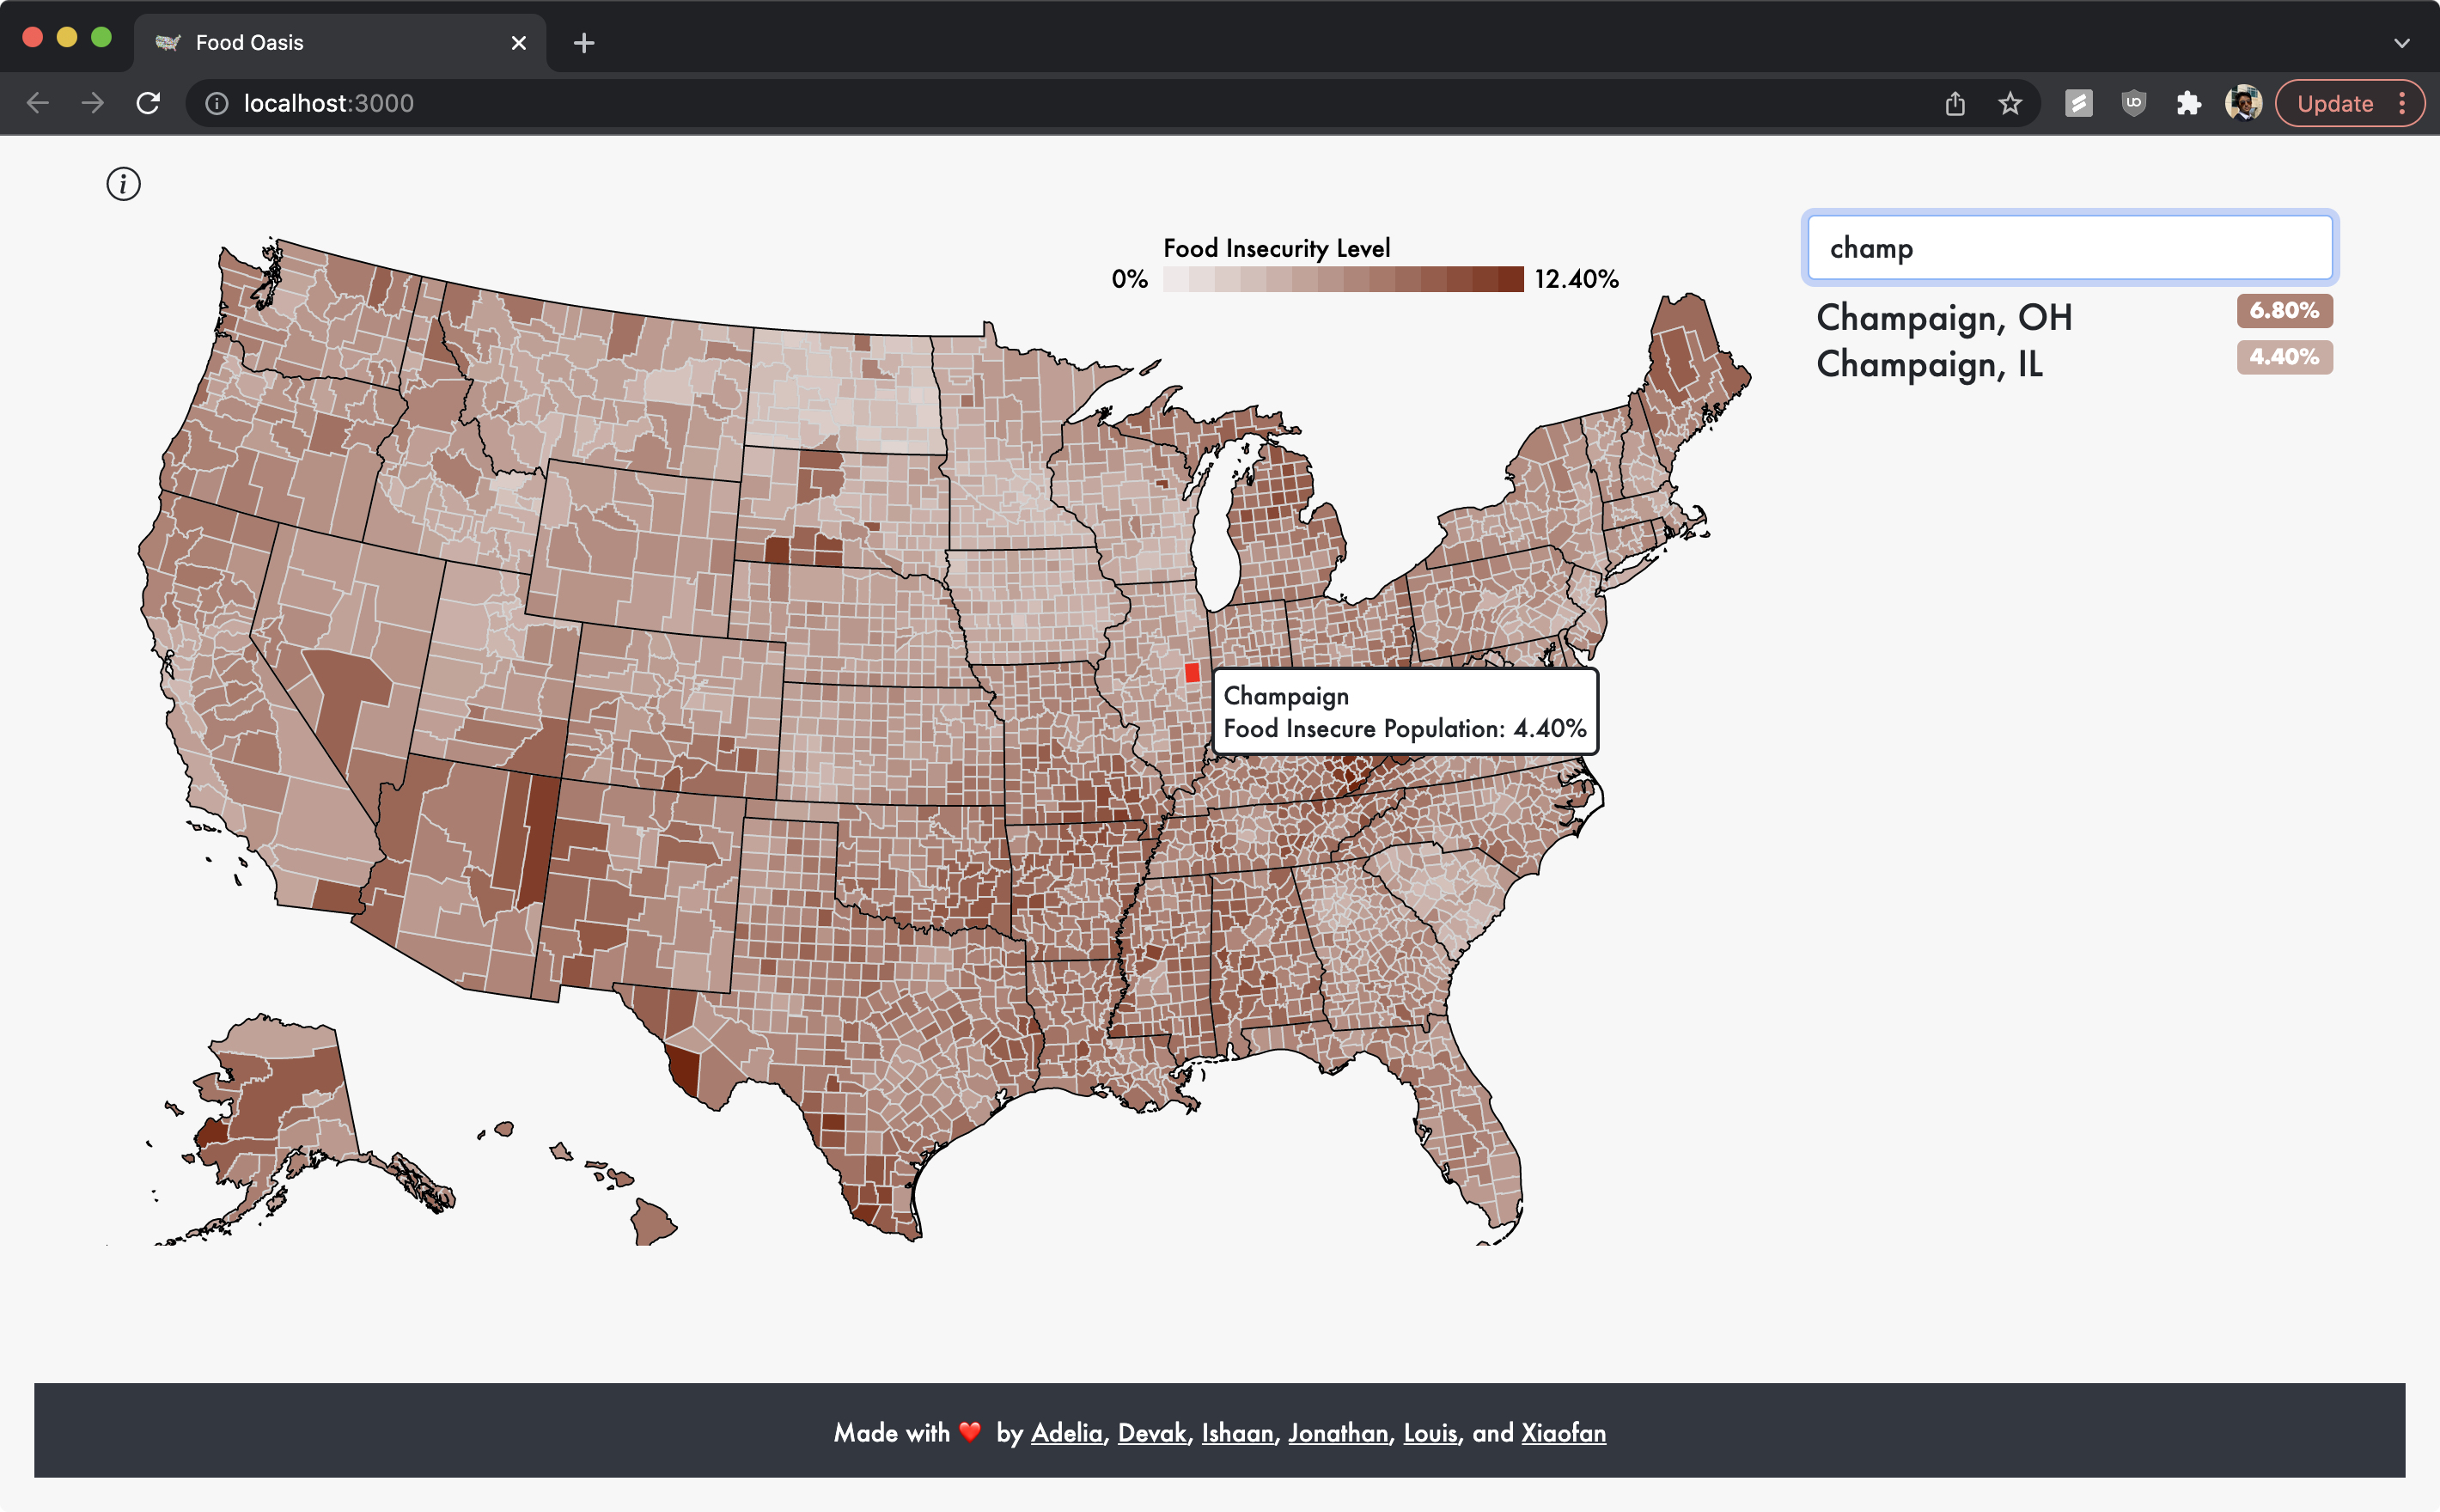
Our solution is an interactive heat-map of every US county, with a darker color indicating a higher per capita percentage of people that are labelled as "Very Low Food Secure." From there a user can select a county from the map, or search for it on the right, and look at short-distance paths from food production facilities to food-insecure locations. The idea is that the data and the routes are available for organizations that can use the data, like local or state governments, food production companies, local food pantries and food activists, and shipping companies.
How we built it
First we found datasets on the internet then used pandas and python to process that information into meaningful and easy to use data. After that, we created the interactable map using D3.js, and from there, connected the aforementioned data to fill in the data for the heat map. Then we used Google Maps API to create the county information graphic, which grabs a picture of the county and draws the routes from production centers in the county that generated a food surplus to food pantries and biofuel centers within the county. The data for how much surplus was generated, as well as the distance between the two centers are accounted for when the routes are drawn in the JavaScript. Finally the website was polished up by making it into a React web app and adding in some nice looking css.
Challenges we ran into
- Using the Google Maps API in an efficient way
- matching County Names to their unique FIPS codes
- finding the right data sets for our solution
Accomplishments that we're proud of
- the heat map of US counties and their level of food insecurity
- CSS animations on the start page
- creating relational datasets in pandas
- the search feature for the counties
- generating the graphic with the picture of the county and the routes
What we learned
We learned how to use React and make smart API calls from a large API service (Google). Processing and combining geographic and demographic data to gather meaningful results.
What's next for Food Oasis
We plan to transport blemished and decomposing goods by working with third-party shipping companies. By asking them to make a "pit stop" to transport the goods along their already established route on trucks that have extra space, in trade they can receive tax credits or a financial benefit.


Log in or sign up for Devpost to join the conversation.