-
-
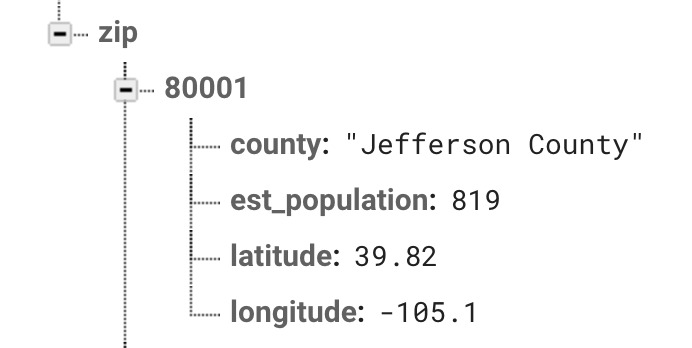
RTDB data for zip codes
-

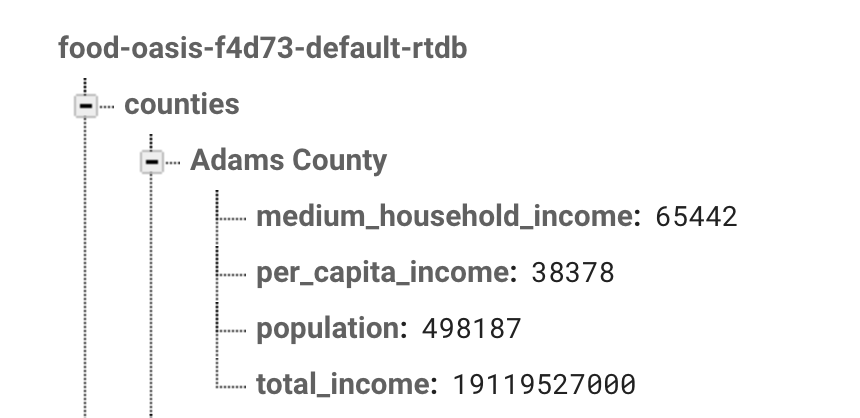
RTDB data for counties
-
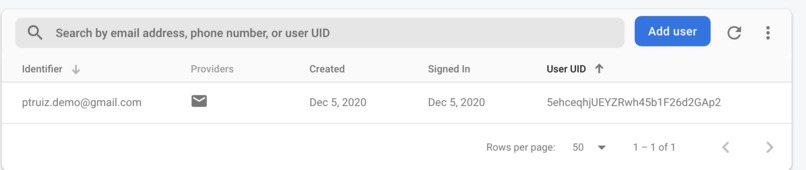
Auth user
-

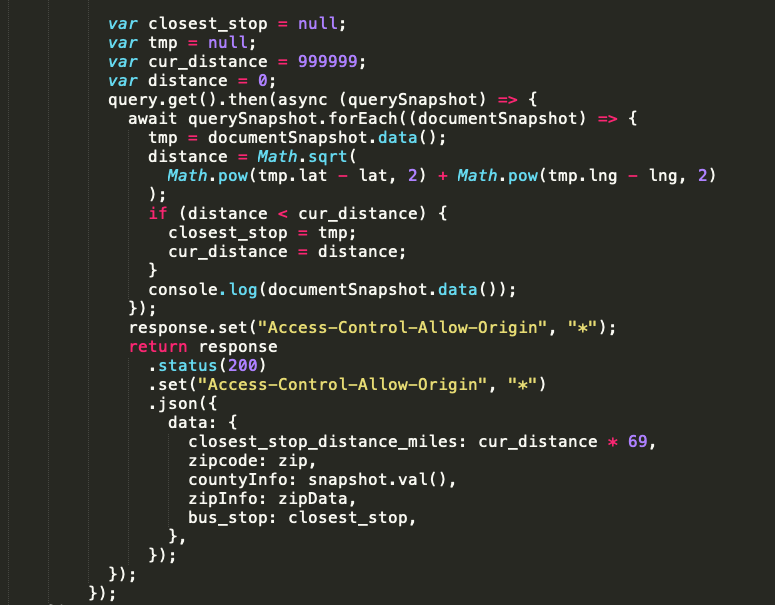
Snippet from the Firebase Functions backend
-
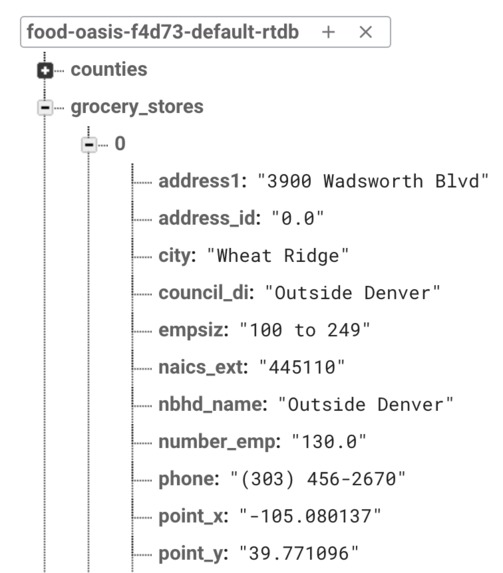
RTDB data for grocery stores
-
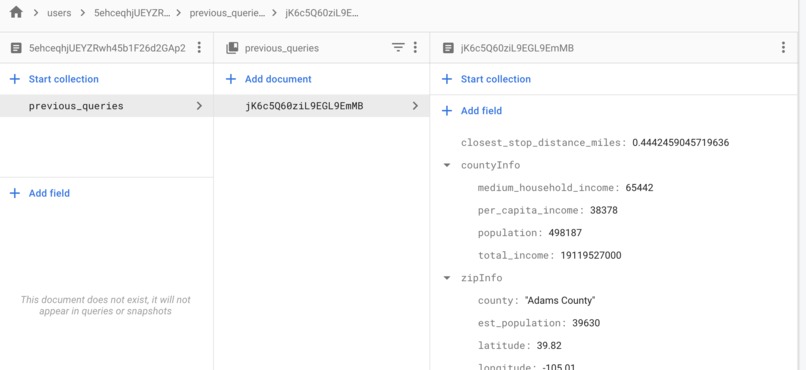
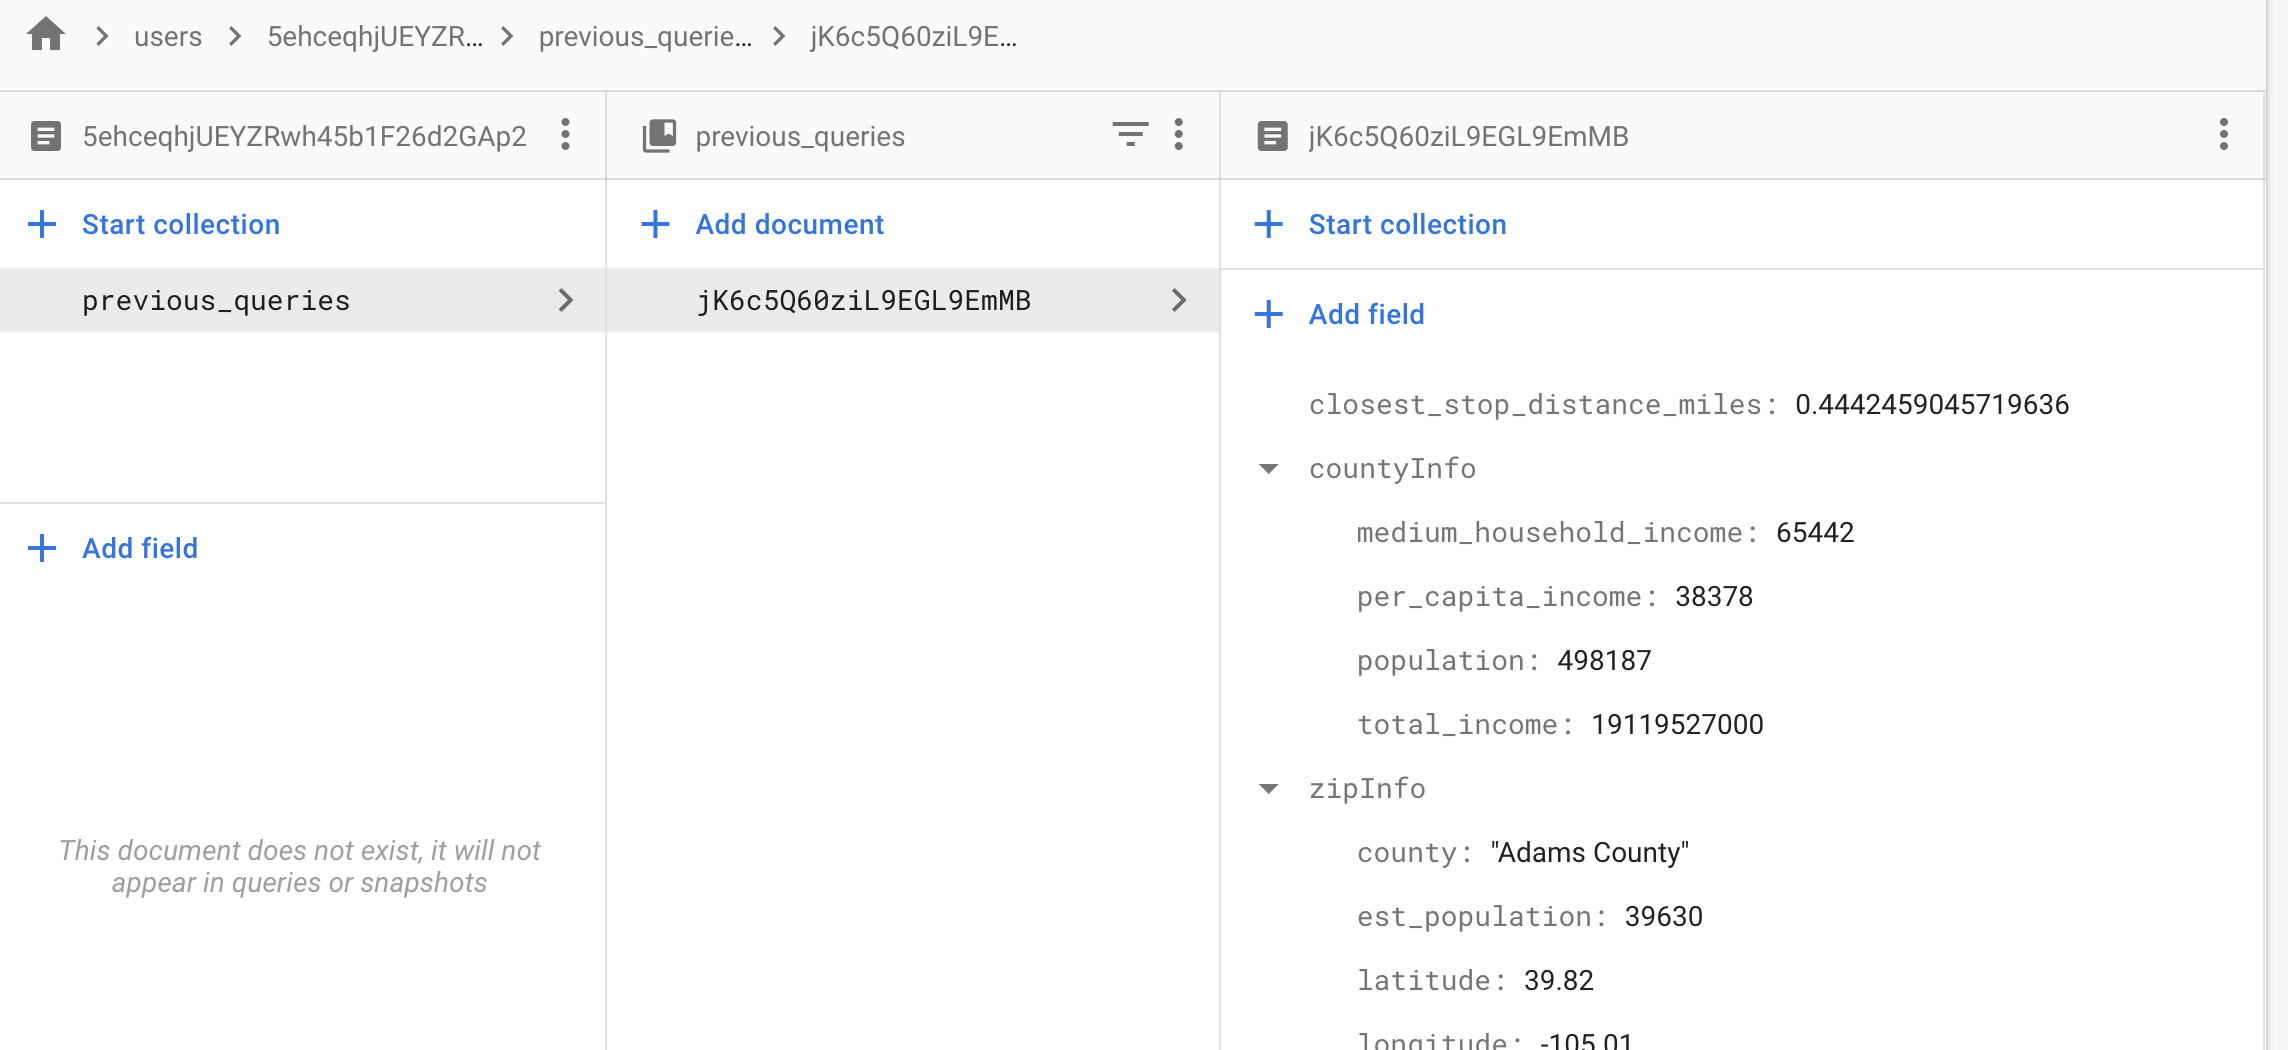
Firestore data for past user queries
-

Firestore data for bus stops around Denver
-
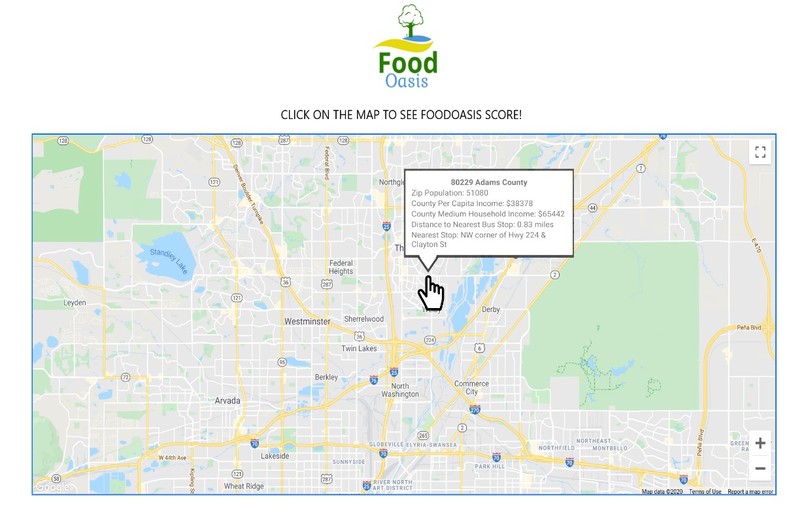
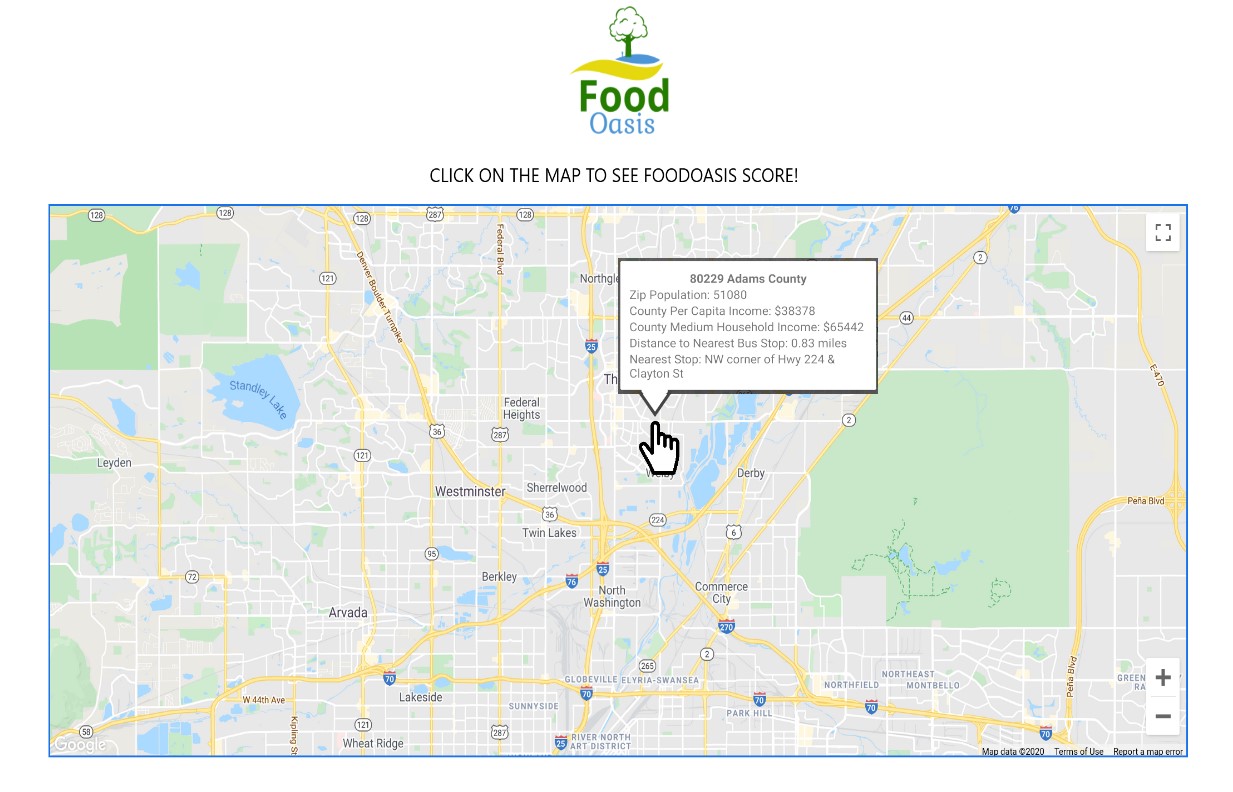
Web client
-

Returned data sample
-
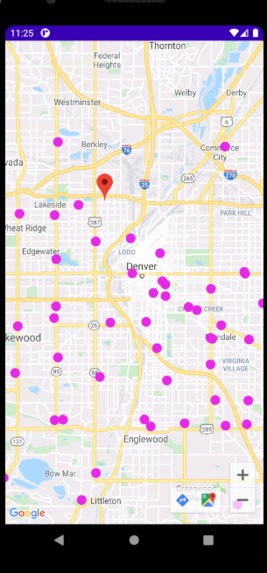
Markers for each regular grocery store in the Denver area
-
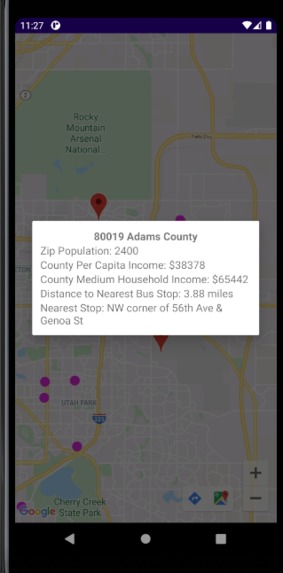
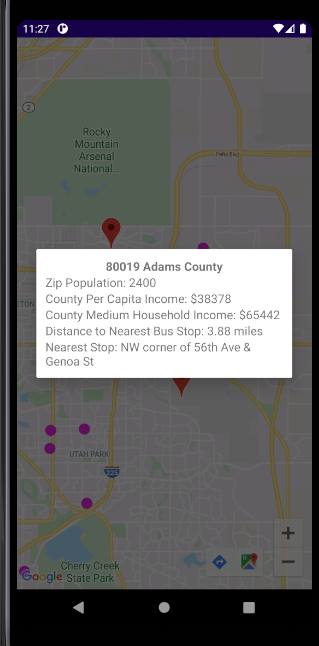
Data display for location in Android
-
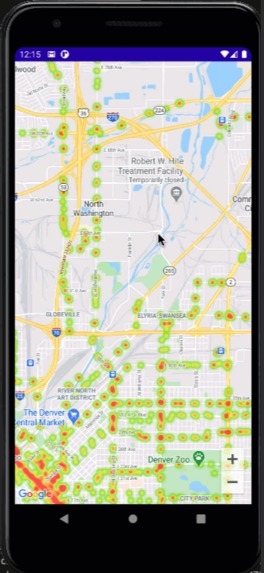
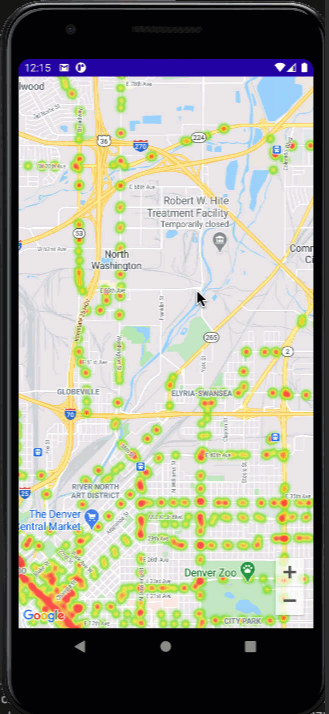
Heat map data display in Android


IMPORTANT NOTE FOR JUDGES
The video is already sped up to fit the 3 minute rules limit. I know judging usually involves playing the video back at an increased speed - please don't do that - I already speak quickly normally :)
Track
We are submitting for the Inequality Track
Charity Donation
If we win a prize, we will be donating to Almost Home Cat Adoptions in Westminster, Colorado. This summer I adopted a three-legged black kitten from them, and they've been hit pretty hard financially by the pandemic. My work would also provide a 100% contribution match, giving it more impact.
Inspiration
This project was inspired by my own experiences. I grew up in a single family home in an area classified as a food desert without a car, and it would take multiple hours to get to the grocery store through walking and the bus. This meant we ended up eating a lot of cheap junk food from the gas station or fast food, rather than more healthy options, as well as spent more money that we didn't have because of the distance to the store and my mom not having the time to actually go because of working multiple jobs. For this project I wanted to come up with a practical way to work towards solving this problem.
What it does
This project uses large amounts of data to allow entrepreneurs to analyze areas and find food deserts for potential new grocery stores. The app shows population data, income levels, bus routes and stops for easy access, and current grocery stores, and allows users to dive into this data for specific locations. The app could also aggregates this data to form a rating (0.0 - 1.0) for how likely a store would be profitable (and therefore stay open - useful stores opening and then closing a few months later is a constant in poor areas), how much social impact it would have, and if it would be eligible for a fiscal incentive for being built in a food desert.
How we built it
This project is broken into three main categories
Data: This app uses multiple data sources from government entities that needed to be organized, sanitized, and parsed using custom scripts and Excel to be placed in our Firebase backend. We used the Firebase Realtime Database to store the derived zipcode-population information and county information, then Google Firestore to store bus stop and route data so it's queryable, as well as previous queries for authenticated users.
Functions Endpoints/Backend: We created multiple functions that can accept a latitude/longitude pair, query our databases to aggregate location/population data, and then return that data to our apps. These functions also finds the nearest bus stop to a point, and accurately provides distance using non-euclidean geometry to account for the curve of the Earth. These functions are able to use an external API to reverse geocode our coordinates to get a zip code for matching our data. Finally, our backend can provide a score for a given location to help illustrate how beneficial a grocery store would be for both the public and the owner.
Apps: In order to use all of this data, we put together apps that can access our endpoints and visualize it in multiple ways, including markers, data displays, and heat maps, for our users.
Challenges we ran into
We weren't able to find anyone who could write an algorithm based on provided math in order to do preemptive predicting for the users, but this means we have the potential to add this later for a greater impact.
The government data was all very messy, so I had to spend a lot of time collecting it, sanitizing and parsing it, and getting it loaded into our Firebase backend for easy access. I also had to spend some time figuring out how to correlate everything together so we could tie all of our data together using just the original input of a single latitude/longitude pairing (which is a way more difficult real-world problem than it might seem).
We also had issues with CORS security issues early on so I had to rewrite how some of our functions worked to get our web app using the same backend as the mobile app.
Firebase Firestore doesn't support multiple inequality queries (i.e. 1 < x && x < 2 ), so I had to restructure my Firestore database and accessing algorithms for memoization and other efficiency techniques
Accomplishments that we're proud of
Actually getting our data into a usable state
Having an idea that can work as both a community good project, and be pivoted into a profitable product that would then support the community good portions
Getting weighted heat maps working
The the math behind distance calculations and restructuring our data for complex queries
Getting something useful built in ~24 hours without a data science team member for the more interesting features that I want to include in this project.
What we learned
How to structure Firebase Functions for use across projects without a Firebase SDK
How to structure data for Firestore to perform complex queries
How promises/threading works in NodeJS (I'm a mobile developer, so all of the web stuff was pretty new for me)
What's next for Food Oasis
Improving the backend logic to predict locations for potential store owners
Adding improved data visualization tools
Connecting food desert incentives to entrepreneurs
Looking into other avenues for the data solution that could fund the community improvement features. This is an important part of the business plan going forward so it can actually gain traction.
Tech Used
- Google Auth
- Google Firestore
- Firebase Realtime Database
- Firebase Functions
- MapQuest Location API
- Android
- Google Maps
- Google Analytics
- GSON
- Google Maps Utils - custom markers and heat maps
- Python, JavaScript (node), Kotlin, Java
Data Sources Used
- RTD Bus Stops
- Census Populations
- Colorado Median Household Income
- Colorado Per Capita Income
- County Info + Zip Code Pairing
- Zip Code to Populations
- Grocery Store Locations
- ZCTA to Zip mapping data set
- Department of Ag datasets
Using the app
Source code is in this directory for the Android app. APK can be provided on request via Firebase App Distribution.

Log in or sign up for Devpost to join the conversation.