-

Original design: logo
-
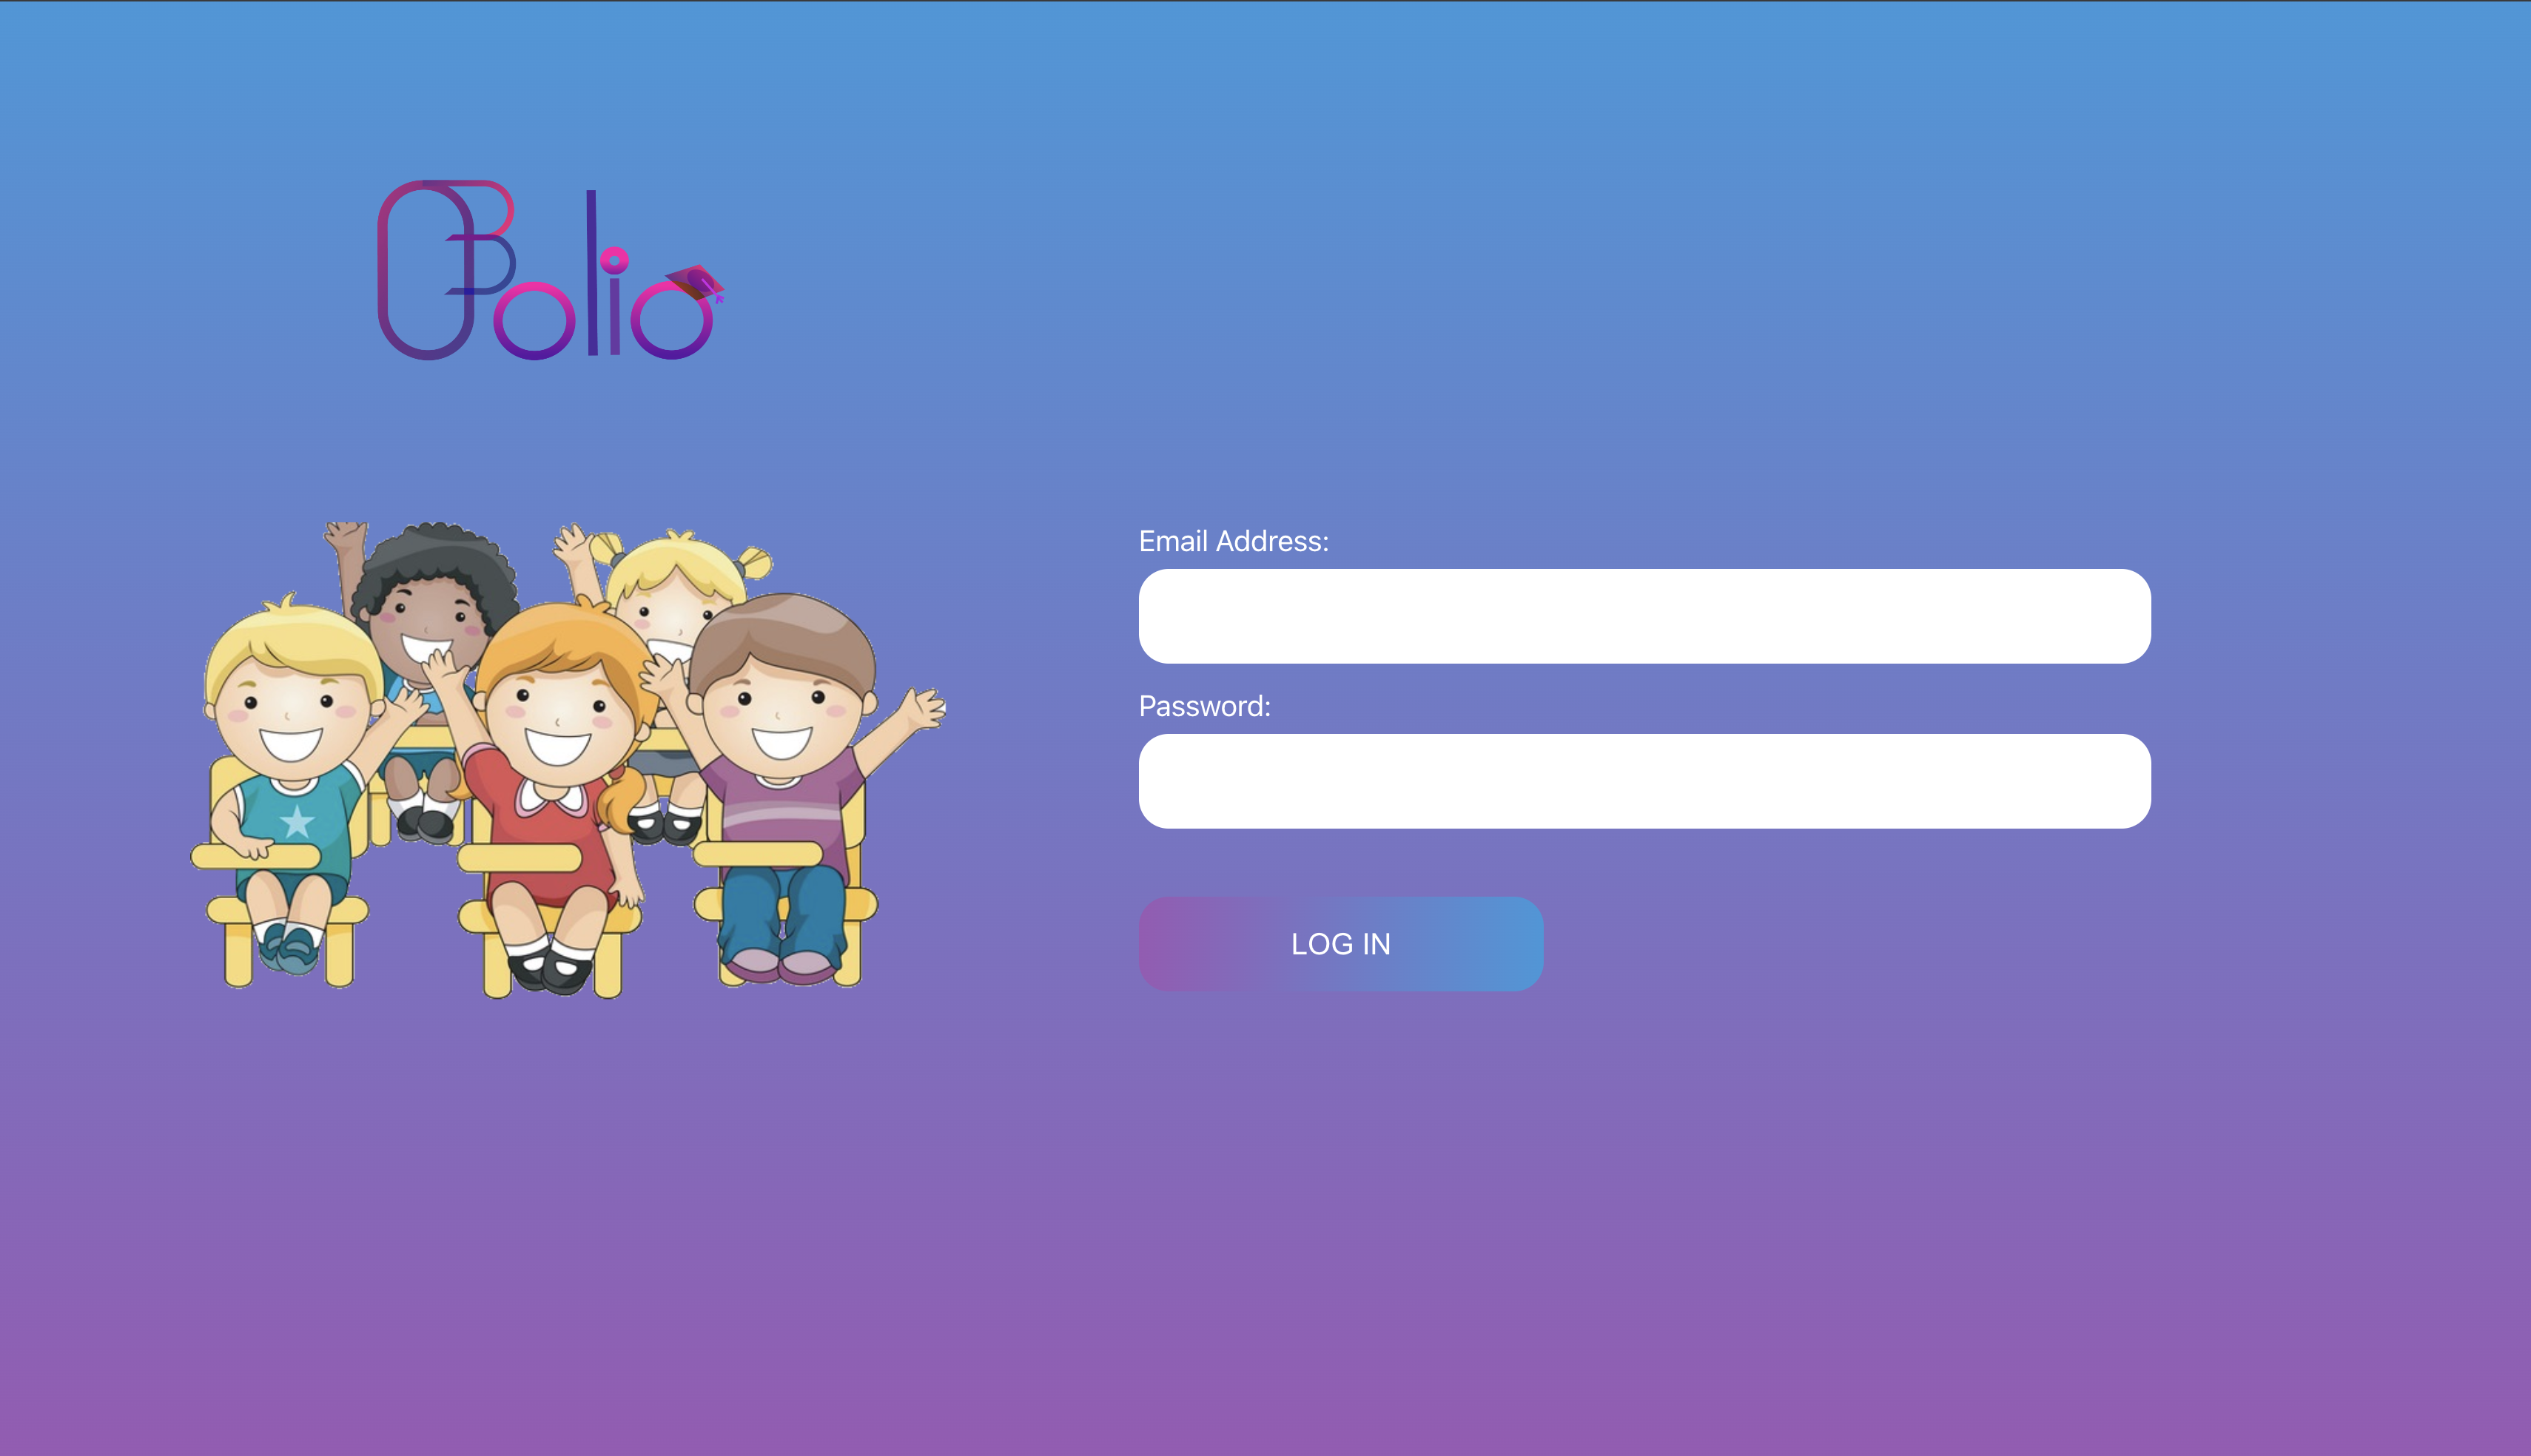
Original design: login portal
-
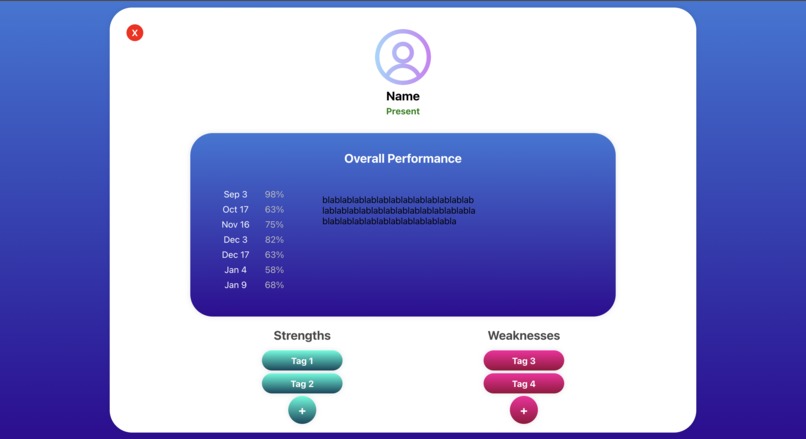
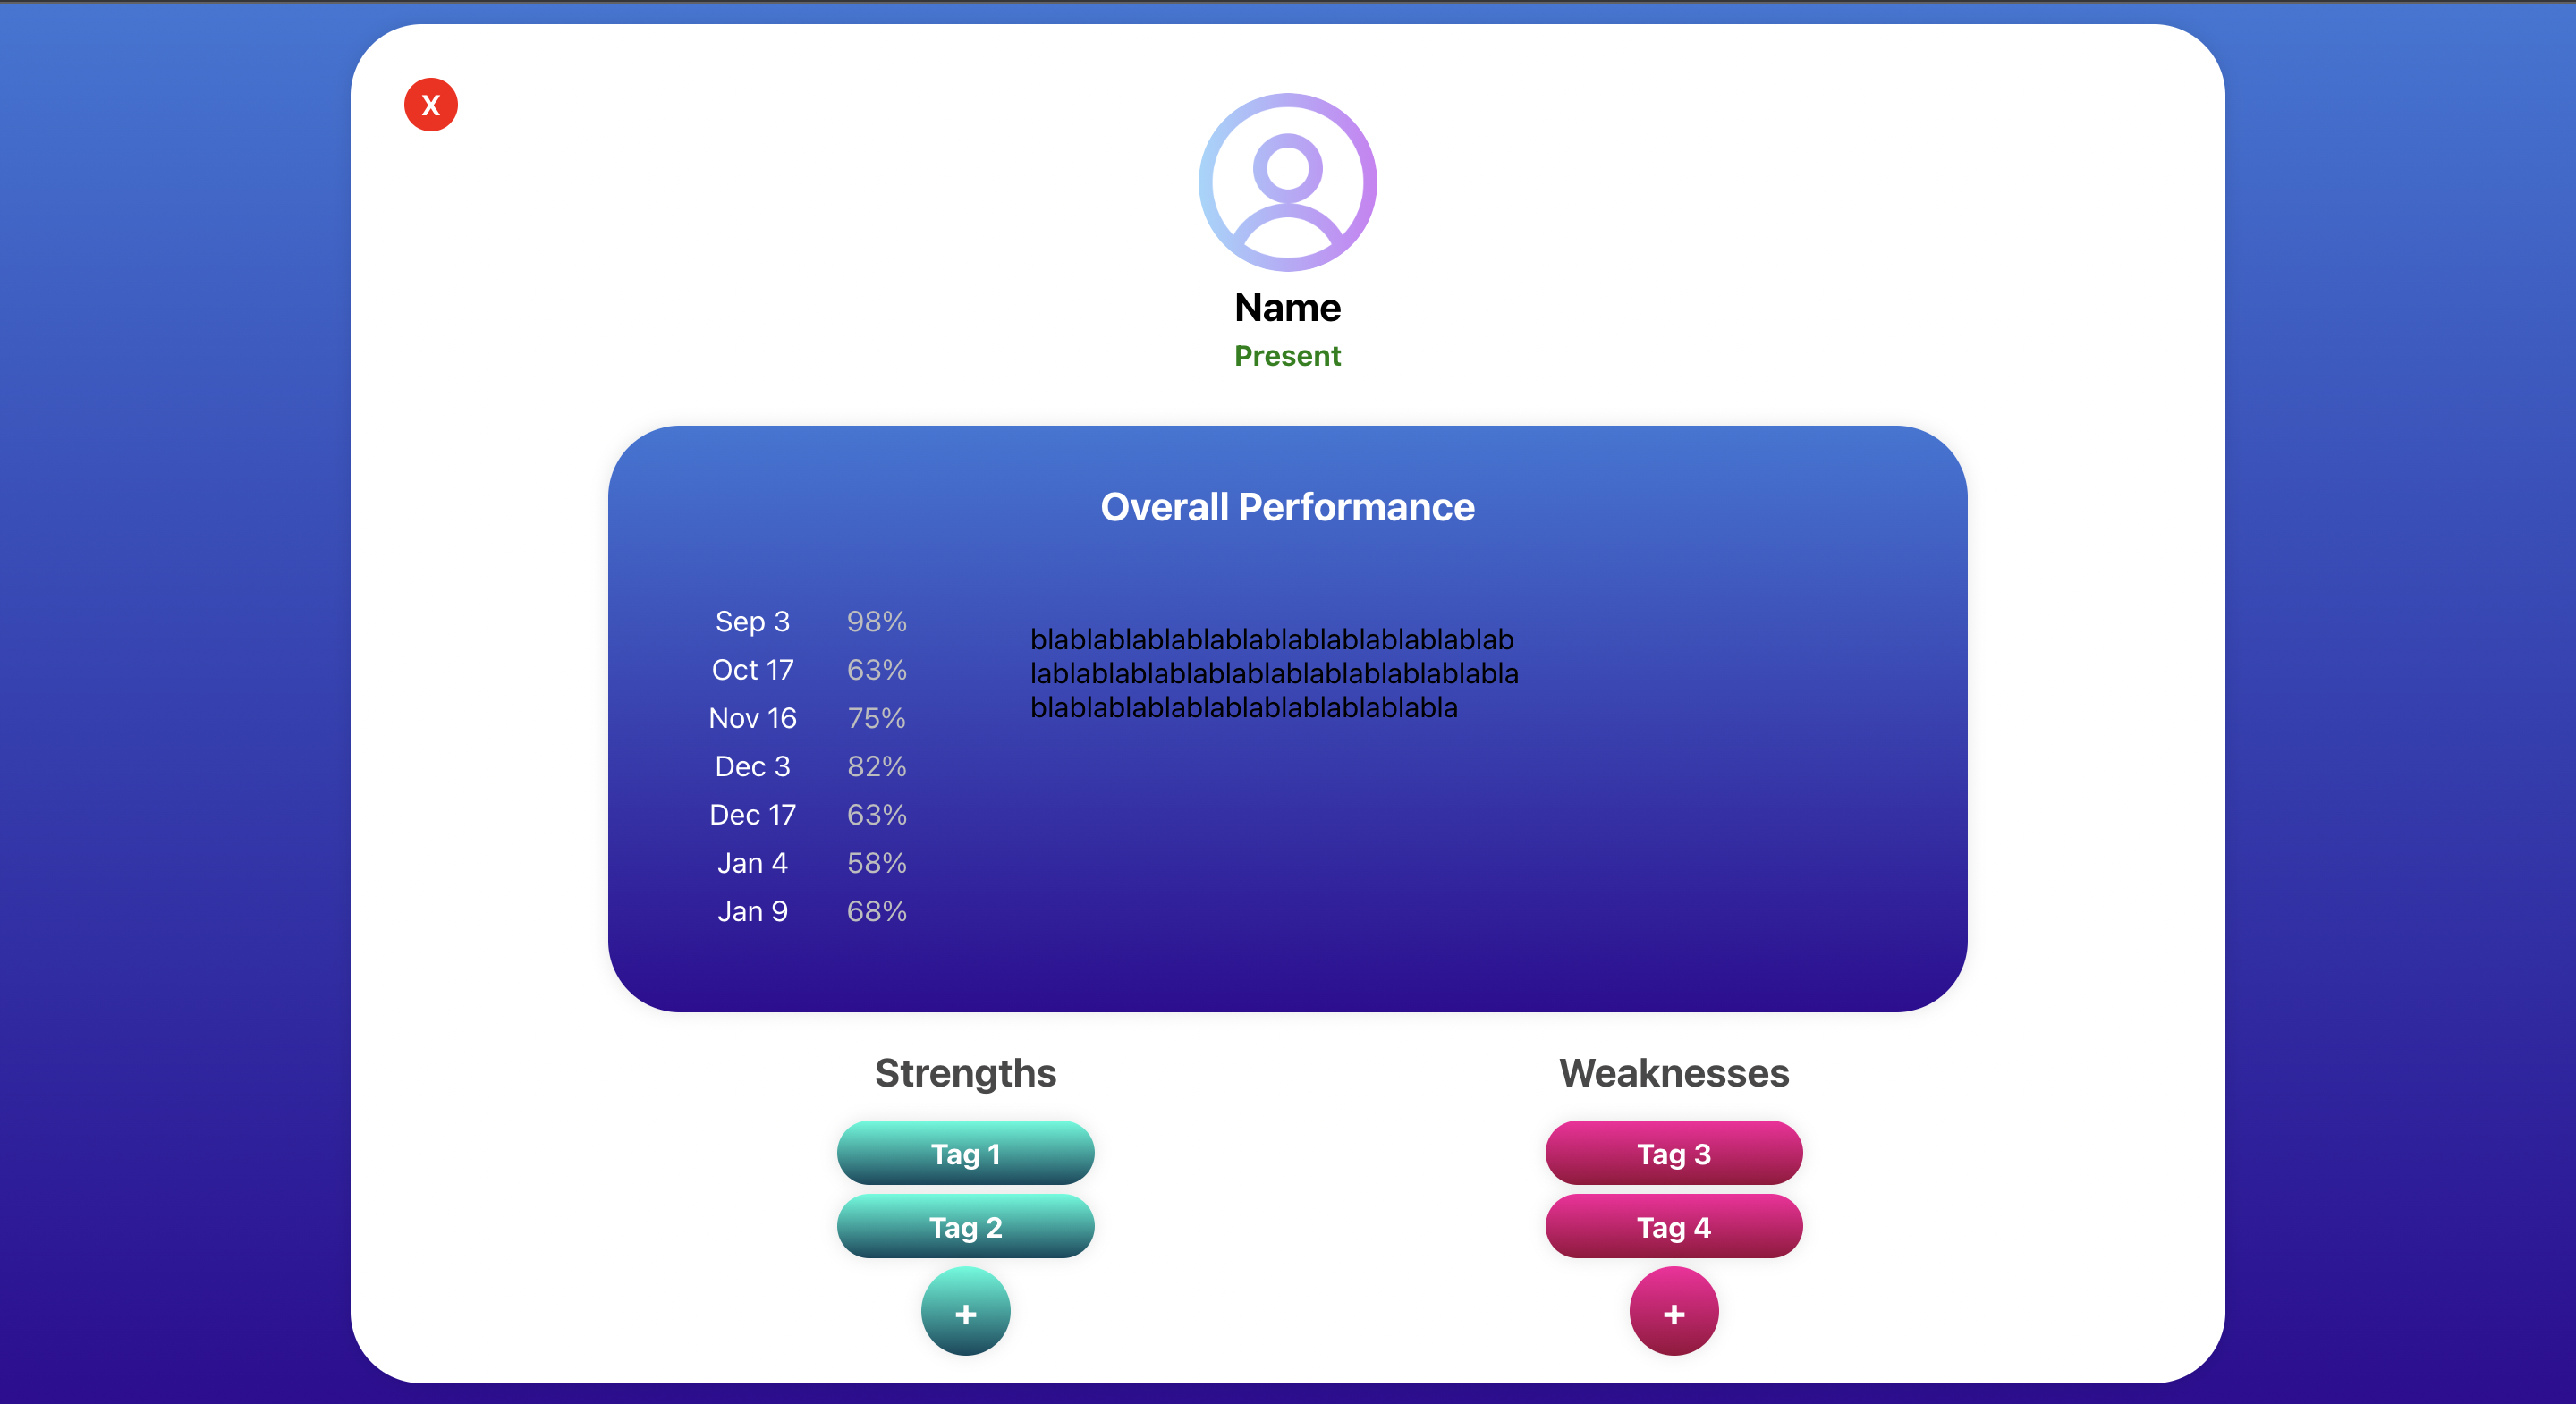
Original design: student pop-up information
-
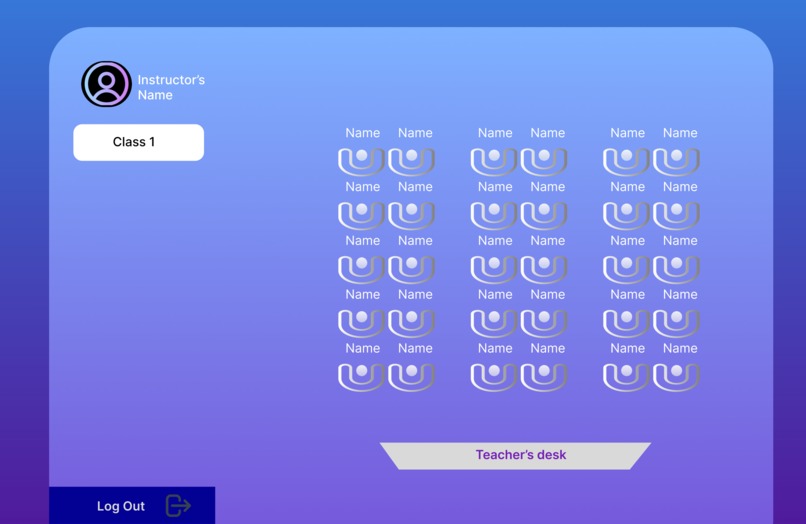
Original design: classroom overview


Inspiration 💡
We embarked on this project with the goal to create a platform to ease and improve teaching from elementary to high school. The inspiration stemmed from Liam's relatives who work in education and shared their struggle to keep track of their students' performances. We saw an opportunity to ameliorate the teacher's experience, as well as the student's pace of learning :)
What it does 🔍
Folio provides a complete overview of the classroom, where the instructor can click and view each student's information, attendance, the instructor's previous comments, perceived strengths and areas of improvement, special needs etc.
How we built it 🦾
Brainstorming&Planning: We started by outlining the project requirements, features, and data structure for the MVP. This helped in creating a roadmap for development and split the team into distinct roles: two people on the backend and two on the design and frontend side. Development: We implemented the project using Javascript, Node.js - Express for Folio's data, and previewed and built the UI using Figma, Html, CSS and React. Integration&Testing: Rigorous testing was performed to identify and resolve bugs.
Challenges we ran into 🧠
Connecting the backend to the frontend was not a familiar maneuver to any of us: thankfully our wonderful mentors were here to walk us through it!
Accomplishments that we're proud of 🌟
This is our first Hackathon!!
- Learning backend from scratch, and implementing it by following a single video tutorial
- Learning to use Figma and VSCode the same day
- Connecting the database to our frontend platform successfully ✨ ## What we learned ✍️ Building a functional MVP is better than coming up with a perfectly-designed, overly ambitious project that doesn't work!
What's next for Folio ❓
Our MVP can be complemented in a number of ways. Our vision involves these 3 immediate steps:
- Building the student interface
- Adding a function to assign students in randomly generated groups, and implement a visual representation of it
- Generate graphs and charts for the teacher to visualize the cohort's&individual performances


Log in or sign up for Devpost to join the conversation.