-
-
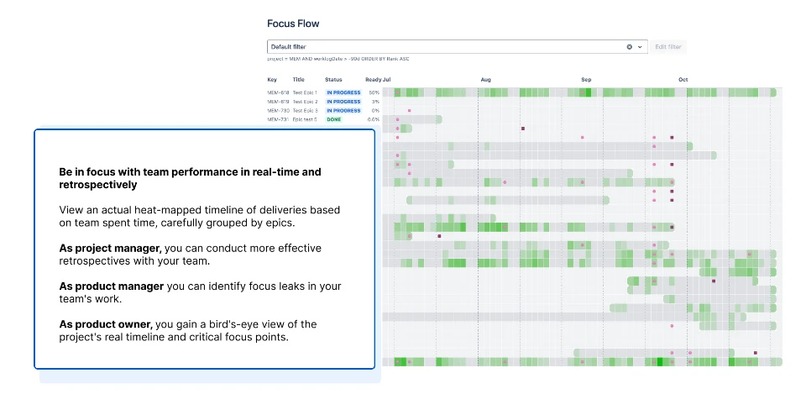
Interface
-
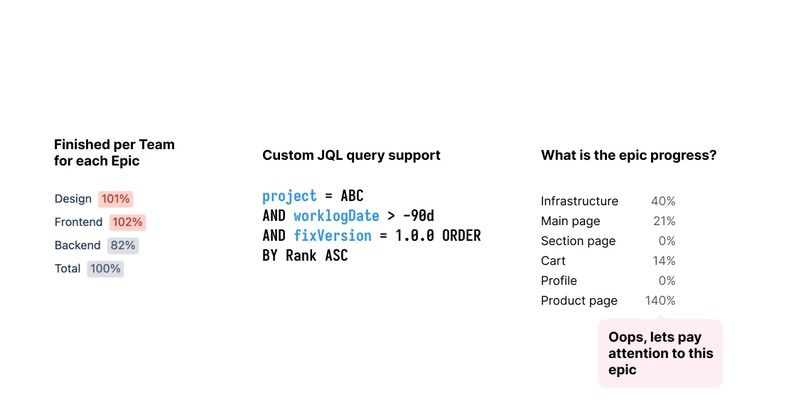
More features
-
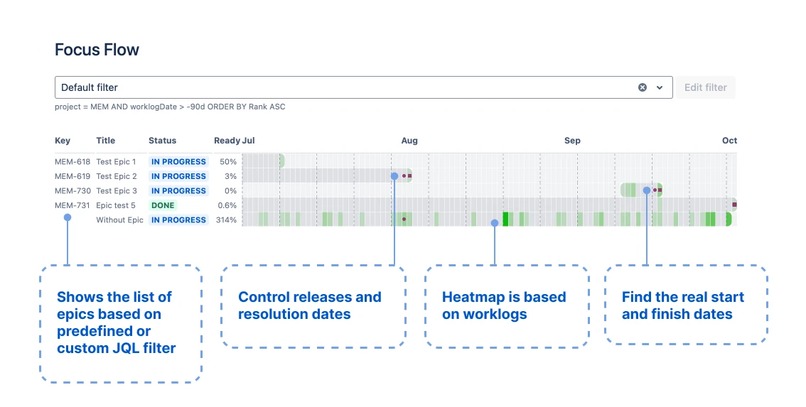
How to read
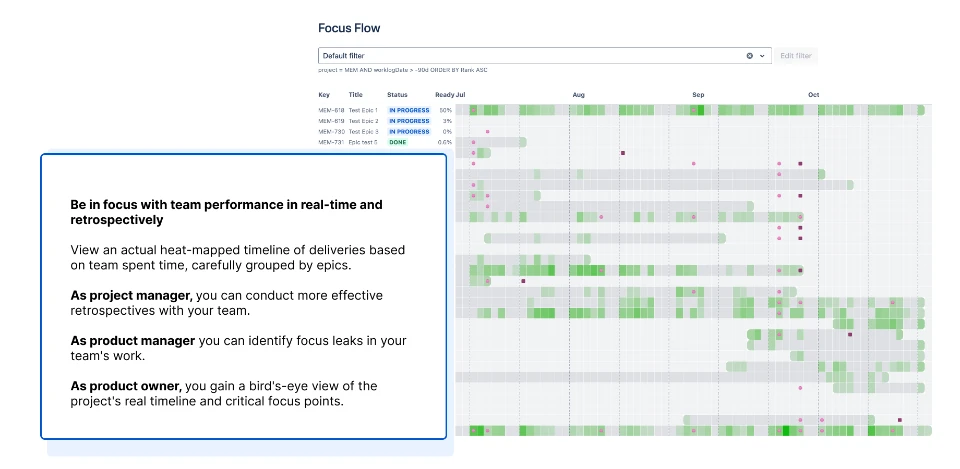
Inspiration
I was inspired by the need for my team and customers to have a clear, visual representation of their work progress in Jira. Traditional reports lacked the dynamic insight needed for tracking focus, time, and release cycles in agile environments. We aimed to simplify seeing the big picture without spending hours sifting through data.
What it does
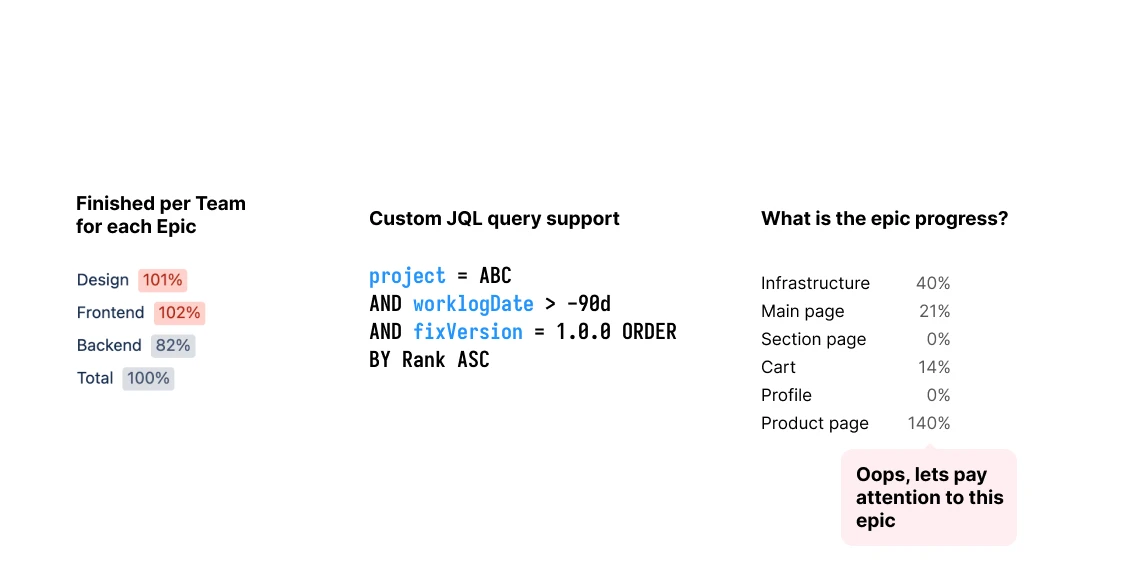
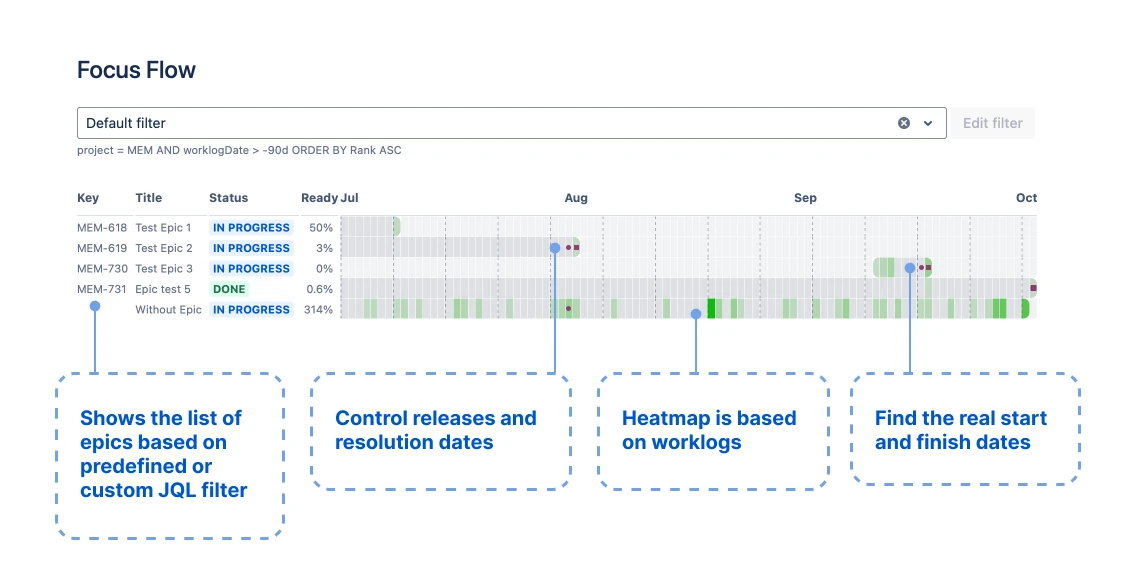
Focus Flow is a Jira plugin that generates a heatmap to visualize time spent on epics, tracks team progress, and highlights key milestones like release points and resolution dates.
How we built it
After countless sketches and deep dives into visualization research, especially insights from Tafti’s books, I found the most beautiful and intuitive way to represent real progress. This approach combines aesthetics with clarity, ensuring that both teams and customers can quickly grasp what’s happening.
Challenges we ran into
One major challenge was optimizing data retrieval from Jira’s API to ensure smooth performance, particularly for teams with heavy worklogs. Another was designing an interface that works equally well for both large and small teams, balancing detail with simplicity.
Accomplishments that we’re proud of
We successfully filled a gap in the Jira ecosystem by offering a unique visual approach to tracking progress. Early feedback has been incredibly positive, with customers appreciating how they can review a month’s worth of work in just minutes.
What we learned
The combination of technical expertise, project management insights, and design thinking can lead to truly sophisticated solutions that meet complex needs.
What’s next for Focus Flow
Our next steps are to acquire our first customers from the Jira Marketplace, add more details to the timeline (such as sprint and release dates), introduce a custom filter interface, and eventually develop a prediction model to alert project managers about potential risks.


Log in or sign up for Devpost to join the conversation.